Pa
ge
1
Research in Business and
Social Science
IJRBS Vol 8 No 3, Special Issue ISSN: 2147-4478
Contents available at www.ssbfnet.com/ojs
https://doi.org/10.20525/ijrbs.v8i3.255
Financial Literacy in Turkey: A Field Study to
Touch Base with the OECD
Ali Coskun
Corresponding Author: Department of Management, Bogazici University, Istanbul, Turkey. [email protected]
ORCID ID: 0000-0003-1723-1107
Muhammed Abdullah Sahin
School of Business, Department of Economics and Finance, Medipol University, Istanbul, Turkey. ORCID ID: 0000-0003-0675-8317
Alperen Zengin
Department of Management, Bogazici University, Istanbul, Turkey. ORCID ID: 0000-0002-3080-9156
Abstract
We measure the level of financial literacy in Turkey using the OECD/International Network on Financial Education (INFE) methodology and compare our results with the ones obtained in 14 other countries that has used the same methodology. In our sample, financial knowledge and financial behavior levels are lower than the average of the 14 countries, whereas financial attitude level is around the average. The overall financial literacy score, which is a combination of the three aforementioned aspects, is also lower than the average of the 14 countries. We find that financial behavior is positively related with financial knowledge, female respondents are lagging behind the male respondents in financial literacy, and this lag is bigger than those in the 14 countries. Very young respondents and old respondents are less financially literate, financial literacy score is positively related with income, education, and income stability.
Key words: Financial Awareness, Financial Capability, Financial Literacy, Financial Literacy Score
Peer-reviewed Academic Journal published by SSBFNET with respect to copyright holders.
Pa
ge
2
Introduction
Financial literacy, together with related concepts such as financial capability and financial sophistication, has recently been attracting more attention from policy makers, financial institutions and consumer organizations. As one reflection of this increasing attention, the Organisation for Economic Co-operation and Development (OECD) and the International Network on Financial Education (INFE) have recently supported and coordinated field studies aimed at measuring financial literacy in 14 countries, namely, Albania, Armenia, British Virgin Islands, Czech Republic, Estonia, Germany, Hungary, Ireland, Malaysia, Norway, Peru, Poland, Republic of South Africa and UK.
In line with the increasing interest in financial literacy and related education and policy efforts around the globe, politicians, government-sponsored institutions and the private sector are paying more attention to financial literacy in Turkey. Moreover, the capital markets have been lagging behind the strong performance of the economy in the last decade, and there is a widely-held view that more inclusive and deeper capital markets in the country would significantly boost the economic performance in the mid- and long-run by increasing the savings rate and providing funds to companies. This additional motivation to improve financial literacy probably makes it one of the most popular finance concepts with the government and the private sector.
In this study, we present the measurement of financial literacy in Turkey and compare our results with those in the 14 countries. This is an attempt towards taking a snapshot of the current situation, thus giving policy guidance to interested parties and also making it easier to benchmark policy efforts with other countries. In the following, we review the literature first, then explain the methodology followed by the results and discussion, and lastly conclude.
Literature Review
Miller, Godfrey, Levesque and Stark (2009) emphasize the importance of financial literacy in developing countries. They argue that financial literacy will impact the economies of these countries positively through two channels: (1) by helping people make sound financial decisions and thus keep their finances healthy, (2) by promoting access to finance. This will enhance the functioning of the financial markets and strengthen the economy. In a study that provides evidence in favor of the second channel mentioned above, Van Rooij, Lusardi and Alessie (2011) examine Dutch data and find that people with low financial literacy are less likely to invest in the stock market.
In support of the first channel mentioned by Miller et al (2009), Boon, Yee and Ting (2011) find in their field study in Malaysia that financially-literate individuals are involved to a greater extent in personal financial planning. Better financial planning can be considered more of a long-run benefit for individuals, and its impact on the macroeconomic performance of the country may not be immediate. Although this makes financial literacy less of a priority for a short-sighted politician, it still very important for today’s politician that has concern about a financially sound retirement for today’s workforce. In a theoretical study that confirms Boon et al (2011), Lusardi, Michaud and Mitchell (2011) build a model that endogenizes the decision to acquire financial literacy. Their simulation findings suggest that individuals with a stable income and a generous retirement benefit plan may choose to remain financially illiterate as it is costly to acquire and maintain financial literacy. Instead, they rely on their retirement benefit. On the other hand, high-income earners, typically individuals with lower retirement benefits, choose to have a high level of financial literacy as they need to accumulate private wealth for a comfortable retirement. Another important finding in their study is a very high level of wealth inequality due to the divergence among individuals in terms of private wealth accumulation and financial literacy.
Further evidence in favor of financial literacy as a factor leading to a better retirement planning comes from Lusardi and Mitchell (2007). They analyze data from a survey and find that financial literacy is an important determinant of retirement planning. They also find that exposure to economics in school and company-based financial education programs are associated with higher financial literacy. In line with the implications of this model, Lusardi and Mitchell (2011) give an overview of a number of studies that look into the association
Peer-reviewed Academic Journal published by SSBFNET with respect to copyright holders.
Pa
ge
3
between financial literacy and retirement planning in various countries and conclude that financial literacy enhances retirement planning.
Gerardi, Goette and Meier (2010) find evidence consistent with the above findings when they analyze survey data collected in 2008 together with matched administrative data to focus on subprime mortgage delinquency in the US. In particular, they find a negative relationship between mortgage delinquency and numerical ability, which is regarded a component of financial literacy by most researchers in this field.
The studies mentioned above all suggest that financial literacy is very important for the well-being of individuals. However, there are also studies with findings that do not favor financial literacy education so much.
Mandell and Klein (2009) find that in their data set a personal financial management course taken 1-4 years earlier does not translate into a higher financial literacy level. This finding casts doubts about the long-term effectiveness of financial literacy education. In line with this, Cole and Shastry (2009) find that although education increases financial market participation, financial literacy education does not have such an effect. They also find that cognitive ability, whether innate or acquired through education, enhances financial market participation.
Willis (2008) takes a tough stance against financial literacy education: She argues that consumers cannot really catch up with the complexity of the financial products through financial literacy education while authorities in charge of market regulation assume, they can. The result is that consumers are blamed for their financial problems, which is not right according to the author. The author suggests that financial literacy initiatives should be replaced by policies that actually improve the outcome of consumers’ financial affairs.
Research and Methodology
To benefit from the experience accumulated by the Organisation for Economic Co-operation and Development (OECD) and the OECD International Network on Financial Education (INFE) and to make our results comparable to a greater number of studies, we used the OECD questionnaire and the methodology guidance developed by the INFE. (OECD/INFE, 2011).
The methodology implemented by the OECD and the INFE measures financial literacy by first measuring its three components: Financial knowledge, financial behavior, and financial attitude. These components are then combined into a single overall measure of financial literacy. In our view, this two-step approach has two advantages: (1) decomposing financial literacy into its components makes its measurement easier, (2) the components themselves may give valuable insight that could otherwise be overlooked.
We had the questionnaire run by a company that has expertise in conducting field studies. Sampling was designed to draw a sample that is representative of the whole country. People who were 18 years old or older were interviewed face-to-face. We have 1230 responses available for analysis.
We now present and discuss the results.
Result and Discussion
Financial Knowledge
We measure financial knowledge by the 8 questions developed by the OECD and the INFE to test basic numeracy and the knowledge of time-value-of-money, interest, risk-return tradeoff, inflation, and diversification.
The “Division” question measures basic numeracy. With 87.40% correct response, Turkey falls in the mid-range of the 14 countries; 8 countries score higher and 5 score lower.
A note about the implementation of the questionnaire is in order at this point: There are questions that were either tt or replaced by alternative questions in the field studies in some of the 14 countries. For this reason, the number of countries we benchmark our results with do not always add up to 14. Please refer to Atkinson and Messy (2012) for details.
Peer-reviewed Academic Journal published by SSBFNET with respect to copyright holders.
Pa
ge
4
The “Time-value-of-Money” question measures the awareness that money available now is better than money available in the future. With 37.24% correct response, our sample is at the bottom of the range of the 14 countries. This is surprising because the Turkish economy had had around two decades of high inflation before it stabilized in the last decade, and hence we would expect people to be highly aware of the time-value-of-money. One possible explanation is that people tend to forget or ignore economic experiences that are in distant past and hence have not benefited from the earlier high inflation experience.
The “Interest paid on a loan” question tests whether the subject knows the meaning of interest. With 83.90% correct response, Turkey scores around the same as 1 country, higher than 3 countries, and lower than 8 countries, only 3 of which scored 90% or higher.
The “Calculation of interest plus principle” question adds to the previous question the challenge of doing the arithmetic right. With 42.52% correct response, Turkey scores better than 2 countries only. The highest correct response rate among the 14 countries is 76%.
The “Compound interest” question tests the knowledge of compound interest computation. Subjects are required to have answered the Calculation of interest plus principle question correctly in order for their response to this question to count. With 18.86% correct response, Turkey scores better than only 3 countries on this question. The highest correct response rate among the 14 countries is 54%.
The “Risk and return” question tests the understanding of the risk-return tradeoff. We asked two versions of the question. The first version is arguably phrased for individuals who are somewhat familiar with financial terminology, and the second version is rephrased for the financially untrained. With a correct response rate of 87.07% in the first and 83.58% in the second version, Turkey is the best in understanding the risk-return tradeoff. There is a surprising detail: Since capital market participation in Turkey is not very broad, we would expect the second version of the question to capture more correct responses, but this expectation is negated by the data.
The “Definition of inflation” question tests the understanding of inflation. With 76.59% correct response rate, Turkey does better than 4 countries, but is not far behind the rest as only 2 countries score higher than 90%. The “Diversification” question tests the understanding of the benefit from diversification. Similarly to the Risk and return question, we asked two versions of the question. The first version is arguably phrased for individuals who are somewhat familiar with finance terminology, and the second version is rephrased for the financially untrained/excluded. We have a correct response rate of 50.08% for the first version and 68.94% for the second version. Turkey has the highest rate with respect to the latter figure. However, because 11 out of the 14 countries used the first version, our results do not allow us to draw unambiguous conclusions about this component of financial knowledge. (We use the responses to the second version in calculating the knowledge scores.)
Overall, the knowledge of “Time-value-of-Money”, “Interest paid on a loan”, “Calculation of interest plus principle”, and “Compound interest” are below-average whereas the knowledge of the risk-return tradeoff, and the benefit of diversification are above-average in our sample compared to the 14 countries. This suggests that policy makers need to focus on a subset of the skills that contribute to financial literacy. We next form a financial knowledge score. For all the questions other than the “Compound interest” question, a correct response earns a respondent 1 point. As for the “Compound interest” question, if both of the “Calculation of interest plus principle”, and the “Compound interest” questions are answered correctly, the subject earns 1 point. We then sum up the points earned for the 8 questions to obtain the financial knowledge score of a respondent. The sample average, median, and standard deviation of the score are 5.03, 5, and 1.91, respectively. Table 1 shows the frequency distribution of the scores. Around 60% of the respondents got a score of 4, 5 or 6.
Peer-reviewed Academic Journal published by SSBFNET with respect to copyright holders.
Pa
ge
5
Table 1: Frequency Distribution of The Financial Knowledge Scores
Score Frequency 0 32 1 42 2 56 3 100 4 179 5 294 6 269 7 137 8 121
The sample averages for the 14 countries range from 4.6 to 6.1. The modal (the most frequently obtained) score in Turkey is 5, whereas the same statistic has a value of 6, 7, or 8 in 13 of the 14 countries. Around 43% of our sample obtained a score of 6 or higher; that is better than 3 countries out of 14. Overall, the financial knowledge score of the Turkish population is in the low-mid range of the 14 countries. Interestingly, the level of economic development does not predict the level of financial knowledge well; Norway scores poorly, and the UK, and Germany are not the top-performers.
Financial Behavior
The Financial behavior is measured by 8 questions that test whether the individual is behaving in a financially responsible way. These questions are about spending responsibly, paying bills on time, taking care of one’s own financial affairs, pursuing long-term financial goals, having budget as a household, saving money, making informed purchases of financial products, and avoiding debt when running out of money. Responses to the first 4 questions are taken on a 5-level Likert scale (1 indicates strong disagreement and 5 indicates strong agreement with the statement given in the question). We assume a response of 4 or 5 suggests strong positive behavior on the relevant issue.
The 80% of our respondents choose 4 or 5 on the scale as a response to the question on spending responsibly. We interpret this as 80% of our sample carefully considering whether they can afford something before they buy it. This is higher than the same statistic for 5 out of the 14 countries.
70% of the respondents give a response of 4 or 5 to the question on paying bills on time. This is better than only 2 countries of the 14.
In response to the question on taking care of financial affairs, around 48% of our respondents indicate they keep a close personal watch on their financial affairs. This is by far the lowest rate when compared to the 14 countries.
The question on pursuing term financial goals indicates that around 36% of the respondents set long-term financial goals and strive to achieve them. Only 1 country, out of the 14, has a lower rate.
The rest of the questions are either free-response questions or multiple-choice questions.
To gauge the behavior towards budgeting, we first ask the respondents who, in their household, is responsible for day-to-day decisions about money. Next, we ask them whether the household has a budget. If the respondent is involved in the day-to-day decisions about money, and also the household has a budget, we consider this positive behavior towards budgeting. Around 55% of our respondents are responsible for daily money matters in their households, and also have a budget household. Only 2 out of the 14 countries score better. This result suggests that Turkish people may not have a strong resolution to live up to a high standard in terms of discretionary financial behavior but are better in complying with hard constraints (e.g. a budget constraint).
Peer-reviewed Academic Journal published by SSBFNET with respect to copyright holders.
Pa
ge
6
We ask the respondents whether they have personally saved money during the previous 1 year by citing a list of possible ways of saving. We categorize saving money in one’s bank account as passive saving, and other types of saving as active. Around 21% of the respondents save actively, placing our sample ahead of only 1 country among the 14 countries.
Our questionnaire has a question to detect informed purchases of financial products. We have a three-level assessment for this question. If the respondent made an attempt to make an informed decision, s/he receives 1 point, if s/he indeed obtained information from one or several resources, then s/he receives 2 points. Otherwise, s/he receives 0 points. Around 56% percent of the respondents score 0 points. There are 5 out of the 14 countries that have a higher percentage of 0 points. The range is between around 28% and 68%. Those who received 1 point constitute only around 3% whereas those who received 2 points constitute around 41% of our sample. This pattern is reversed for the 14 countries; the proportion of the respondents who received 1 point to those who received 2 points is much higher than in our sample.
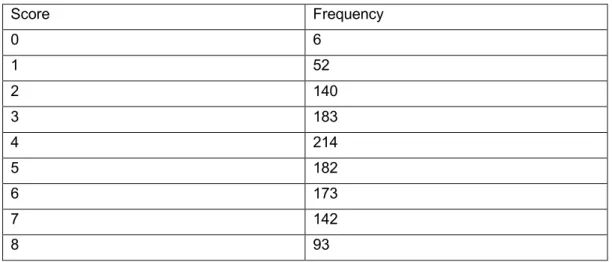
The last behavior question aims to find out whether people avoid debt when running out of money. Respondents were asked whether their income had been insufficient to cover their living expenses during the previous 12 months. Only those who answered this question affirmatively were further asked what they did to make ends meet the last time this happened. If a respondent mentioned any kind of borrowing as one of the actions taken to make ends meet, that respondent was classified as one who borrowed to make ends meet, and s/he received 0 points for this question. Otherwise, the respondent received 1 point. Around 30% of the respondents in our sample received 0 points. This rate is higher than in 12 of the 14 countries. We next form a financial behavior score. For the first 4 questions, a response of 4 or 5 on the Likert scale receives 1 point, and other responses receive 0 points. For the budget question, if a respondent is responsible for day-to-day decisions about money, and also the household has budget, s/he receives 1 point and 0 points otherwise. For the question on active saving, if a respondent saves actively, s/he receives 1 point and 0 points otherwise. (Assessment of the questions on informed purchases of financial products and on avoidance of debt when running out of money are given above). We sum up the points for all 8 questions to obtain the financial behavior score of a respondent. The sample average, median, and standard deviation of the score in our sample are 4.74, 5, and 2.10, respectively. Table 2 shows the frequency distribution of the scores. Around 61% of the respondents got a score of 3, 4, 5 or 6.
Table 2: Frequency Distribution of The Financial Behavior Scores
Score Frequency 0 6 1 52 2 140 3 183 4 214 5 182 6 173 7 142 8 93
The sample averages for the 14 countries range from 4.5 to 6.1. The modal score in Turkey is 4. The same statistic has a value of 5, 6, or 7 in 13 of the 14 countries. Around 37% of our sample obtained a score of 6 or higher; that is better than only 1 country out of 14. Overall, the financial behavior score of our sample is at the lower end of the range of the other 14 countries. As is the case for the financial knowledge scores, the level of economic development does not predict the level of financial behavior well.
Peer-reviewed Academic Journal published by SSBFNET with respect to copyright holders.
Pa
ge
7
Financial Attitude
The third component of financial literacy is financial attitude. The three financial attitude questions aim to measure an individual’s preferences towards enjoying the moment with the money that is currently available versus planning for the future and spending the money responsibly. The responses are taken on a 5-level Likert scale. We assume that a respondent is demonstrating strong positive attitude on the relevant issue when s/he chooses 1 or 2 on the scale. (The questions are stated so that disagreement with the statement indicates positive attitude.).
The first question asks whether the respondent finds it more satisfying to spend money than to save it for the long term or not. Around 52% of the respondents in our sample demonstrate positive financial attitude. This result is better than 9 out of the 14 countries.
The second question asks whether the respondent tends to take each day as it comes and is not concerned about tomorrow or not. Around 62% of our respondents demonstrate positive financial attitude. This result is better than 6 out of the 14 countries, placing us in the middle of the 14 countries.
The third question asks whether the respondent agrees money is there to be spent. Around 31% of our respondents disagree. Only 4 out of the 14 countries have a higher percentage of disagreement.
Overall, compared to the 14 countries, our sample fares relatively better in terms of financial attitude than in terms of financial knowledge and financial behavior.
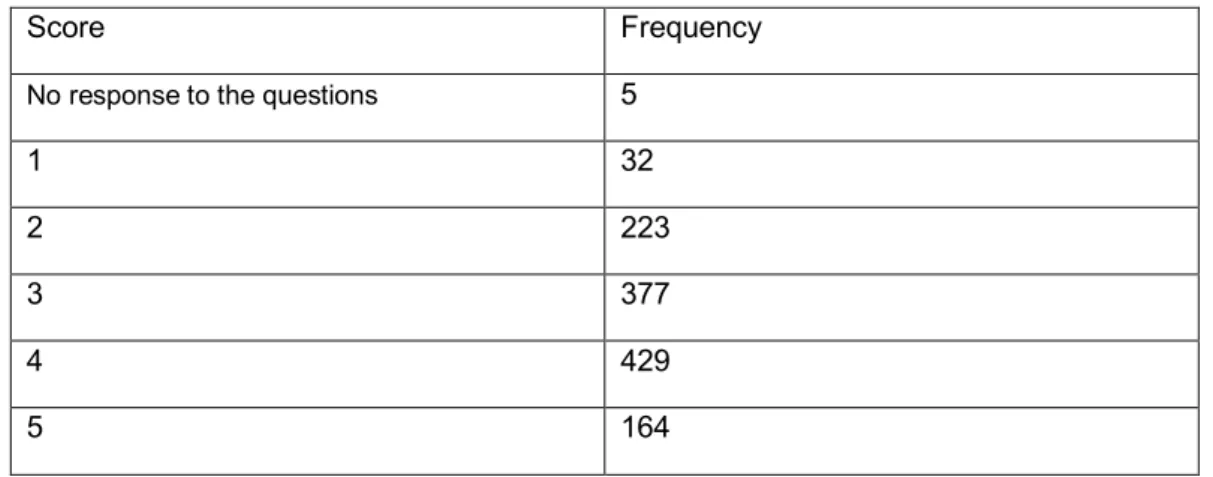
We next form a financial attitude score. For each of the 3 questions, the respondents are given a score of [6 minus their choice on the Likert scale]. For instance, a response of 1 earns [6-1=5] points. Refusal to respond to a question earns 1 point. Then, the scores for the three questions are added up and the result is divided by 3 to obtain the attitude score of the respondent. Thus, the higher the attitude score, the more positive the financial attitude is. If a respondent refuses to answer all three attitude questions, s/he is not assigned an attitude score. (There are 5 such respondents.) The sample average, median, and standard deviation of the score are 3.38, 3.33, and 0.97, respectively. Table 3 shows the frequency distribution of the rounded scores.:
Table 3: Frequency Distribution of The Financial Attitude Scores (Rounded Scores Are Used)
Score Frequency
No response to the questions 5
1 32
2 223
3 377
4 429
5 164
The sample averages for the 14 countries range from 2.3 to 3.7. The mode of the rounded scores in Turkey is 4. The same statistic has a value of 2 in 1 country, 3 in 5 countries, and 4 in 8 countries out of the 14 countries. 59.11% of our sample obtained a score that is higher than 3; this is better than 8 countries out of 14. Overall, the financial attitude of our sample is around the average of the 14 countries. As is the case for the financial knowledge and the financial behavior scores, the level of economic development does not predict the level of financial attitude well.
Peer-reviewed Academic Journal published by SSBFNET with respect to copyright holders.
Pa
ge
8
Relationship between Financial Knowledge, Financial Behavior, and Financial
Attitude
We expect a positive relationship between financial knowledge and financial behavior. To see if our sample provides support to this prediction, we group the respondents according to their financial knowledge score, calculate the average of the financial behavior scores for each group, and plot the data with financial knowledge score on the horizontal axis and the averages of the financial behavior scores on the vertical axis. The resulting graph can be seen in Figure 1. We see a clear upward trend in the data, which is in line with our prediction. The same is true in general for the 14 countries.
Figure 1: Average Financial Behavior Scores by Financial Knowledge Score
Similarly, we expect a positive relationship between financial attitude and financial behavior. To see if that is the case in our sample, we group the respondents according to their rounded financial attitude score, calculate the average of the financial behavior scores for each group, and plot the data with financial attitude score on the horizontal axis and the averages of the financial behavior scores on the vertical axis.
The resulting graph can be seen in Figure 2. We see a slight downward trend with increasing financial attitude score. This is in contrast with 8 out of the 14 countries; we see a generally-upward-sloping graph for each of these 8 countries. The remaining 6 countries have graphs that do not reveal a clear pattern.
Peer-reviewed Academic Journal published by SSBFNET with respect to copyright holders.
Pa
ge
9
Financial Literacy
We add up the three scores formed above to obtain the overall financial literacy score. The sample average, median, and standard deviation of the score are 13.17, 13.33, and 3.51, respectively. The sample averages for the 14 countries range from 12.4 to 15.1. The overall financial score of our sample is closer to the lower end of the range for the 14 countries. As is the case for financial knowledge, financial behavior, and financial attitude, the level of economic development does not predict the overall level of financial literacy well. As an alternative measure, we count the number of respondents with 0, 1, 2, and 3 high scores. For financial knowledge, the financial behavior, and financial attitude, we consider a score of 6, 6, and 3.01 a high score, respectively. We then count the number of high scores attained by each respondent. 226 respondents have no high scores, 463 respondents have 1 high score, 379 respondents have 2 high scores, and 162 respondents have 3 high scores. The modal number of high scores is 1. Table 4 shows the frequency distribution of the scores. The same statistic has a value of 1 for 5 countries, and a value of 2 for 9 countries out of the 14 countries. By this measure, financial literacy in Turkey is closer to the lower end of the spectrum of the results in the 14 countries.
Table 4: Frequency Distribution of The Number of High Scores of The Respondents
Number of High Scores Frequency Percentage
0 226 18,37%
1 463 37,64%
2 379 30,81%
3 162 13,17%
Variation of Financial Literacy by Gender
Of the 1230 respondents in our sample, 589 are male, and 641 females. 50.42% of the male respondents and 35.88% of the female respondents achieve a high financial knowledge score (6 or more). This result is qualitatively similar to the results from the 14 countries; in 13 countries a bigger percentage of male respondents achieve a high financial knowledge score compared to female respondents. In 5 of these countries, the difference in the percentages is more than in our sample. There are only 2 countries where male respondents achieve a lower percentage than in our sample.
The 47.20% of the male respondents and 27.30% of the female respondents achieve a high financial behavior score (6 or more). The gender gap in our sample with regard to the achievement of high financial behavior score is greater than in all of the 14 countries. Moreover, in 4 out of the 14 countries, a higher percentage of female respondents than male respondents achieve a high financial behavior score.
55.01% of the male respondents and 62.87% of the female respondents achieve a high (greater than 3) financial attitude score. This result is qualitatively similar to the results from the 14 countries; in 10 countries a bigger percentage of female respondents compared to male respondents achieve a high financial attitude score, and in 2 countries the percentages are the same.
Variation by gender in financial attitude has quite a different pattern compared to those in financial knowledge and financial behavior. This evidence may have important implications for financial education efforts and may deserve further field studies.
Table 5 shows the relative frequency distribution of the number of high scores by gender. The percentages seen in the table are found by dividing the number of respondents in each gender-number-of-strengths combination by the total number of respondents that are of the same gender. For instance, 71 out of 641 female respondents have three high scores. Thus, we obtain 11.08% as we divide 71 by 641. We see that
Peer-reviewed Academic Journal published by SSBFNET with respect to copyright holders.
Pa
ge
10
female respondents are overrepresented in the no-strength and one-strength categories and underrepresented in the two-strength and three-strength categories.
Table 5: Frequency Distribution of The Number of High Scores of The Respondents by Gender
No strength One strength Two strengths Strong on all components
Female 21.37% 42.28% 25.27% 11.08%
Male 15,11% 32,60% 36,84% 15,45%
All 18.37% 37.64% 30.81% 13.17%
We also compute the average overall financial literacy scores by gender. Male respondents score 13.89 on average compared to female respondents who score 12.51 on average. The difference is statistically significant at 1%-level according to the results of the t test and Wilcoxon rank-sum test. In 8 out of the 14 countries, female respondents scored significantly less than male respondents and in countries where female respondents scored higher, the difference is not significant. Our sample gives the largest gender difference and it is also significant.
Variation of Financial Literacy by Age
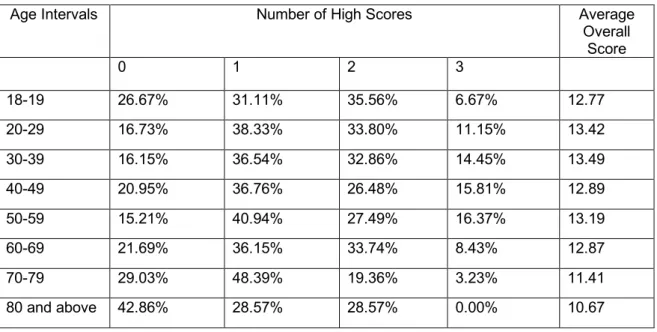
To analyze the relationship between financial literacy and age, we group the respondents into age intervals of 18-19, 20-29, 30-39, 40-49, 50-59, 60-69, 70-79, and 80 and above, and determine the percentage of respondents with no, 1, 2 and 3 high scores for each age interval. The results are shown in Table 6 and Figure 3. We see that the respondents in the middle of the age range are less likely to have no high scores and more likely to have 3 high scores compared to the younger and the older respondents. A similar pattern is observed in most of the 14 countries. We also compute the average overall financial literacy for each age interval, and check for the statistical significance of the differences between consecutive intervals. We find that the difference between the 30-39 and 40-49 age intervals (at the 10 % level), and between the 60-69 and 70-79 age intervals (at the 5% level) are statistically significant.
Table 6: Financial Literacy Segments by Age
Age Intervals Number of High Scores Average
Overall Score 0 1 2 3 18-19 26.67% 31.11% 35.56% 6.67% 12.77 20-29 16.73% 38.33% 33.80% 11.15% 13.42 30-39 16.15% 36.54% 32.86% 14.45% 13.49 40-49 20.95% 36.76% 26.48% 15.81% 12.89 50-59 15.21% 40.94% 27.49% 16.37% 13.19 60-69 21.69% 36.15% 33.74% 8.43% 12.87 70-79 29.03% 48.39% 19.36% 3.23% 11.41 80 and above 42.86% 28.57% 28.57% 0.00% 10.67
Peer-reviewed Academic Journal published by SSBFNET with respect to copyright holders.
Pa
ge
11
Figure 3: Financial Literacy Segments by Age
Variation of Financial Literacy by Income
We ask the respondents to choose an income interval that contains their income level. When we set the ranges for low, middle, and high income as [0 TL - 1,000 TL], [1,001 TL - 2,000 TL], and [2001TL and above] (note that this survey was completed at the end of 2013, so roughly, a 50% increase is due for these cutoff points), respectively, in the data, we find that low-income respondents are overrepresented in the subsamples with no high scores and 1 high score. The same pattern is observed in the 14 countries. See Table 7 for details.
Table 7: Financial Literacy Segments by Income
Income segment
High score count Total
respondents 0 1 2 3 1 (low income) 26% 42% 26% 6% 543 2 (middle income) 12% 34% 38% 16% 402 3 (high income) 8% 32% 34% 26% 220 Don't Know and Refused 29% 38% 20% 12% 65 Total 18% 38% 31% 13% 1230
We also find that average and median overall financial literacy scores increase by income, as can be seen in Table 8. Difference between the low-income and middle-income segments and the difference between the middle-income and high-income segments are statistically significant (at 1% level). A similar result is reported in the OECD report for the 14 countries.
Table 8: Overall Financial Literacy Scores by Income
Income segment Average overall score Median overall score Total respondents
1 (low income) 11.9 12 539
2 (middle income) 13.9 14.33 401
3 (high income) 15.22 15 220
Don't Know and Refused 12.35 12.67 65 0% 20% 40% 60% 80% 100% 18-19 20-29 30-39 40-49 50-59 60-69 70-79 80 and above
Peer-reviewed Academic Journal published by SSBFNET with respect to copyright holders.
Pa
ge
12
Lastly, we look at the relationship between overall financial literacy score and income stability. Households with a regular and stable income have an average score of 13.88 compared to an average of 11.32 for the households without a regular and stable income, and the difference is statistically significant. This finding is potentially significant with regard to policy implications; households with a more volatile income have the additional handicap of being less financially-literate. We elaborate more on this in the multivariate analysis below.
Variation of Financial Literacy by Education
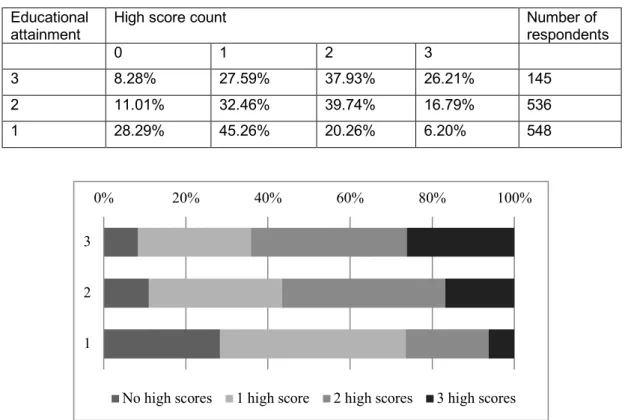
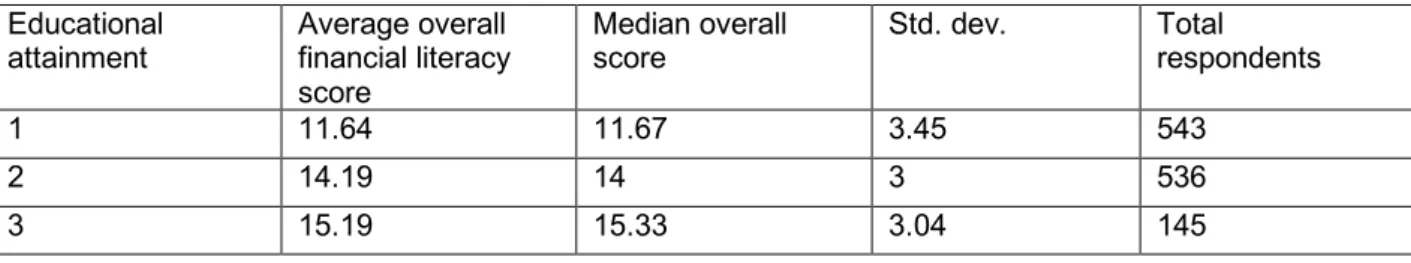
Out of the 1230 respondents, 145 have a 4-year university degree or higher, 536 at least completed secondary school and at most have a 2-year vocational school degree, 548 had some secondary school experience or lower, and 1 respondent refused to respond to the education question. We group the respondents into three educational attainment levels. A 4-year university degree or higher is denoted by an educational attainment of 3, anything from secondary school completed to a 2-year vocational school degree is denoted by an educational attainment of 2, and some secondary school experience or lower is denoted by an educational attainment of 1. The percentage of respondents with no, 1, 2 and 3 high scores for each educational attainment level can be seen in Table 9 and Figure 4. With increasing educational attainment, achievement of no high score becomes less likely and achievement of 3 high scores becomes more likely. The same pattern is observed the in the 14 countries. The average and the median overall financial literacy by educational attainment level are shown in Table 10. The differences between consecutive levels are statistically significant at 1% level.
One interesting finding: Missing overall financial literacy scores due to lack of too many responses are mostly associated with lower income and lower educational attainment.
Table 9: Financial Literacy Segments by Educational Attainment
Educational
attainment High score count Number of respondents
0 1 2 3
3 8.28% 27.59% 37.93% 26.21% 145
2 11.01% 32.46% 39.74% 16.79% 536
1 28.29% 45.26% 20.26% 6.20% 548
Figure 3: Financial Literacy Segments by Education
0% 20% 40% 60% 80% 100%
3 2 1
Peer-reviewed Academic Journal published by SSBFNET with respect to copyright holders.
Pa
ge
13
Table 10: Frequency Distribution of The Number of High Scores of The Respondents by Gender
Educational
attainment Average overall financial literacy score
Median overall
score Std. dev. Total respondents
1 11.64 11.67 3.45 543
2 14.19 14 3 536
3 15.19 15.33 3.04 145
Attitude Toward Risk
We ask the respondents whether they agree with the statement “I am prepared to risk some of my money when saving or investing” or not, with the response recorded on 5- level Likert scale. A response of 1 or 2 (strongly disagree or disagree with the statement) indicates risk-aversion, and a response of 3, 4, or 5 indicates non-risk-aversion. We find that risk-averse respondents have higher scores on average; see Table 11. However, the difference is not statistically significant. Similar results were obtained in 11 of the 14 countries, with insignificant differences between the two groups. 3 countries, however, have significant differences that range between .5 and 1.1 points. In two of these, the non-risk-averse group scores higher, and in the remaining one country, the risk-averse group scores higher.
Table 11: Overall Financial Literacy Scores by Attitude Towards Risk
No. of observations Mean Std. Dev. Median
Risk-averse 684 13.43 3.46 13.67
Non-risk-averse 500 13.16 3.33 13.33
Personal Financial Planning
We ask the respondents whether they are good at forecasting their monthly spending, whether they can balance their budget, and whether they do personal financial planning. We find that positive responses to each of the three questions are significantly positively related to the overall financial literacy score. Our results are consistent with Miller et al (2009), who argue that financial literacy will help people make sound financial decisions and thus keep their finances healthy, and with Boon et al (2011), who find that financially-literate individuals in Malaysia are involved to a greater extent in personal financial planning.
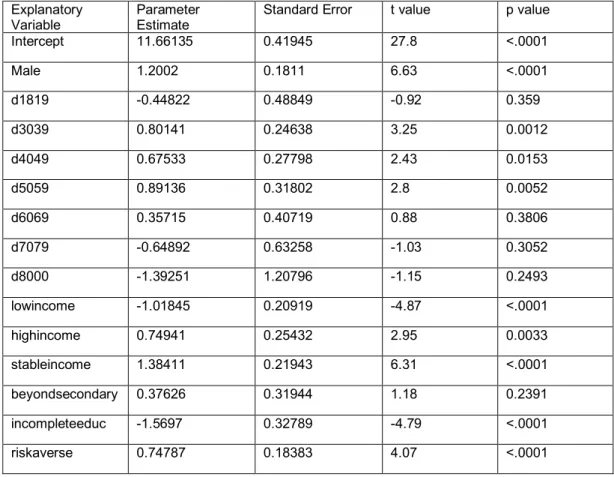
Multivariate Analysis
We run a regression to disentangle the effects of the demographic factors we examined above. The dependent variable is the overall financial literacy score, and the explanatory variables are gender, age, income, income stability, education, and attitude towards risk. Gender, income stability and risk aversion are indicated by one dummy variable each. For age, we assign a dummy variable to each age interval mentioned above (excluding the 20-29 interval). We have one dummy variable for low income and one dummy variable for high income. Similarly, we have one dummy variable for education beyond secondary school and one dummy variable for less-than-secondary-school education (incompleteeduc).
The results are reported in Table 12. Male respondents have significantly higher overall financial literacy scores; this is the case in 8 of the 14 countries. Respondents of ages 30 to 59 have significantly higher scores compared to the respondents of ages 20 to 29. Respondents of ages 60 to 69 have higher scores compared to the respondents of ages 20 to 29 although the coefficient is not statistically significant. Respondents that are 70 or older and respondents aged 18 or 19 have lower scores compared to the respondents of ages 20 to 29 although the coefficients are not statistically significant. 13 of the 14 countries have similar patterns.
Peer-reviewed Academic Journal published by SSBFNET with respect to copyright holders.
Pa
ge
14
Table 11: OLS Regression with The Overall Financial Literacy Score as The Dependent Variable
Explanatory
Variable Parameter Estimate Standard Error t value p value
Intercept 11.66135 0.41945 27.8 <.0001 Male 1.2002 0.1811 6.63 <.0001 d1819 -0.44822 0.48849 -0.92 0.359 d3039 0.80141 0.24638 3.25 0.0012 d4049 0.67533 0.27798 2.43 0.0153 d5059 0.89136 0.31802 2.8 0.0052 d6069 0.35715 0.40719 0.88 0.3806 d7079 -0.64892 0.63258 -1.03 0.3052 d8000 -1.39251 1.20796 -1.15 0.2493 lowincome -1.01845 0.20919 -4.87 <.0001 highincome 0.74941 0.25432 2.95 0.0033 stableincome 1.38411 0.21943 6.31 <.0001 beyondsecondary 0.37626 0.31944 1.18 0.2391 incompleteeduc -1.5697 0.32789 -4.79 <.0001 riskaverse 0.74787 0.18383 4.07 <.0001
Mid-income group households are significantly less financially literate compared to high-income households but significantly more financially literate compared to low-income households. The results in the 14 countries are quite similar; not all coefficients are significant, but the significant ones are consistent with our results. We have a positive but insignificant coefficient for education beyond secondary school (beyondsecondary), and a negative and significant coefficient for less-than-secondary-school education. This suggests that financial literacy increases with educational attainment, though the association may weaken beyond a certain level of education. The results from the 14 countries are the similar in their directions and they are also statistically significant in 13 out of the 14 countries.
Income stability is positively related with financial literacy, with a statistically significant coefficient; we observe the same pattern in 7 of the 14 countries. This result contrasts with that of Lusardi et al (2011), which is based on the US context. In the US, income stability and a generous retirement plan may be more likely to go hand in hand. However, that is not so much the case in Turkey. If the generosity of the retirement plan is the mediating variable between income stability and financial literacy, it is not surprising that our results contrast with theirs. However, we do not have data on retirement planning.
In sum, socio-demographic and personal characteristics are related to financial literacy in similar ways in the 15 countries including Turkey. This suggests that ways for improving financial literacy may also be similar in a wide variety of cultures and levels of economic development.
Conclusions
In this study, we aim to measure the level of financial literacy in Turkey. To this end, we use the OECD/INFE methodology. This serves two purposes: First, we benefit from the experience accumulated by the OECD and the INFE. More importantly, our results are directly comparable to a number of countries. This makes benchmarking more reliable, thereby increasing the potential of success in designing and implementing government policies regarding financial literacy.
Peer-reviewed Academic Journal published by SSBFNET with respect to copyright holders.
Pa
ge
15
The Financial knowledge and financial behavior levels of our sample are lower than the average of the 14 countries, whereas the financial attitude of our sample is around the average. The overall financial literacy score, which is a combination of the three aforementioned aspects, is also below the average of the 14 countries.
One interesting point is that the level of economic development does not predict the level of financial knowledge, financial behavior, financial attitude, and the overall financial literacy scores well.
We find that financial behavior is positively related with increasing financial knowledge. This is similar to what is observed in the 14 countries. On the other hand, we do not see a clear connection between financial attitude and financial behavior. This contrasts with the results from the 14 countries, where a generally positive association is observed.
Female respondents in our sample seem to be lagging behind the male respondents in terms of financial knowledge, and financial behavior. In contrast, female respondents have better financial attitude than male respondents do, which is similar to those from the 14 countries. Additional statistics indicate that the gender gap in financial literacy in our sample is the biggest among the 14 countries, and it is also significant In our sample:
Very young respondents and old respondents are less financially literate; this is in line with what is observed in most of the 14 countries.
Financial literacy score increases by income. A similar result is reported in the OECD report for the 14 countries.
Households with a more volatile income are also less financially literate. Once again, we see similar results reported in the OECD report for the 14 countries.
There is a positive relationship between financial literacy and education, a pattern that is also observed in the 14 countries.
We find no statistically significant difference between the levels of financial literacy of risk-averse and non-risk-averse respondents. This is the case in 11 out of the 14 countries.
If improving financial literacy is seen as an important component of increasing the welfare of the society and maintaining the soundness of financial markets in a country, then governments must take the measures necessary to regularly monitor and enhance financial literacy. This suggests that there are at least two natural extensions of our study: (1) a study similar to this must be conducted regularly, (2) public policies must be developed and implemented to increase the level of financial literacy of the citizens.
References
Atkinson, A., & Messy, F. (2012). Measuring Financial Literacy: Results of the OECD / International Network on Financial Education (INFE) Pilot Study. Paris: OECD Publishing.
doi:https://doi.org/10.1787/5k9csfs90fr4-en
Boon, T. H., Yee, H. S., & Ting, H. W. (2011). Financial Literacy and Personal Financial Planning in Klang Valley, Malaysia. International Journal of Economics and Management, Vol.5, 149-168.
Cole, S., & Shastry, G. (2009). Smart Money: The Effect of Education, Cognitive Ability, and Financial Literacy on Financial Market Participation. Boston: Harvard Business School.
doi:http://dx.doi.org/10.2139/ssrn.1317298
Gerardi, K., Goette, L., & Meier, S. (2010). Financial Literacy and Subprime Mortgage Delinquency:
Evidence from a Survey Matched to Administrative Data. Atlanta: Federal Reserve Bank of Atlanta. Lusardi, A., & Mitchell, O. (2007). Financial Literacy and Retirement Planning: New Evidence from the
Rand American Life Panel. University of Michigan Retirement Research Center. doi:http://dx.doi.org/10.2139/ssrn.1095869
Peer-reviewed Academic Journal published by SSBFNET with respect to copyright holders.
Pa
ge
16
Lusardi, A., & Mitchell, O. (2011). Financial Literacy around the World: An Overview. Journal of Pension Economics and Finance Vol. 10 No. 4, 497-508.
doi:https://doi.org/10.1017/S1474747211000448
Lusardi, A., Michaud, P., & Mitchell, O. (2011). Optimal Financial Literacy and Saving for Retirement. Financial Literacy Center. doi:http://dx.doi.org/10.2139/ssrn.1978960
Mandell, L., & and Klein, L. (2009). The Impact of Financial Literacy Education on Subsequent Financial Behavior. Journal of Financial Counseling and Planning Vol. 20, No. 1,, 15-24.
Miller, M., Godfrey, N., Levesque, B., & Stark, E. (2009). The Case for Financial Literacy in Developing Countries: Promoting Access to Finance by Empowering Consumers. Washington: The International Bank for Reconstruction and Development/The World Bank.
OECD INFE. (2011). Measuring Financial Literacy: Core Questionnaire in Measuring Financial Literacy: Questionnaire and Guidance Notes for conducting an Internationally Comparable Survey of Financial literacy. Paris: OECD.
OECD INFE. (2012). Supplementary Questions: Optional Survey Questions for the OECD INFE Financial Literacy Core Questionnaire. Paris: OECD.
Van Rooij, M., Lusardi, A., & Alessie, R. (2011). Financial Literacy and Stock Market Participation. Journal of Financial Economics Vol. 101, No. 2, 449–472.
doi:https://doi.org/10.1016/j.jfineco.2011.03.006
Willis, L. E. (2008). Against Financial Literacy Education. Iowa Law Review, Vol. 94, 199-282.
Zakariah, A., & Sabaruddin, A. K. (1994). Projection of Sectoral Value-added: Comparative Analysis of Alternative Methods. Pertanika Journal of Social Science and Human, 1-10.