Jaehyun Park, Chenxi Yuan, Hubo Cai
Long-Term Pavement Performance
Indicators for Failed Materials
JOINT TRANSPORTATION
RESEARCH PROGRAM
INDIANA DEPARTMENT OF TRANSPORTATION
RECOMMENDED CITATION
Park, J., Yuan, C., & Cai, H. (2016).
Long-term pavement performance indicators for failed materials
(Joint Transportation
Research Program Publication No. FHWA/IN/JTRP-2016/10). West Lafayette, IN: Purdue University. http://dx.doi.org
/10.5703/1288284316333
AUTHORS
Jaehyun Park
Graduate Research Assistant
Lyles School of Civil Engineering
Purdue University
Chenxi Yuan
Graduate Research Assistant
Lyles School of Civil Engineering
Purdue University
Hubo Cai, PhD
Associate Professor of Civil Engineering
Lyles School of Civil Engineering
Purdue University
(765) 494-5028
[email protected]
Corresponding Author
ACKNOWLEDGMENTS
This project was made possible by the sponsorship of the Joint Transportation Research Program (JTRP) and the
Indiana Department of Transportation (INDOT). The authors acknowledge the valuable assistance and technical
guidance from the members of the Study Advisory Committee in the course of performing this study.
JOINT TRANSPORTATION RESEARCH PROGRAM
The Joint Transportation Research Program serves as a vehicle for INDOT collaboration with higher education
institutions and industry in Indiana to facilitate innovation that results in continuous improvement in the planning,
design, construction, operation, management and economic efficiency of the Indiana transportation infrastructure.
https://engineering.purdue.edu/JTRP/index_html
Published reports of the Joint Transportation Research Program are available at http://docs.lib.purdue.edu/jtrp/.
NOTICE
The contents of this report reflect the views of the authors, who are responsible for the facts and the accuracy of
the data presented herein. The contents do not necessarily reflect the official views and policies of the Indiana
Department of Transportation or the Federal Highway Administration. The report does not constitute a standard,
specification, or regulation.
COPYRIGHT
Copyright 2016 by Purdue University. All rights reserved.
Print ISBN: 978-1-62260-394-7
TECHNICAL REPORT STANDARD TITLE PAGE
1. Report No.
2. Government Accession No.
3. Recipient's Catalog No.
FHWA/IN/JTRP-2016/10
4. Title and Subtitle
Long-Term Pavement Performance Indicators for Failed Materials
5.
Report Date
April 2016
6. Performing Organization Code
7. Author(s)
Jaehyun Park, Chenxi Yuan, Hubo Cai
8. Performing Organization Report No.
FHWA/IN/JTRP-2016/10
9. Performing Organization Name and Address
Joint Transportation Research Program
Purdue University
550 Stadium Mall Drive
West Lafayette, IN 47907-2051
10. Work Unit No.
11. Contract or Grant No.
SPR-3805
12. Sponsoring Agency Name and Address
Indiana Department of Transportation
State Office Building
100 North Senate Avenue
Indianapolis, IN 46204
13. Type of Report and Period Covered
Final Report
14. Sponsoring Agency Code
15. Supplementary Notes
Prepared in cooperation with the Indiana Department of Transportation and Federal Highway Administration.
16. Abstract
State Transportation Agencies (STAs) use quality control/quality assurance (QC/QA) specifications to guide the testing and inspection of
road pavement construction. Although failed materials of pavement rarely occur in practice, it is critical to have a sound decision
framework to assist in making data-driven, informed decisions regarding failed materials because such decisions have profound impacts
on the long-term performance of the pavement and the operation and maintenance costs of the responsible highway agencies.
A performance-related specification (PRS) is a quality acceptance (QA) specification that specifies the acceptable levels of key acceptance
quality characteristics (AQCs) that are directly related to fundamental engineering properties, which in turn, determine the long-term
performance of the constructed end products. Two PRS tools, PaveSpec for Portland Cement Concrete Pavement (PCCP) and Quality
Related Specification Software (QRSS) for QC/QA Hot Mixed Asphalt (HMA) pavement, were investigated in this study to develop
decision frameworks for PCCP and HMA pavement to assist the decision-making regarding failed materials at INDOT. A large number of
simulations of various scenarios in the context of INDOT pavement construction were conducted to fully develop and implement the
decision framework.
For PCCP, the newly developed decision framework based on PaveSpec was validated using data from an INDOT construction project.
The framework is readily implementable to assist INDOT in making informed decision regarding failed materials for PCCP. For QC/QA
pavement, it was found that QRSS is not an appropriate PRS tool to estimate the long-term performance because of its limitations, the
misalignment between QRSS process and INDOT practice, and erroneous simulation results.
17. Key Words
Portland cement concrete pavement, hot mix asphalt pavement,
failed materials, decision framework, life-cycle cost, long-term
performance, PaveSpec, performance related specification, QRSS
18. Distribution Statement
No restrictions. This document is available to the public through the
National Technical Information Service, Springfield, VA 22161.
19. Security Classif. (of this report)
Unclassified
20. Security Classif. (of this page)
Unclassified
21. No. of Pages
141
EXECUTIVE
SUMMARY
LONG-TERM
PAVEMENT
PERFORMANCE
INDICATORS
FOR
FAILED
MATERIALS
INTRODUCTION
State Transportation Agencies (STAs) use quality control/ quality assurance (QC/QA) specifications to guide the testing and inspection of road pavement construction. Any pavement section that does not pass the testing is viewed as failed materials. Although failed materials rarely occur in practice, it is critical to have a sound decision framework to assist in making data-driven, informed decisions because such decisions have profound impacts on the long-term performance of pavement and the operation and maintenance costs of the responsible highway agencies.
At the Indiana Department of Transportation (INDOT), the Failed Materials Committee makes decisions regarding whether failed materials should be considered for ‘‘removal and replacement’’ or be ‘‘accepted with a heavy penalty.’’ The ‘‘removal and replacement’’ option, most of the time, is not popular because the pavement section has to be closed for a long period of time. However, choosing the ‘‘heavy penalty’’ option leaves INDOT with questions regarding the reliability of pavement performance. Uncertainty about long-term pavement performance creates a dilemma for INDOT, and therefore a procedure is needed for assessing performance based on the reliability of sub-standard pavement materials. This procedure should be based on the predicted performance difference, which in turn causes the life-cycle cost (LCC) difference between as-designed and as-constructed pavement, to assist the Committee to make data-driven decisions.
In this study a decision framework was created to assist INDOT in making decisions regarding pavement sections of failed materials. The framework is based on the long-term performance modules available from existing performance-related specification (PRS) tools. A PRS is a quality acceptance (QA) specification that speci-fies the acceptable levels of key acceptance quality characteristics (AQCs) that are directly related to fundamental engineering properties, which in turn determine the long-term performance of construction end products (e.g., pavement). Pavement PRS tools are capable of analyzing input AQCs to predict the lifetime per-formance and life-cycle cost of the pavement through computer simulations for both as-designed and as-constructed pavement. Using the decision framework, INDOT can compare the LCC of the as-designed pavement to the LCC of the as-constructed pavement to calculate the LCC difference at various confidence levels and compare the LCC difference to the contract price to decide which option (i.e., ‘‘removal and replacement’’ versus ‘‘acceptance with a heavy penalty’’) is more economic.
Two PRS tools, PaveSpec for Portland cement concrete pave-ment (PCCP) and Quality Related Specification Software (QRSS) for hot mixed asphalt (HMA) pavement, were explored in develop-ing the decision framework. A large number of simulations of various scenarios in the context of INDOT pavement construction were conducted to fully develop and implement the decision framework. The newly developed framework was tested and validated using design and construction data from an INDOT construction project.
FINDINGS
Valuable findings regarding the use of PRS tools to predict the long-term performance and to estimate the LCC of PCCP and HMA pavement as well as the interpretation of PRS analysis results to support decision-making regarding failed materials are summar-ized as follows.
Using
PaveSpec
to
Develop
the
Decision
Framework
for
Failed
Materials
of
PCCP
N
PaveSpec takes five AQCs for PCCP: concrete strength, slabthickness, air content, initial smoothness, and percent con-solidation around dowels (optional). The four mandatory AQCs are all being tested as stipulated in INDOT QA/QC specification for PCCP.
N
PaveSpec provides two levels of specification, Level 1 andLevel 2 Specification, to predict the long-term performance and to estimate the LCC for PCCP. The Level 2 Specifi-cation considers the correlation between AQCs. It is more reflective of the reality and therefore, Level 2 Specification is the level adopted in the newly developed decision frame-work. Simulation results show that LCCs estimated using the Level 2 Specification are lower than the LCCs estimated using the Level 1 Specification for the same PCCP pavement.
N
In PaveSpec, two approaches are available to estimatethe LCC of as-constructed PCCP—the interpolation and the re-simulation approach. The interpolation approach is the default one, which estimates the LCC of the as-constructed pavement by interpolating the pay factor table resulted from the simulations for the as-designed, based on individual AQCs. The re-simulation approach, a new approach created in this study, substitutes the target AQC values in the as-designed simulation with field-testing results of the AQCs and runs the simulation to estimate the LCC of the as-constructed pavement. The interpolation approach yields a single, deter-ministic estimate of the LCC for the as-constructed, but the re-simulation approach yields a set of predicted LCCs so that statistical analysis can be performed to calculate the confidence level for a given LCC and vice versa (e.g., 90th-percentile LCC and 95th-percentile LCC). Therefore, the re-simulation approach was adopted in the decision framework.
N
For the flexural strength AQC, PaveSpec requires the 28-daystrength, but could take the 7-day strength as an input if a curing curve is provided. INDOT tests 7-day strength only. Unfortunately, the curing curve depends on the mix formula, which varies from project to project. After an extensive literature review and consulting INDOT experts, a
multi-plication constant (C) was set at 1.23 to calculate the 28-day
strength from the 7-day strength (i.e., 28-day strength 5
7-day strength61.23).
N
The examination of INDOT specifications on the criteriaof failed materials revealed that a lot could contain both
acceptable and failed sublots. Two different methods, the
single lot method and the divide-estimate-sum method, were devised and their results were compared for various scenarios of the co-existence of both failed and acceptable
sublotsin a singlelot. The single lot method treats thelotthat
contains both acceptable and failed sublots as a singlelotin
PaveSpec. The divide-estimate-sum method separates the
sublot(s)only and the other contains failedsublot(s)only. Simulations are then performed for the new lots and results
are added to estimate the LCC for the original lot.
Simu-lation results show that estimated LCCs are quite different between these two methods. For the flexural strength AQC, the single lot method always yielded higher LCCs than the divide-estimate-sum method did. For the air content AQC, the single lot method always yielded lower LCCs than the divide-estimate-sum method did. These observations can be explained by looking at the sensitivity of LCC to the mean and the standard deviation. For the flexural strength AQC, the LCC is more sensitive to the consistency (indicated by the standard deviation). For the air content, the LCC is more sensitive to the average (indicated by the mean). Separating
acceptable and failed sublots into two newlotsleads to two
smaller standard deviations than the standard deviation of
the originallot and two new means, one is larger and the
other is smaller than the mean of the originallot. Based on
the comparisons, it is concluded that (1) for thelot level
failure, i.e., the lot average falls in the failed range, the single
lot approach is more appropriate, and (2) for thesublotlevel
failure, i.e., the lot average is acceptable, but thelotcontains
failed sublot(s), it reflects the reality better by separating
the originallot into two newlots, one contains acceptable
sublot(s)only and the other contains failedsublot(s)only. This conclusion was incorporated in developing the decision framework.
N
A large number of simulation scenarios of failed materialswere designed for a three-sublot lot. Simulations were per-formed to estimate the LCC of PCCP using the Level 2 Specification, the re-simulation approach, and the divide-estimate-sum method. Results show that for flexural strength and thickness AQCs, a trend exists: higher mean values (indi-cating better quality) and lower standard deviations (indi(indi-cating higher consistency) always lead to lower LCCs. While the same trend exists for the air content AQC, it is not appro-priate to use PaveSpec because a higher air content does not indicate a better quality.
N
Concerned with the air content AQC, additional simulationscenarios were designed to investigate the aggregate effect of multiple AQCs (focusing on air content) on the LCC. Results show that higher means of the air content AQC always yielded lower LCC estimates regardless of the varia-tions in other AQCs, such as concrete strength and thickness. It was concluded that PaveSpec is not an appropriate tool for estimating the as-constructed LCC if materials fail because of the air content AQC.
N
The LCC difference at various level of confidence can bestatistically calculated in such a way, in which (1) the simu-lated LCCs of the as-designed and the simusimu-lated LCCs of the as-constructed are two independent samples following the normal distribution, (2) the LCC differences are a derived sample that follows the normal distribution—its mean is the average of the means of the two samples in (1) and its standard deviation is the square root of the sum of the squares of the two standard deviations of the two samples in (1). Consequently, the LCC difference at any confidence level can be calculated following the calculation methods for normal distributions.
N
Aforementioned findings were incorporated into a newlydeveloped decision framework (see Figure 3.13) for failed materials of PCCP. It was validated using design and testing data from INDOT construction project (IR-30846).
Using QRSS to Develop the Decision Framework for
Failed Materials of QC/QA HMA Pavement
N
QRSS only estimates the service life by predicting thedis-tresses of rutting, fatigue cracking, and thermal cracking; and comparing them to pre-set threshold values. It does not have a mechanism to incorporate maintenance strategies and costs to estimate the LCC.
N
There is a misalignment between the AQCs specified inINDOT’s QC/QA HMA specification and the AQCs required in QRSS. Table 4.1 illustrates that (1) only two AQCs— binder content and roadway core density—are common to both INDOT specification and QRSS, (2) two AQCs— lab-compacted air voids, and voids in mineral aggregate (VMA)—are included in INDOT specification, but cannot be used directly in QRSS, and (3) gradation AQCs are required by QRSS, but are not included in INDOT specification.
N
Because of the misalignment, a pairing mechanism is neededin order to run QRSS simulations for INDOT QC/QA HMA pavement. Table 4.5 illustrates this pairing mechanism. A recommendation to INDOT would be to collect the AQCs that are required in QRSS in order to adopt QRSS in the decision framework.
N
A challenge in applying QRSS to INDOT QC/QA HMApavement is caused by the use of PWL as the criterion for failed materials in INDOT specification: many different scenarios could lead to the same PWL value.
N
QRSS estimates the long-term pavement performance interms of pavement distresses (i.e., rutting, fatigue cracking, and thermal cracking), predicts service life by comparing the distresses to their pre-set threshold values, and calculates the service life differences between designed and as-constructed pavements. However, QRSS simulations yielded abnormal results when predicting the service life difference between the as-designed and the as-constructed pavement based on fatigue cracking and thermal cracking. For the fatigue cracking, when the same set of values were used for both the as-designed and the as-constructed pavements, QRSS always predicted negative service life differences, i.e., the as-constructed pavement has a shorter service life than the as-built pavement. For the thermal cracking, QRSS always predicted there is no service life difference between the as-designed and the as-constructed even though their AQC values were different, but all in normal ranges. Fur-thermore, when either the as-constructed has extremely high AQC values or extremely low AQC values, QRSS predicted that the service life difference is over 50 years. Since QRSS yields abnormal results when considering thermal cracking and fatigue cracking, it is not appropriate to use both of them as the base for estimating the shortened service life attributable to failed materials.
N
The current version of QRSS executes Monte Carlosimu-lations to predict service life differences based on pavement performance estimates. In the results, QRSS provides means of the service life differences; however, it does not provide standard deviations of the service life differences directly. Therefore, to predict the service life difference at a user-specified confidence/probability (e.g., 90th-percentile or 95th-percentile service life difference), a statistical approach was devised to calculate the standard deviation based on individual pairs of the service life of designed and as-constructed.
N
A large number of simulation scenarios for the only two common AQCs in QRSS and INDOT specification—binder content and roadway core density—were crafted in lieu of afive-sublotlot. The simulation results showed that the service
life is insensitive to the standard deviation, but it is closely correlated with the mean—a higher mean in either binder content or roadway core density leads to a longer service life. The trend, in turn, lead to erroneous results when applying the PWL concept. Because any value that is too high or too low is outside the limit, for a given PWL value, if the original set is leaning towards the higher end, the predicted service life is longer; if the original set is leaning towards the higher end, the predicted service life is shorter. As the result, QRSS estimated that for certain groups of failed materials, the service life of the as-constructed is longer than the service life of as-designed.
N
Given the misalignment between INDOT AQCs and theAQCs required in QRSS, the limitations in QRSS, and the erroneous results from the QRSS simulations, QRSS is not being recommended as the PRS tool to be used for QC/QA HMA pavement at this moment.
IMPLEMENTATION
The findings from this study were used to develop the decision framework for failed materials of PCCP. This framework enables the calculation of the difference between the LCC of as-designed
and the LCC of as-constructed pavement at a user-specified confidence level and the comparison of the LCC difference to the construction contract price to determine whether the ‘‘removal and replacement’’ or the ‘‘acceptance with a heavy penalty’’ option is more economically appropriate. The framework also helps to determine the appropriate monetary amount if the ‘‘acceptance with a heavy penalty’’ option is chosen. The framework was vali-dated using the design and construction data of an INDOT high-way construction project. This framework can be immediately implemented to assist INDOT in making informed decisions regarding failed PCCP materials while waiting for findings of the use of MEPDG on PCCP. Given the availability of the software tool and the matching AQCs, the implementation cost is minimal. However, training on the use of PaveSpec is critical to the success of implementation.
For QC/QA HMA pavement, while the concept on comparing the long-term performance between as-designed and as-constructed pavement is still valid, QRSS is not an appropriate PRS tool to estimate the long-term performance because of its limitations and the misalignment between QRSS process and INDOT practice. Further study is needed to find an appropriate PRS tool, which could be a modified version of QRSS or a different tool such as Mechanistic-Empirical Pavement Design Guide (MEPDG). An opportunity for immediate implementation is the set of AQCs: it is recommended that INDOT aligns its AQCs with the AQCs required in QRSS, which have been found to have significant effect on the long-term pavement performance.
CONTENTS
1. INTRODUCTION . . . 1
1.1 Background . . . 1
1.2 Problem Statement . . . 1
1.3 Overall Objectives. . . 1
1.4 Work Plan. . . 1
2. LITERATURE REVIEW . . . 2
2.1 INDOT Definition of Failed Materials. . . 2
2.2 Long-Term Performance and LCC Estimation of PCCP . . . 4
2.3 Estimating Long-Term Performance for HMA Pavement. . . 5
3. AN LCC BASED DECISION FRAMEWORK FOR FAILED PCCP MATERIALS . . . 6
3.1 Distresses and Required AQCs in PaveSpec . . . 6
3.2 Input Variables . . . 6
3.3 Analytical Process of PaveSpec . . . 7
3.4 Estimating the LCC of As-Constructed PCCP: The Interpolation Approach versus the
Re-Simulation Approach. . . .
11
3.5 Level 1 Specification versus Level 2 Specification . . . .
11
3.6 Selecting the Approach and the Level of Specification . . . .
11
3.7 LCC Trend and Sensitivity Analysis Via Simulations. . . .
13
3.8 Simulation Results of Various AQC Failure Scenarios . . . .
14
3.9 LCC Estimation for
Lots
with Both Failed and Acceptable
Sublots
. . . .
15
3.10 The Calculation of LCC Difference at User-Specified Confidence Levels . . . .
15
3.11 The Decision Frameweork for Failed PCCP Materials . . . .
17
4. USE OF QRSS FOR QC/QA HMA PAVEMENT OF FAILED MATERAILS . . . .
20
4.1 Distresses and Service Life Prediction. . . .
20
4.2 Input Variables . . . .
20
4.3 Analytical Process of QRSS . . . .
20
4.4 Service Life Difference with Probabilities . . . .
21
4.5 Challenge 1: Aligning INDOT AQCS to QRSS AQCS . . . .
23
4.6 Challenge 2: Abnormal Results for Failed Materials . . . .
23
4.7 Challenge 3: Uncertainties Introduced by PWL . . . .
24
4.8 Recommendations Regarding the Use of QRSS for QC/QA HMA . . . .
26
5. CASE ILLUSTRATION OF THE DECISION FRAMEWORK FOR PCCP . . . .
32
5.1 Case Overview . . . .
32
5.2 The Application of the Decision Framework. . . .
32
6. SUMMARY AND RECOMMENDATIONS . . . .
33
6.1 Summary and Recommendations . . . .
33
6.2 Key Findings . . . .
33
6.3 Recommendations for Implementation . . . .
35
6.4 Deliverables . . . .
36
REFERENCES . . . .
36
APPENDICES
Appendix A. Pavespec Input Data for Studying . . . .
37
Appendix B. Composite Effects of Multiple AQCs Analysis Results . . . .
42
Appendix C. QRSS Input Data for Studying . . . .
113
Appendix D. Relationships between Service Life Differences and PWLs of Binder Content Analysis Results . .
118
Appendix E. Relationships between Service Life Differences and PWLs of Roadway Core Density
Analysis Results . . . .
124
LIST OF TABLES
Table Page
Table 2.1Criteria of acceptance and failed materials for PCCP 2
Table 2.2Lot based criteria of acceptance and failed materials for HMA pavement 3
Table 2.3Pay adjustment and failure criterion based on PWL for QC/QA HMA pavement$1lot 4
Table 2.4Sublot based criteria of acceptance and failed materials for HMA pavement 4
Table 3.1AQCs and related distress indicators 6
Table 3.2Input categories in PaveSpec 6
Table 3.3Related inputs for each step in Figure 3.1 7
Table 3.4Current INDOT sampling and testing method 8
Table 3.5Comparison of LCC results of the interpolation and the re-simulation approaches (Level 1 Specification) 12
Table 3.6Comparison of LCC results of the interpolation and the re-simulation approaches (Level 2 Specification) 13
Table 3.7LCC results comparisons of Level 1 Specification and Level 2 Specification 13
Table 3.8Scenarios for selecting approach and level of specification 14
Table 3.9Comparisons between the interpolation and re-simulation approaches 14
Table 3.10Comparisons between the Level 1 Specification and Level 2 Specification 15
Table 4.1QRSS inputs required for analysis 21
Table 4.2Related inputs for each step 22
Table 4.3Simulation outputs 24
Table 4.4AQCs for INDOT QC/QA HMA and QRSS 25
Table 4.5Pairing results of the AQCs for INDOT QC/QA HMA and QRSS 25
Table 4.6Generated samples and estimated service life differences per binder content 27
Table 4.7Generated samples and estimated service life differences per roadway core density 27
Table 5.1Design AQC values (from INDOT Project IR-30846) 32
Table 5.2Acceptance testing results (lot7, INDOT project IR-30846) 33
Table 5.3LCCs estimated in PaveSpec 33
LIST OF FIGURES
Figure Page
Figure 2.1The lot and sublot concept of surface HMA pavement in INDOT 3
Figure 2.2The typical PRS analysis procedure of PCCP 4
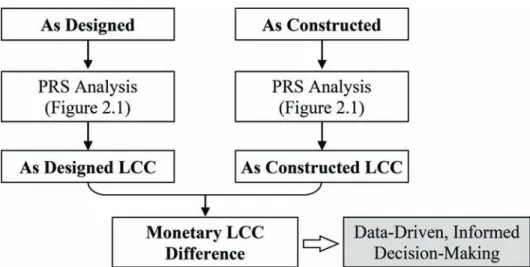
Figure 2.3LCC comparison method between as-designed LCC and as-constructed LCC 5
Figure 2.4The PRS analysis procedure of QRSS for HMA pavement 6
Figure 3.1PaveSpec workflow 7
Figure 3.2Definition of pavement performance 8
Figure 3.3Current INDOT sampling method 9
Figure 3.4AQC as-designed target value definition 9
Figure 3.5Preconstruction outputs 10
Figure 3.6PaveSpec use specification execution results 10
Figure 3.7LCC results comparisons of the interpolation and the re-simulation methods 12
Figure 3.8LCC results comparisons of Level 1 Specification and Level 2 Specification 13
Figure 3.9Trend analysis results 16
Figure 3.10The dilemma caused by air content 17
Figure 3.11Composite effects of multiple AQCs analysis results 18
Figure 3.12Comparison of two different methods in estimating the LCC of a lot that contains both acceptable and failed sublots
(flexural strength) 19
Figure 3.13Illustration of the decision framework for PCCP of failed materials 20
Figure 4.1QRSS workflow 21
Figure 4.2Monte Carlo simulation of the as-designed mix 22
Figure 4.3QRSS analysis outputs 23
Figure 4.4Simulation procedure for each scenario 26
Figure 4.5Trend analysis results 28
Figure 4.6An illustration of two different samples with the same PWL value 28
Figure 4.7Relationship between the service life difference and the PWL of binder content 29
Figure 4.8Relationship between service life differences and PWL per roadway core density 30
Figure 4.9The relationships between service life differences and the means and standard deviations 31
1. INTRODUCTION
1.1 Background
State Transportation Agencies (STAs) follow quality
control/quality assurance (QC/QA) specifications to inspect
and test road pavements in construction. Any pavement
that does not pass the testing is viewed as failed materials
of pavement. Although failed materials of pavement
rarely occur in practice, it is critical to have a sound
decision framework to assist in making informed
deci-sions regarding failed materials because such decideci-sions
have profound impacts on the long-term performance
of the pavement and the operation and maintenance
costs of the responsible highway agencies.
At the Indiana Department of Transportation (INDOT),
the Failed Materials Committee makes decisions
regard-ing failed materials: should the failed materials be
‘‘removed and replaced’’ or be ‘‘accepted with a heavy
penalty.’’ The ‘‘remove and replace’’ option, most of
the time, is not a popular option since the pavement
section has to be closed for a long period of time.
However, selecting a ‘‘heavy penalty’’ option leaves the
INDOT Failed Material Committee with a question on
the reliability in the performance of the failed material
pavement section. Uncertainty in long-term pavement
performance created a dilemma for the Committee. There
is a need to have a procedure on how to assess long-term
pavement performance based on reliability of the
sub-standard pavement materials. Such a procedure should be
based on the predicted performance difference, which in
turn, causes the life-cycle cost (LCC) difference between
as-designed and as-constructed pavement, to make real
data driven decisions by the Committee.
Computing tools from Performance-Related
Specifica-tion (PRS) are capable of predicting the long-term
per-formance of the pavement and the LCCs of as-designed
and of as-constructed pavement. PRS are quality
acceptance (QA) specifications emerged in recent years.
They specify the desired levels of key acceptance quality
characteristics (AQCs) that have been bound to be
cor-related with fundamental engineering properties that
can predict the long-term performance of the pavement.
Based on this correlation, PRS tools are available to
estimate the LCC for both as-designed and as-constructed
pavement, using AQCs as inputs. A few state highway
agencies (SHAs) have already adopted this PRS approach
in their specifications to determine the pay factor
(a percentage of the contract price) of as-constructed
pavement based on the comparison between the LCC
of the as-designed and the LCC of the as-constructed
pavement (Evans, Darter, & Egan, 2005; Evans, Smith,
Gharaibeh, & Darter, 2008; Rao, Smith, & Darter, 2007).
To address the challenge regarding failed materials
INDOT is facing, INDOT initiated research (this research
project) to develop a decision framework to assist in
dealing with failed materials from the life-cycle
perfor-mance perspective, based on the difference between the
LCC of the as-designed and the LCC of the as-constructed
pavement. The newly developed framework incorporates
LCC estimation modules from existing PRS tools—
PaveSpec for Portland cement concrete pavement (PCCP)
and QRSS for Hot mixed asphalt (HMA) pavement.
It also incorporates risk analysis to allow INDOT to
make decisions according to its risk mitigation
strat-egies. A large number of simulations were conducted to
develop the framework. The resulting framework was
tested and validated using data from an INDOT’s
highway construction project.
1.2 Problem Statement
Two options are considered by INDOT to deal with
pavement segments that contain failed materials: ‘‘removal
and replacement’’ and ‘‘acceptance with a heavy penalty.’’
The ‘‘removal and replacement’’ option, most of the time,
is not a popular one because the concerned pavement
section has to be closed for a long period of time.
How-ever, choosing the ‘‘acceptance with a heavy penalty’’
option leaves INDOT with a question on the reliability
in terms of the long-term performance of the pavement
and the financial impact, e.g., excessive maintenance
cost and elevated user cost due to its inferior
perfor-mance and shortened service life. There is a need to
establish a procedure to guide INDOT on
decision-making regarding failed materials based on the reliability
of the sub-standard pavement materials. Such a
proce-dure should be based on the predicted performance
difference and LCC difference between as-designed
and as-constructed pavement.
1.3 Overall Objectives
The objective of this study is to (1) determine the
monetary impact from the long-term pavement
perfor-mance of sub-standard/failed materials; and (2) create a
mechanism for INDOT to make data-driven, informed
decision-making regarding failed pavement materials.
The work scope includes both PCCP and QC/QA HMA
pavement (dense grade mixes only).
Two main deliverables are: (1) an analysis procedure
that leverages INDOT QA process and key acceptance
quality characteristics (AQCs), and PRS tools (i.e.,
Pave-Spec for PCCP pavement and Quality Related Pave-
Specifi-cation Software (QRSS) for HMA pavement) to determine
both short- and long-term performance, and monetary
difference between ‘‘as-designed’’ and ‘‘as-constructed’’
pavement sections of failed materials; and (2) a
guide-line on using the aforementioned analysis procedure
and interpreting results in a reliability-based manner –
a tool for data-driven, informed decision-making
regard-ing failed materials in both pavement types.
1.4 Work Plan
The research project consists of the following four tasks
for monetarily assessing the long-term risks of inferior
pavement performance because of failed materials.
N
Task 1:Literature review: PRS, DOT QC/QA, and riskN
Task 2: PRS based pavement performance analysis offailed materials
N
Task 3: Risk analysis of long-term pavementperfor-mance of failed materials
N
Task 4:Validation of proposed decision framework2. LITERATURE REVIEW
2.1 INDOT Definition of Failed Materials
Failed materials lead to inferior performance that in
turn, lead to excessive maintenance, repair, and
rehabil-itation costs, and shortened service life. INDOT defines
failed materials of PCCP and QC/QA HMA pavement
in its standard specification based on AQCs.
2.1.1 Failed Materials of Portland Cement Concrete
Pavement (PCCP)
For PCCP, INDOT uses four AQCs—flexural
strength, air content, thickness, and smoothness—to
define the criteria for failed materials (INDOT, 2013).
Table 2.1 summarizes these criteria. For the air content
AQC, the failure criteria are defined on both the average
and the range of the measures. The failure criteria for
the flexural strength and the air content are defined at
both levels of lot and sublot. The failure criteria for the
air content range are at the lot level. The failure criteria
for the thickness are defined only at the sublot level.
While there is a failure criterion defined for the
smooth-ness AQC, if the smoothsmooth-ness is greater than or equal to
3.8 inch/0.1 mile, it must be corrected; the pavement is
not allowed to fail because of its smoothness.
2.1.2 Failed Materials of QC/QA Hot Mix Asphalt
(HMA) Pavement
The criteria of failure for QC/QA HMA pavement
are different for pavement that is greater than or equal
to 1 lot and pavement that is less than 1 lot. In the
INDOT specification on the quality assurance
proce-dures for QC/QA HMA, a lot is defined as of 5,000 tons
of the base or intermediate layer of HMA pavement
and as of 3,000 tons of the surface layer of HMA
pave-ment. A lot is then divided into 5 sublots that are of
equal tons; a sublot for the base and intermediate layer
of HMA pavement is 1,000 tons and a sublot for the
surface layer of HMA pavement is 600 tons.
In the practice, most pavement sections are not the
exact multiplications of either 5,000 or 3,000 tons;
there-fore, the remaining part, though it is smaller than 5.000
or 3,000 tons depending on which layer is considered,
becomes a (‘‘partial’’) standalone lot. While it is
straight-forward to divide a ‘‘standard’’ lot into five equal-weight
sublots, dividing a ‘‘partial’’ lot into sublots is different:
a ‘‘partial’’ standalone lot is divided into as many
sublots at the same size of the sublots in a ‘‘standard’’
lot; for any portion that remains, if it is no more than
100 tons, it is added to the proceeding sublot, otherwise,
it is considered as a new sublot (INDOT, 2013). Figure 2.1
illustrates the definition of lot and sublot based on the
surface layer of HMA pavement in INDOT with three
examples. Lot 1 is a ‘‘standard’’ lot. It has a total of
3,000 tons of surface layer of an HMA pavement and is
divided into five equivalent sublots, each at 600 tons.
The failure criteria for a standard lot are described in
INDOT specifications 401.19(a) and explained in
section 2.1.2.1. Lot 2 is a ‘‘partial’’ lot. It is composed
of two sublots, one at 600 tons (the standard size) and
the other at 200 tons. Lot 3 is another ‘‘partial’’ lot. It is
composed of two sublots, one at 600 tons and the other
at 690 tons. The second sublot is larger than 600 tons
and the extra 90 tons come from the remaining portion
that is too small (
,
100 tons) to become a sublot. The
failure criteria for partial lots are described in INDOT
specifications 401.19(b), and explained in section 2.1.2.2.
2.1.2.1 Failure Criteria for QC/QA Pavement
$
1 Lot
.
For QC/QA HMA pavement that is greater than or
equal to 1 lot, INDOT applies the concept of statistical
quality control for the acceptance and pay adjustment
of QC/QA HMA pavement at the lot level. Specifically,
the Percent Within Limits (PWL) approach is used for
QC/QA HMA pavement (INDOT, 2013; Scott, Konrath,
& Ferragut, 2014). This PWL approach assumes that the
TABLE 2.1
Criteria of acceptance and failed materials for PCCP.
AQC Measures
Acceptable Range Failure Criteria
Full Pay Discount Pay Lot Average Sublot
Flexural Strength $570 psi [515, 570] psi #514 psi ,500 psi
Air Content [5.7, 8.9]% [9.0, 9.8]%and [5.3, 5.6]% ,5.3%and.9.8% ,5.0%and.10.0%
Air Content Range [0.0, 2.5]% [2.6, 3.5]% .3.5% N/A*
Thickness: (Average core depth, or ACD) – (Design depth, or DD)
¡0.2 inch [-1.0, -0.2] inch N/A ,-1.00 inch
Smoothness: 0.0-inch blanking band Profile Index (PI0.0)
.0.00 in./0.1 mi. and ,3.60 in./0.1 mi.
[3.60, 3.80] in./0.1 mi. $3.8 in./0.1 mi. (must be
corrected to less than 3.80 in./0.1 mi.)
N/A
testing results follow a normal statistical distribution and
can calculate the percentage of the testing results that fall
within any given range (Sholar, Page, Musselman, Upshaw,
& Moseley, 2003). Table 2.2 lists the acceptable ranges
for the four AQCs: binder content, air voids at N
des, air
voids in mineral aggregate at N
des, and roadway core
density. Table 2.3 illustrates how the payment is adjusted
according to the calculated PWL value. For any AQC,
if the calculated PWL is less than 50(
%
), then the lot is
considered to be failed. In addition to the PWL
calcu-lated at the lot level, INDOT defines that a lot is also
considered failed materials if one of its sublots has
an air void content that is less than 1.0
%
or greater
than 7.0
%
.
2.1.2.2 Failure Criteria for QC/QA Pavement
,
1 Lot
.
For QC/QA HMA pavement that is less than 1 lot,
while the same set of AQCs is used, the pay adjustment
Figure 2.1 The lot and sublot concept of surface HMA pavement in INDOT. TABLE 2.2
Lot based criteria of acceptance and failed materials for HMA pavement.
AQC Lower Specification Limit Upper Specification Limit
Material Binder Content,% - 0.40%from Job Mix Formula (JMF) +0.40%from JMF
Air Voids at Ndes,% 2.60% 5.40%
Voids In Mineral
Aggregate at Ndes,%
Greater of -0.50%from
Spec and -1.20%from JMF
Lesser of 2.00%from
Spec and 1.20%from JMF
Construction Roadway Core Density
(%Gmm),%
and the failure criteria are both set at the sublot level.
Table 2.4 summarizes the ranges for full pay, discount
pay, and failure criteria at the sublot level for QC/QA
HMA pavement (dense graded) that is less than 1
lot
.
All percentages refer to the deviation from JMF.
2.2 Long-Term Performance and LCC Estimation of
PCCP
The long-term performance of PCCP pavement that
involves failed materials is the key to making informed
decision. PRS, a quality acceptance (QA) specification,
describes the desired levels of key acceptance quality
characteristics (AQCs) that are correlated with
funda-mental engineering properties that predict performance.
It is capable of estimating the LCC of PCCP, as
illus-trated in Figure 2.2. In a PRS analysis. AQCs, traffic,
and climate variables serve as inputs to the
performance-prediction model to predict structural and functional
performance of pavement. Resulting performance
predic-tion, together with maintenance and repair/rehabilitation
strategies, serves as input to the maintenance-cost model
to predict the life-cycle cost. The predicted LCC excludes
the initial construction cost.
To facilitate the computation, PRS tools have been
developed based on the correlation between AQCs and
the long-term performance to estimate the LCC of
pave-ment through computer simulations (Office of Asset
Management, 2001). ERES Consultants, through a federal
highway administration (FHWA)-funded project, created
PaveSpec—a PRS tool for PCCP—in 1993 (Graveen
et al., 2009). The working procedure of PaveSpec follows
TABLE 2.3
Pay adjustment and failure criterion based on PWL for QC/QA HMA pavement$1lot.
PWL (%) Pay Adjustment
.90 Pay factor5(105.00 – 0.506(100.00 – PWL))/100
$50 and#90 Pay factor5(100.00 – 0.0000200726(100.00 – PWL)3.5877)/100
,50 Failed materials, subject to the Failed Materials Committee
TABLE 2.4
Sublot based criteria of acceptance and failed materials for HMA pavement.
AQC
Acceptable Range
Failure Criteria Full Pay Discount Pay
Material
Binder Content,% #0.5%from JMF [0.5, 1.0]%from JMF .1.0%from JMF
Air Voids at Ndes,% #0.5%from JMF [0.5, 2.0]%from JMF .2.0%from JMF
Voids In Mineral
Aggregate at Ndes,%
#0.5%from JMF [0.5, 2.5]%from JMF .2.5%from JMF
Construction Roadway Core
Density (%Gmm),% [92.0, 97.0]%from JMF [88.9, 92.0]%from JMF #88.9%or$97.0%from JMF
the general PRS analysis procedure and adopts the
life-cycle cost simulation to quantitatively evaluate the
per-formance of PCCP.
By relying on the capability of PRS in estimating the
long-term performance and predicting the life-cycle cost
of PCCP, the monetary impact from failed materials
can be quantified as the life-cycle cost difference between
the as-designed and as-constructed pavements. Figure 2.3
illustrates the process to determine the life-cycle cost
dif-ference. This information (i.e., the LCC difference) can
assist SHAs in determining which option, i.e., ‘‘removal
and replacement’’ or ‘‘acceptance with a heavy
pen-alty,’’ is more beneficial; and what is the appropriate/
fair monetary amount of the ‘‘penalty’’ to be assigned
to the ‘‘acceptance with a heavy penalty’’ option.
A number of studies have been conducted to specify
the acceptance of pavement through the use of PRS.
Evans et al. (2005) developed and implemented a trial
PRS for concrete pavement construction in Tennessee.
They concluded that PRS is a viable approach to set up
incentives for contractors to work harder and perform
better. Rao et al. (2007) developed a PRS for concrete
pavement construction in Wisconsin. The PRS defined
the requirements for four AQCs, thickness, concrete
strength, air content, and smoothness; and designed pay
factors correspondingly. Evans et al. (2008) developed,
implemented, and evaluated a PRS for a construction
project in Florida based on three AQCs, thickness,
strength, and smoothness. Graveen et al. (2009)
devel-oped a PRS for INDOT and validated it using a
previously completed construction project. These studies
have demonstrated in common that the use of PRS leads
to a win-win situation: contractors received higher pay
for delivering higher quality pavement and SHAs saved
in the long-term by receiving higher quality pavement
with lower maintenance costs, better pavement
perfor-mance, and increased service life.
2.3 Estimating Long-Term Performance for HMA
Pavement
PRS for HMA pavement has been developed to describe
acceptable levels of AQCs that correlate with the
long-term performance in aspects of permanent deformation
(e.g., rutting), fatigue cracking, and thermal cracking
(Scott et al., 2014). Similar to the PRS for PCCP, the
PRS for HMA pavement is capable of estimating its
long-term performance. Different from the PRS for
PCCP, the PRS for HMA pavement does not quantify
the long-term performance into LCC. Rather, by
set-ting the threshold values for the three distresses (i.e.,
rutting, fatigue cracking, and thermal cracking), the
long-term performance is quantified into service life.
Figure 2.4 illustrates the PRS analysis process for HMA
pavement. The associated computational tool/software is
QRSS.
The comparison approach (see Figure 2.3) developed
for PCCP can still be used to support the
decision-making regarding failed materials of HMA pavement.
The difference is that the base for the decision is no
longer the LCC difference, but the service life difference
instead.
A number of studies have been conducted to develop
PRS for HMA pavement and to estimate the long-term
performance of HMA pavement using PRS tools.
Mensching, McCarthy, Mehta, & Byrne (2013) developed
a PRS-based framework to set post-construction targets
for rutting performance in HMA pavement overlay
pro-jects in the state of Rhode Island. De Jarnette, McCarthy,
Bennert, & Guercio (2013) analyzed current PRS
pro-grams and recommended to assign pay factor adjustments
for HMA pavement based on performance measures.
McCarthy, Guercio, Bennert, & De Jarnette (2014)
com-pared performance prediction results of several PRS tools
and found that the results are quite consistent.
3. AN LCC BASED DECISION FRAMEWORK FOR
FAILED PCCP MATERIALS
In this study, PaveSpec was investigated as the PRS
tool to predict the long-term performance of PCCP
that involves failed materials, and a decision framework
was developed based on the findings from a large
num-ber of simulations. The descriptions regarding PaveSpec
in this Chapter are all for the current version of
PaveSpec, version 3.0. At the time of this writing, a
newer version, version 4.0, is under development (Scott
et al., 2014).
3.1 Distresses and Required AQCS in PaveSpec
The current version of PaveSpec, version 3.0, relies
on four types of distress indicators—transverse joint
fault-ing, transverse joint spallfault-ing, transverse slab crackfault-ing,
and decreasing smoothness—to estimate LCCs for PCCP.
These distress are predicted based on five AQCs:
concrete strength, slab thickness, air content, initial
smoothness, and percent consolidation around dowels,
as shown in Table 3.1. Among them, percent
con-solidation around dowels is optional while the other
four AQCs are required.
3.2 Input Variables
PaveSpec requires 163 inputs that can be divided into
ten categories, as shown in Table 3.2. Appendix A lists
Figure 2.4 The PRS analysis procedure of QRSS for HMA pavement. TABLE 3.1
AQCs and related distress indicators.
AQC Related Distress Indicators Type
Concrete Strength Transverse Joint Spalling, Transverse Slab Cracking Required
Slab Thickness Transverse Joint Faulting Required
Air Content Transverse Joint Spalling Required
Initial Smoothness Decreasing Smoothness Required
Percent Consolidation Around Dowels Transverse Joint Faulting Optional
TABLE 3.2
Input categories in PaveSpec.
Category Numbers of Inputs
Basic Specification and Dimensions and
Lane Data 10 inputs
Traffic Data 9 inputs
Pavement Design Data 14 inputs
Climatic Data 5 inputs
Maintenance and Rehabilitation Data 28 inputs
Unit Cost Data 17 inputs
Simulation Control 35 inputs
Definition of Pavement Performance 2 inputs
AQC Sampling and Testing 27 inputs
all 163 input variables, their ranges, and sample values
(from INDOT project R-25715, a section of I-65 in
Clarksville, Indiana). Many of the sample values were
used later in the simulations in this study.
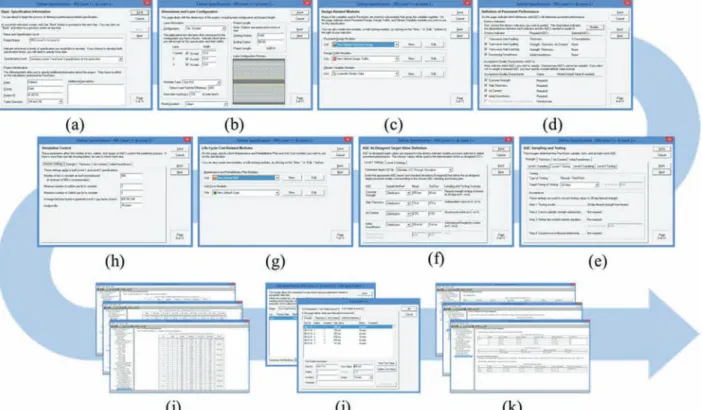
3.3 Analytical Process of PaveSpec
Figure 3.1 illustrates how PaveSpec was executed to
take inputs, conduct simulations, and report results.
The whole process consists of eleven steps. Table 3.3
lists inputs (as listed in Appendix A) that are relevant in
each step.
PaveSpec has two levels of specification, Level 1
and Level 2. The major difference is that a Level 2
Specification incorporates the interactions of/correlation
between AQCs while a Level 1 Specification does not
(Hoerner & Darter, 1999). The user chooses either
Level 1 or Level 2 Specification in step (a).
Figure 3.2 illustrates the selection of distress
indica-tors in step (d) in this study. The distress indicator of
transverse joint faulting is not checked because it requires
the optional AQC—
%
Consolidation, which is not
considered in this study. Based on the selection of the
distress indicators, four required AQCs (i.e., concrete
strength, slab thickness, air content, initial
smooth-ness, and percent consolidation around dowels) are
included.
AQC sampling and testing information is input into
PaveSpec at step (e). Table 3.4 illustrates the current
sampling and testing methods used by INDOT in its
QA/QC program for PCCP. Figure 3.3 graphically
illustrates the sampling method, using a
lot
that
con-tains three
sublots
as an example. Note that once the
random sample is identified, the tests for air content
and flexural strength are performed on the same sample.
Air content tests have to be done from a sample obtained
on the grade. Beam specimens can be cast from the on
grade sample, but they can also be obtained from a
truck sample obtained at the point prior to delivery to
Figure 3.1 PaveSpec workflow: (a) basic specification information; (b) dimensions and lane configuration; (c) design-related modules; (d) definition of pavement performance; (e) AQC sampling and testing; (f) AQC as-designed target value definition; (g) life-cycle cost-related modules; (h) simulation control; (i) results—pay factor matrices and LCCs (as-designed); (j) as-constructed AQCs; (k) overall pay factor and LCC (as-constructed).
TABLE 3.3
Related inputs for each step in Figure 3.1.
Step
Related Inputs in Appendix A
(a) Basic Specification Information #1 –#2
(b) Dimensions and Lane Configuration #3 –#10
(c) Design-Related Modules #11 –#38
(d) Definition of Pavement Performance #39 –#40
(e) AQC Sampling and Testing #41 –#64
(f) AQC As-Designed Target Value
Definition #65 –#80
(g) Life-Cycle Cost-Related Modules #81 –#129
the grade, where the sample will be obtained for air
content.
Figure 3.4 illustrates the inputs of target values for AQCs
in step (f). PaveSpec allows ways to estimate the LCC for
as-designed: ‘‘through simulation’’ and ‘‘using AQC means
only.’’ The default method, ‘‘through simulation,’’ generates
random numbers, which follow a normal distribution,
to predict AQCs and run Monte Carlo simulations. The
‘‘using AQC means only’’ method estimates LCC in a
deterministic manner. Considering that a pavement section
is never homogeneous and AQCs are only obtained
at sample locations, the ‘‘through simulation’’ method
incorporates the randomness of AQCs and therefore,
reflects the reality more accurately (Graveen et al., 2009).
In this study, the default ‘‘through simulation’’ method
was used to incorporate the inhomogeneity in AQCs.
The user sets simulation control in step (h). The
simu-lation control inputs are divided into two major sections:
generic settings and AQC-specific settings. In
particu-lar, AQC settings directly affect the range and level of
detail in the generated pay factor matrices.
In step (i), PaveSpec reports summary simulation
results. If Level 1 Specification is used, the results
include (1) predicted distresses for every sublot, (2) pay
factor matrices for individual AQCs based on their mean
and standard deviation values, and (3) LCCs (present
worth) for every sublot and lot. If Level 2 Specification
is used, the results do not include pay factor matrices,
but the other two items are included. Figure 3.5
illus-trates four example outputs, the first three are from
Level 1 Specification and the fourth is from Level 2
Specification.
Figure 3.2 Definition of pavement performance. TABLE 3.4
Current INDOT sampling and testing method.
AQC Value Sampling Method Sampling Frequency
Sampling
Locations Testing Method Precision
Strength Beams Two beams per sublot* 1 AASHTO T 97 1 psi
Air Content Air Pressure Meter One per sublot 1 AASHO T 152 or
ASTM C 173
0.1%
Thickness Cores Two cores per sublot 2 ITM 404 0.1 in
Smoothness Profile Index (0.0-in blanking band) 1 pass per lane N/A** ITM 912 in./0.1 mi.
*Two beams in one location. **Not applicable.
In step (j), field-testing results of AQCs are input into
PaveSpec as as-constructed AQCs. If Level 1
Specifica-tion is chosen, interpolaSpecifica-tions are performed by
referen-cing to those individual pay factor matrices, resulting in
pay factors and as-constructed LCCs based on individual
AQCs. The individual pay factors are then averaged
(a weighted average) to estimate the overall pay factor.
The as-constructed LCC can then be calculated by using
the as-designed LCC, the overall pay factor, and the
con-struction contract price. If Level 2 Specification is used,
PaveSpec incorporates all AQCs and their interactions to
report the LCC for the as-constructed. Results are reported
in step (k). Figure 3.6 illustrates two sample results from
Level 1 Specification and Level 2 Specification.
3.3.1 Interpolation Method between 7-day and 28-day
Concrete Strength
For the flexural strength AQC, PaveSpec requires
28-day strength, but accepts 7-day strength with a curing
Figure 3.3 Current INDOT sampling method.
curve to allow the estimation of the 28-day strength
from the 7-day strength (Evans et al., 2005; Evans et al.,
2008; Rao, Smith, & Darter, 2007). In the current
practice, INDOT tests 7-day strength and, based on
this 7-day strength, determines the pay factor for pay
adjustment.
To use PaveSpec for INDOT projects, a conversion
mechanism is needed to convert the 7-day strength to
the 28-day strength. A previous JTRP study (Graveen
et al., 2009) suggested the use of a conversion coefficient,
C, to convert between the 7-day and 28-day strength.
Equation (3.1) illustrates how this coefficient
C
can be
determined and used.
C
~
f
28{Dayf
7{Dayð
3:1
Þ
This coefficient method is straightforward and easy
to use without sacrificing the accuracy; therefore, it was
used in this study to convert 7-day strength into 28-day
strength. INDOT considers 570 psi at 7-day concrete
strength as the threshold value for a full pay, expecting
it to reach 700 psi at 28-day. Thus, the strength
Figure 3.5 Preconstruction outputs: (a) Level 1 distress chart; (b) Level 1 pay factor matrix; (c) Level 1 LCC results; (d) Level 2 distress chart; (e) Level 2 LCC results.
multiplication constant
C
is calculated to be 1.23, which
was used in all simulations for PCCP.
Note that the coefficient might be determined in a
much more accurate way by slightly modifying the
cur-rent practice in sampling and testing. For instance, both
the 7-day and 28-day flexural strength at the time of the
trial batch can be measured to determine coefficient C
for the specific mix design. Or, ores from broken beam
halves or actual pavement areas in questions could
be obtained very close to the 28-day age and tested
for split tensile strength (to be converted to a 28-day
flexural strength).
3.4 Estimating the LCC of As-Constructed PCCP: The
Interpolation Approach versus the Re-Simulation
Approach
The default approach in PaveSpec to estimate the
LCC of the as-constructed is an interpolation approach.
The execution of PaveSpec simulations yields an LCC
pay factor matrix for each AQC based on its mean and
standard deviation. The LCC of as-constructed PCCP
can be estimated by using the field-testing values (the
means and standard deviations of AQCs) to interpolate
the matrix. Resulting LCC estimates based on
indivi-dual AQCs are then averaged (could be weighted)
to obtain an overall LCC estimate. This interpolation
approach does not count for the composite effect of
multiple AQCs deviating from their as-designed targets.
It generates a single, deterministic estimate of the LCC
for the as-constructed PCCP. Consequently, it cannot
be used to estimate the LCC difference between the
as-designed and as-constructed at user specified
con-fidence levels.
In this study, we devised a re-simulation approach to
enable the statistical analysis and the estimate of LCC
difference at user specified confidence levels. The mean
and standard deviation values of AQCs obtained from
field samples are input into PaveSpec in the place of
design targets to run Monte Carlo simulations again
to estimate the LCC of the as-constructed pavement.
The re-simulation approach incorporates the aggregate
effect of multiple AQCs deviating from their design
targets; therefore, it is expected to be more accurate than
the interpolation approach. Instead of yielding one
deterministic LCC estimate for the as-constructed, a
set of estimates are available to calculate the LCC
at user specified confidence levels and to estimate
the LCC difference between the as-designed and the
as-constructed with varying probabilities.
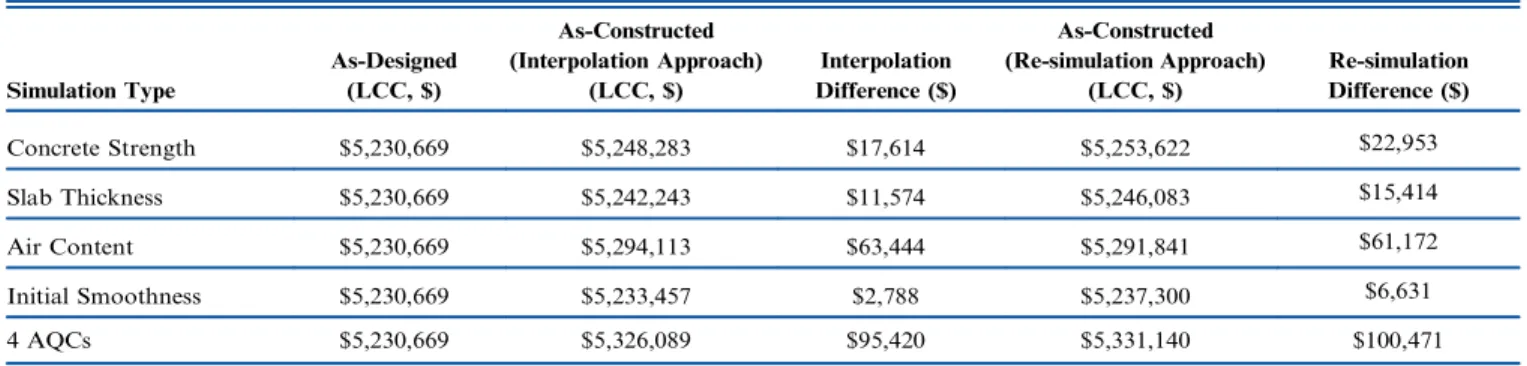
A large number of simulations were performed to
assess the effect from these two different approaches.
Figure 3.7, Table 3.5, and Table 3.6 compare the LCCs
of the as-designed and as-constructed pavements under
scenarios of either only one AQC deviating from its
design targets or all four AQCs deviating from their
design targets. All simulations were executed using both
levels of specification, Level 1 and Level 2 Specification.
The re-simulation approach leads to more consistent
results than the interpolation approach. Furthermore,
for a PCCP whose slab thickness is thinner than the
design target and whose initial smoothness is worse
than the design target, the interpolation approach
esti-mates the LCC of the as-constructed to be lower than
the LCC of the as-designed. This is opposite to the
reality: thinner slab and inferior smoothness lead to a
higher LCC, not a lower one.
3.5 Level 1 Specification versus Level 2 Specification
The major difference between Level 1 and Level 2
Specifications is that the interactions of AQCs are only
included in the Level 2 Specification (Hoerner & Darter,
1999). For example, increasing concrete strength may
offset a deficiency in slab thickness. However, only a
Level 2 Specification can account for this effect.
A large number of simulations were conducted to
assess the difference between the Level 1 Specification
and Level 2 Specification in estimating the LCC of both
as-designed and as-constructed. Figure 3.8 and Table 3.7
compare the simulation results of Level 1 and Level 2
Specifications when as-constructed AQC values are
dif-ferent from their as-designed target values, but still in
acceptable ranges. Level 2 Specification results in slightly
smaller as-designed LCCs than those of Level 1
Speci-fication. In all scenarios, LCC differences between
as-designed and as-constructed values are smaller when
using Level 2 Specification. LCC differences in the first
three scenarios, in which only one AQC deviates from
its design target, are slightly different between Level 1
and Level 2 Specifications. The 4 AQCs scenario (i.e.,
all four AQCs deviate from their design targets)
illus-trates the largest discrepancy between Level 1 and Level 2
results, highlighting the significance of the impact
con-sidering the interactions among the AQCs.
3.6 Selecting the Approach and the Level of Specification
In Section 3.4 and 3.5, it was illustrated that the
re-simulation approach leads to more consistent results
than the interpolation approach and Level 2
Specifi-cation results more closely reflect the reality. To select
the approach (i.e., the interpolation approach versus
the re-simulation approach) and the level of
specifica-tion (i.e., the Level 1 Specificaspecifica-tion and the Level 2
Speci-fication) to be used by INDOT, a number of simulation
scenarios were crafted to evaluate the composite effect
on the LCC estimates from the two approaches and
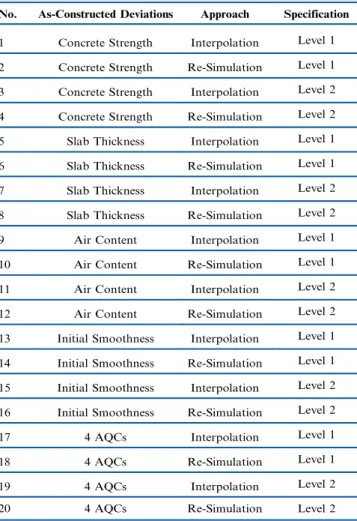
two levels of specification. Table 3.8 lists all 20 scenarios
used in this analysis. Only one AQC deviates from its
design target in the first sixteen scenarios. In the last
four scenarios, all four AQCs deviate from their design
targets.
Table 3.9 shows the cross-comparison results to
assess the effect of level of specification. The magnitude
of the LCC difference between the interpolation approach
and the re-simulation approach is always significantly
larger in Level 2 than in Level 1. In particular, LCC
difference of four AQC deviations in Level 2 Specification
constitutes around fourteen percent of construction price.
Table 3.10 shows the cross-comparison results to
assess the effect of the approach. The magnitude of the
LCC difference between the Level 1 and Level 2
Specifi-cations is always significantly larger under the
inter-polation approach than under the re-simulation approach.
Moreover, LCC difference of four AQC deviations in
the interpolation approach constitutes around eleven
percent of the construction price.
The comparison results highlight the significant
dif-ference between the use of different approaches and
different levels of specifications. Following the
discus-sions with the SAC, it was concluded that the Level 2
Specification and the re-simulation approach reflect
the reality more closely and fits the application needs
better. Therefore, the re-simulation approach and
the Level 2 Specification were selected to develop the
TABLE 3.5
Comparison of LCC results of the interpolation and the re-simulation approaches (Level 1 Specification).
Simulation Type As-Designed (LCC, $) As-Constructed (Interpolation Approach) (LCC, $) Interpolation Difference ($) As-Constructed (Re-simulation Approach) (LCC, $) Re-simulation Difference ($) Concrete Strength $5,230,669 $5,248,283 $17,614 $5,253,622 $22,953 Slab Thickness $5,230,669 $5,242,243 $11,574 $5,246,083 $15,414 Air Content $5,230,669 $5,294,113 $63,444 $5,291,841 $61,172 Initial Smoothness $5,230,669 $5,233,457 $2,788 $5,237,300 $6,631 4 AQCs $5,230,669 $5,326,089 $95,420 $5,331,140 $100,471
Figure 3.7 LCC results comparisons of the interpolation and the re-simulation methods: (a) Level 1 Specification; (b) Level 2 Specification.
decision framework for failed PCCP materials for
INDOT.
3.7 LCC Trend and Sensitivity Analysis Via Simulations
Upon the selection of the re-simulation approach
and the Level 2 Specification for estimating the LCCs
of failed PCCP materials, a series of simulation scenarios
were designed to examine the sensitivity and trend of
LCCs in correspondence to changes in the means and
standard deviations of the AQCs, covering both
accep-table and failed ranges. All simulations were
con-ducted for a three-
sublot lot
of PCCP with the sampling
methods specified in INDOT specifications (INDOT, 2011).
Figure 3.9 illustrates the trends of the LCCs of the
as-constructed PCCP to the variations in the standard
deviation and mean of individual AQCs. The
simula-tion results of flexural strength and thickness show an
obvious trend: lower means (lower quality) and higher
standard deviations (lower consistency) correspond to
higher LCC estimates. The simulation results of
smooth-ness show that higher means (lower quality) and larger
standard deviations (lower consistency) associate with
higher LCC estimates. This is because a higher
smooth-ness value indicates a lower quality pavement. The
simula-tion results of the air content present a dilemma. The
trend is such that higher mean and lower standard
deviation associate with lower LCC estimates. However,
INDOT specifies the failure criteria for air content as a
range rather than a threshold value. Figure 3.10 illustrates
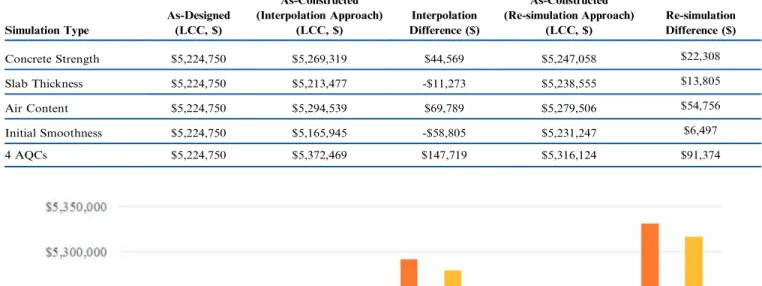
TABLE 3.6
Comparison of LCC results of the interpolation and the re-simulation approaches (Level 2 Specification).
Simulation Type As-Designed (LCC, $) As-Constructed (Interpolation Approach) (LCC, $) Interpolation Difference ($) As-Constructed (Re-simulation Approach) (LCC, $) Re-simulation Difference ($) Concrete Strength $5,224,750 $5,269,319 $44,569 $5,247,058 $22,308 Slab Thickness $5,224,750 $5,213,477 -$11,273 $5,238,555 $13,805 Air Content $5,224,750 $5,294,539 $69,789 $5,279,506 $54,756 Initial Smoothness $5,224,750 $5,165,945 -$58,805 $5,231,247 $6,497 4 AQCs $5,224,750 $5,372,469 $147,719 $5,316,124 $91,374
Figure 3.8 LCC results comparisons of Level 1 Specification and Level 2 Specification. TABLE 3.7
LCC results comparisons of Level 1 Specification and Level 2 Specification.
Simulation Type Level 1 As-Designed (LCC, $) Level 1 As-Constructed (LCC, $) Level 1 Difference ($) Level 2 As-Designed (LCC, $) Level 2 As-Constructed (LCC, $) Level 2 Difference ($) Concrete Strength $5,230,669 $5,253,622 $22,953 $5,224,750 $5,247,058 $22,308 Slab Thickness $5,230,669 $5,246,083 $15,414 $5,224,750 $5,238,555 $13,805 Air Content $5,230,669 $5,291,841 $61,172 $5,224,750 $5,279,506 $54,756 Initial Smoothness $5,230,669 $5,237,300 $6,631 $5,224,750 $5,231,247 $6,497 4 AQCs $5,230,669 $5,331,140 $100,471 $5,224,750 $5,316,124 $91,374