REVIEW ARTICLE
Cold atom interferometers and their applications
in precision measurements
Jin WANG
(
)
1,2,
Lin ZHOU(
)
1,2,3,
Run-bing LI(
)
1,2,3,
Min LIU(
)
1,2,
Ming-sheng ZHAN
(
)
1,21State Key Laboratory of Magnetic Resonance and Atomic and Molecular Physics, Wuhan Institute of
Physics and Mathematics, Chinese Academy of Sciences, Wuhan 430071, China
2 Center for Cold Atom Physics, Chinese Academy of Sciences, Wuhan 430071, China 3 Graduate School, Chinese Academy of Sciences, Beijing 100080, China
E-mail: [email protected]
Received March 7, 2009; accepted March 16, 2009
Experimental realization of cold 85Rb atom interferometers and their applications in precision mea-surements are reported in this paper. Mach–Zehnder and Ramsey–Bord`e type interferometers were demonstrated. Detailed descriptions of the interferometers are given including manipulation of cold atoms, Rabi oscillation, stimulated Raman transitions, and optical pumping. As an example of using atom interferometers in precision measurements, the quadratic Zeeman shift of hyperfine sublevels of 85Rb was determined.
Keywords atom interferometer, cold atom, precision measurement PACS numbers 37.10.Gh, 37.25.+k, 06.20.Jr
Contents
1 Introduction 179
2 Basic principle of an atom interferometer 180
3 Experimental setup 181
3.1 Manipulations of cold atoms 182
3.2 Raman laser beams 182
3.3 Optical pumping 183
3.4 Stimulated Raman transitions 183
3.5 Rabi oscillation 184
4 Mach–Zehnder interferometer 184
5 Ramsey–Bord`e interferometer 185
6 Precision measurements of the quadratic
Zeeman shift 185
7 Conclusions 188
Acknowledgements 188
References 188
1 Introduction
The atom interferometer has attracted more and more attention recently. However, the investigation of the atom interferometer has a long history. Rabi [1] re-alized the manipulation of the inner quantum state of atoms by radio frequency resonance in 1938. Ramsey
[2] studied the coherent superposition of atomic inner states by separated field oscillation in 1949. There are two main methods for manipulating the atomic wave packet in atom interference experiments; one is diffrac-tive grating based on laser standing wave [3], the other is atomic beam splitting and combining using stimulated Raman transition [4]. Due to the progress of laser cool-ing, trapping and manipulation techniques for neutral atoms, the investigation of the atom interferometer and its application have made great achievements. Similar to the light wave interferometer, atom interferometers have displayed great potential of application, such as measure-ment of gravity constant G, gravity accelerationg and absolute gravity gradient, extremely sensitive probe for rotation, accurate measurement of photon recoil, tests of general relativity, inertial navigation, underground struc-ture detection, oil well reconnoitering, and geodesy. The first cold atom interferometer was demonstrated in 1991 [4], it has been applied to the measurement of gravity acceleration [5] and rotation [6−8]. A thermal atom beam was also used for interference experiment, due to the higher density of particles in the atom beam and thus the better signal-to-noise ratio, the thermal atomic beam gyroscope achieved better sensitivity [7], but that also means higher longitude speed and longer vacuum
c
chamber. To improve the sensitivity of an atom inter-ferometer, either a large loop area or low velocity of atoms is needed. The average velocity of a cold atom prepared in MOT is several meters per second, thus cold matter wave interferometers possess potential in integra-tion over their thermal atomic beam counterparts when they are used as precise inertial sensors. Dual loop con-figuration was adopted in the cold atom gyroscope [8] for eliminating the common model noise. Attention has also been paid to space application of cold atom Sagnac interferometers [9]. Meanwhile, various interference ef-fects [10, 11] with ultracold atoms could also be used in atom interferometers. In this paper we report our labora-tory prototype of a laser-cooled85Rb atom interferom-eter [14, 15]. Different from cold atom interferominterferom-eters of other groups, this atom interferometer is in a hori-zontal configuration; cold atoms are pushed horihori-zontally from trap chamber to interaction chamber. We describe the technical treatments including manipulations of cold atoms, Raman laser beams, Rabi oscillation, stimulated Raman transitions, and optical pumping. Details are given to the demonstration of Mach–Zehnder interfer-ometer, Ramsey–Bord`e interferometer, and the precision measurements of magnetic fields using the atom interfer-ometer [16, 17].
2 Basic principle of an atom interferometer
The working principle of an atom interferometer is based on the wave-like properties of matter that can be illus-trated by the famous Young’s double slit experiment of light. Similar to the optical Mach–Zehnder (M–Z) in-terferometer, atoms with the same initial state interfere with each other when they move along different paths and meet again. In optical M–Z interferometers laser beams are steered by mirrors, while in atom M–Z inter-ferometers, matter wave is split, reflected, and combined by standing wave of Raman laser beams, and the in-ternal state of the atoms entangles with the path, and state-sensitive detection reveals the fringes without need for the atom paths to be spatially resolved.
A similar beam splitter of atom interferometers is im-plemented using Raman transitions between two hyper-fine states in a three-level atom. Atoms obtain recoil momentum and change their internal state when they absorb and emit photons, and the recoil momentum fur-ther changes the move direction of atoms. In a typical configuration, stimulated Raman transitions offer a two-photon recoil momentum, thus improving the spatial res-olution of matter wave paths.
As shown in Fig. 1, two counter-propagating laser fields ω1 and ω2 couple the ground states |a, |b and the excited state|cof three-level atoms,ω1 and ω2 are tuned off-resonant from the excited state and satisfies the Raman resonance condition: ω1−ω2=E|b−E|a=
ΔEhf or the two-photon detuningδ=0. Atoms are pre-pared in the superposition of|aand|b. Here, counter-propagating light beams excite Doppler sensitive transi-tions; in other case, co-propagating light beams configu-ration can also be used to make Doppler insensitive tran-sitions. Coherent stimulated Raman transition happens when the relative phase betweenω1 andω2 is stable. If the single-photon detuningΔ is large enough while the spontaneous emission of |c can be ignored, the three-level system can be considered as a two-three-level system un-der the rotation wave approximation and adiabatic ap-proximation. Suppose the initial state of atoms is |a, after a Raman interaction time of τ the population of state|b,Pb, can be described as:
Pb(τ) = Ω 2 eff Ω2 eff+δ2 sin2Ωeff2 +δ2τ 2 (1)
Fig. 1 Level diagram of Raman transitions between two hyper-fine states in a three-level atom. ω1 and ω2 are frequencies of lasers,|aand|bare the ground states,|cis the excited state,δ is two-photon detuning, andΔis single photon detuning.
whereΩeff is effective Rabi frequency which depends on single-photon detuningΔ. Eq. (1) shows that population dependence behavior of the ground states under Raman interaction is the same as Rabi oscillation in the interac-tion between the microwave field and a two-level atomic system.
A typical Raman laser configuration for a M–Z type atom interferometer isπ/2–π–π/2. If the initial momen-tum of atoms is p, after the first π/2 pulse is applied to atoms, the momentum of atoms in state |a, p stays unvaried, while atoms in state|b,pobtain two-photon recoil momentum|2k|, and change to|b,p+|2k|, thus the atoms in|b,p+|2k|are split from those in|a,p. When theπpulse Raman beams interact with atoms in states|a,pand|b,p+|2k|, atoms obtain two-photon recoil momentum and change their states from|a,pand |b,p+|2k|to|b,p+|2k|and|a,prespectively. After the otherπ/2 pulse is applied to atoms, atoms in state |b, p+|2k|are split into|a, pand |b, p+|2k|, and atoms in state|a,pare split into|a,pand|b,p+|2k|.
States|a,pand|b,p+|2k|overlap spatially. In other words, the initial state of atoms is entangled with the path, and detection of population in one of the ground states reveals the interference fringes.
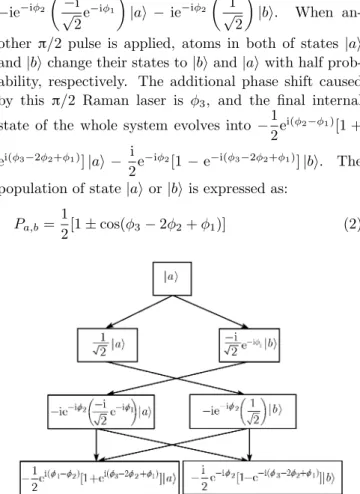
The phase shift of atoms in the M–Z type atom in-terferometer is illustrated in Fig. 2. Atoms with ini-tial state |a are split by a π/2 Raman pulse, half of them still stays in state |a; another half is transferred to state|b, and their phase shift caused by Raman laser is φ1, thus atoms are prepared in the coherent super-position state √1
2|a+ 1 √
2e
−iφ1|b. Then the π pulse swaps the states of atoms and add the laser phase shift
φ2 to atoms, the internal states of atoms then becomes −ie−iφ2 −i √ 2e −iφ1 |a −ie−iφ2 1 √ 2 |b. When an-other π/2 pulse is applied, atoms in both of states |a and|bchange their states to|band|awith half prob-ability, respectively. The additional phase shift caused by this π/2 Raman laser is φ3, and the final internal state of the whole system evolves into −1
2e
i(φ2−φ1)[1 + ei(φ3−2φ2+φ1)]|a − i
2e
−iφ2[1−e−i(φ3−2φ2+φ1)]|b. The population of state|aor|bis expressed as:
Pa,b= 1
2[1±cos(φ3−2φ2+φ1)] (2)
Fig. 2 The phase shift of atoms in M–Z type atom interferome-ter.
Eq. (2) shows that the variation of population in one of the ground states depends on the phase shifts of the Raman laser pulse. Continually varying the phase φ1 (or φ2, φ3) and probing the population of state |a (or |b) will display an interference fringe. Thus, any phase changing factors can be measured with the interferome-ters.
3 Experimental setup
Our experimental arrangement is shown in Fig. 3. A
non-magnetic stainless steel chamber with fourteen windows was used for magneto-optical trap (MOT), and a longer chamber combined with stainless steel cubes and nip-ples was used for interference area. There is a mini hole with a diameter of 3 mm to separate the chambers be-tween the MOT and interference regions. Two ion pumps (Varian, 20l/s) were used to keep the high vacuum for two chambers. At the beginning stage of pumping and backing, a glass rubidium reservoir was loaded into one arm of a six-way cross which connected to the end of the MOT chamber. A linear motion feedthrough, which connected to the opposite arm of rubidium reservoir of six-way cross, was used to crash the rubidium reservoir to release rubidium vapor after completely pumping and backing the whole vacuum system. The vacuum pres-sure of the MOT chamber was 2×10⁻⁵ Pa and that of interference chamber was 2×10⁻⁷Pa.
Fig. 3 Diagram of the experimental setup. Cold atoms fly hori-zontally from the MOT to the probe region. The magnetic field is adjusted through the currents of two pairs of Helmholtz coils. Laser induced fluorescence (LIF) signal is detected by a photo-multiplier tube.
The cooling and trapping light was provided by a ta-pered amplifier diode laser system (TOPTICA TA100) and the repumping light was taken from an external-cavity diode laser (TOPTICA DL100). The trapping laser and repumping laser were all locked to85Rb tran-sition [18, 19] via standard saturation spectroscopy, and the linewidth of lasers were as less than 1 MHz. The frequency of trapping laser was shifted by an acousto-optical modulator (AOM) to the red side of the reso-nant frequency of the 5S1/2,F= 3→5P3/2,F=4 tran-sition with amount of 12 MHz, and the frequency of the repumping laser was stabilized to the 5S1/2, F= 2 → 5P3/2,F= 3 transition. Trapping and repumpimg laser beams were introduced to the vacuum windows via po-larization maintenance optical fiber (PMF). Three pairs of counter-propagating trapping beams had a (1, 1, 1) configuration. Each pair wasσ+–σ−polarized with equal intensity.
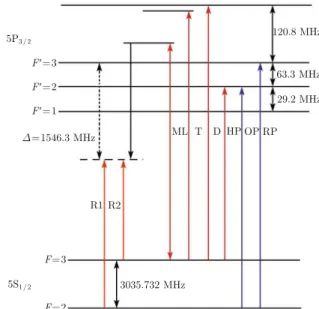
The Raman beams were generated by a high frequency AOM (Brimrose, 1.5 GHz). The frequency assignment was shown in Fig. 4. Intensities of the Raman beams (R1, R2) were carefully optimized to obtain aπpulse or
π/2 pulse.
A charge-coupled device (CCD) camera was used to monitor the fluoresce signal of the MOT. A photo
multi-plier tube (PMT) was used to monitor the laser induced fluorescence (LIF) signal of the ground states’ popula-tion.
Fig. 4 Laser frequency assignment and energy levelsof85Rb. R1, R2: Raman laser beams, ML: Main Laser; T: Trapping laser, D: Detection laser; OP: Optical pump laser; HP: Hyperfine pump laser, RP: Repumping laser.
3.1 Manipulations of cold atoms
One of the key steps is preparation and manipulation of cold atoms. A quadrapole magnetic field, sufficient atomic vapor and appropriate detuning of laser frequen-cies are required for operating a MOT. In our setup, the water-cooled anti-Helmholtz coils generated quadrapole magnetic field with gradient of 20 G/cm. Rubidium va-por inside the vacuum chamber was produced by baking the outside of the stainless steel six-way cross which con-taining the rubidium reservoir, and a bake belt was used to bake the chamber. A suitable temperature for baking was 90◦C, and the baking time varied form from half an hour to several hours which depends on the effective path from sample site to the center of the MOT. The overlap-ping of trapoverlap-ping beams and the magnetic field, as well as frequency detuning of lasers were adjusted carefully. Fluorescence signal was monitored using CCD during the adjusting process. Once the magnetic field, vapor pres-sure, and laser frequencies satisfied the MOT condition, atoms were cooled and trapped, and a bright cloud ap-peared in the CCD monitor corresponding to the center area of the MOT.
Atoms were first prepared in the MOT, and then were applied polarization gradient cooling (PGC). About 1×10⁸atoms were trapped during 1 s loading time. The temperature of the atom cloud was below 50 μK. Af-ter the PGC process, the MOT magnetic field and the trapping light were both switched off; a near resonance laser pulse (700 μs) was applied to push the cold 85Rb
atom cloud to fly transversely from the trapping area to the probing area at a speed of 24 m/s, the details of the pushing techniques are similar to our previous work [20]. The cold atoms spend 30 ms to fly to the detection region which was 70 cm away. A perpendicu-lar laser beam near resonance with the transition 5S1/2,
F= 3 → 5P3/2, F= 3 pumps atoms completely to the 5S1/2,F = 2 ground state. Cold atoms inF= 2 state in the interaction area were ready for performing the stim-ulated Raman transition and atom interferometry. 3.2 Raman laser beams
Raman laser is essential for an atom interferometer. The two-photon Raman pulse drives Rabi oscillations be-tween two ground hyperfine levels (5S1/2, F = 2 and 5S1/2, F = 3 for 85Rb) via the excited state (5P3/2 for85Rb). The Raman pulse sequence [21],π/2–π–π/2, crosses with the atomic beam perpendicularly as illus-trated in Fig. 3. For the horizontal configuration ferometer, Raman lasers were continually on, and inter-action area of π/2 orπ were controlled by transit time of atoms across the Raman beams, laser beam size, laser intensity, and velocity of atoms. As shown in Fig. 4, the frequency difference of Raman lasers (shown as R1, R2) should be equal to the gap between two hyperfine lev-els of ground state, and the exact value is 3.035 GHz for
85Rb. For this purpose, the laser (shown as OP) resonant
with theF = 3→F= 4 was double-passed through an AOM which was driven by a 1.517 GHz microwave signal [22]. The microwave signal was supplied by a microwave generator (Agilent 8257C), which was referenced to tim-ing signal from a hydrogen clock (short term stability is better than 1×10⁻¹³).
The 0th order and the 1st order output of the AOM were used for Raman beams. To verify the value of fre-quency difference, the 1st order and the 0th order out-put beams were combined by mirrors and detected by a photo diode, and the output beat signal was recorded by a spectrum analyzer. As shown in Fig. 5, the peak frequency of the beat signal is exactly 3.03573 GHz.
The frequency of R1 was tuned to the red side of tran-sition 5S1/2,F = 2→5P3/2,F=2 with a large detuning of 1.5 GHz. Two Raman beams with orthogonal linear polarization were overlapped via a polarizing beam split-ting (PBS) cube and were inputted into a PMF. PMF not only acted as a spatial filter for laser beams, but also minimized potential phase shifts of co-propagating Raman beams. The output Gaussian beams of the fiber were expanded and collimated, and the diameter (1/e2) of collimated beams was 10 mm. The intensity ratio of output Raman beams was adjusted to a suitable value for minimizing unwanted ac Stark shifts. The Raman beams were then divided into three pairs via half wave plates and PBS cubes, and then to viewports of the interference
chamber. Intensities of each pair of Raman beams were adjusted carefully to satisfy the intensity ratio of 1:2:1 forπ/2,π,π/2 pulses.
Fig. 5 Beat signal of the Raman lasers. The peak frequency is 3.03573 GHz. The resolution of the spectrum analyzer was set to 10 kHz, the span was set to 20 MHz.
3.3 Optical pumping
Before the Raman pulses were applied, an optical pump-ing light resonant with the 5S1/2,F = 3↔5P3/2,F=3 transition was used to prepare all atoms in F=2 state. There are five magnetic sublevels (mF=0, ±1, ±2) for hyperfine level 5S1/2,F = 2, and seven sublevels (mF=0, ±1,±2,±3) forF=3 when an external magnetic field ex-ists. When the Raman beams (R1, R2) with circular po-larization (σ+, σ+) propagated along the magnetic field and interacted with atoms, coherent population transfer occurred for the hyperfine Zeeman sublevel transitions (−2,−2),(−1,−1),(0,0),(1,1),(2,2) where (i,j) stands for the transition (F = 2, mF =i → F = 3, mF = j). The maximum population transferred when two-photon resonance was satisfied according to the transition selec-tion rules.
Atoms were distributed in these five magnetic sub-levels when a bias magnetic field existed. In fact, we chose magnetically insensitive mF=0 state for the in-terferometer experiment, thus the signal-to-noise ratio was limited by the small population of mF=0 state. To solve this problem, all atoms should be pumped to
mF=0 state during the sate preparation stage. Two linearly polarized laser beams were adapted in the op-tical pumping process. The frequencies of two opop-tical pumping beams (shown as OP and HP in Fig. 4) were tuned to resonantce with transitionF= 2→F= 2, and
F= 3→F= 2, respectively. Beam OP propagated per-pendicular to bias magnetic field and stimulated the π transition, atoms in sublevelsF= 2,mF=±1,±2 were pumped to F= 2, mF=±1, ±2, while atoms in level
F = 2, mF= 0 unchanged due to forbidden transition
F= 2, mF= 0 → F= 2. Then atoms in sublevels of
F = 2 decayed to sublevels ofF= 2 andF= 3 via spon-taneous emission. Beam HP propagated along the bias magnetic field, the linear polarization was decomposed to circular polarization beamsσ+ and σ−. Lasers with
σ+ polarization excited the transitions which satisfied
ΔmF=+1 between sublevels ofF= 3 andF= 2, while beams with σ− polarization excited the transitions of ΔmF=−1. Atoms in all sublevels ofF= 3 were pumped to sublevels of F= 2. Atoms inF= 2,mF= 0 was not involved in the above cycle, and most of the atoms were pumped toF= 2,mF= 0 after several cycles.
Population distribution of hyperfine Zeeman sublevels under the bias magnetic field of 220 mG is shown in Fig. 6. The zero detuning corresponding to the tran-sition of F= 2, mF= 0 → F= 3, mF= 0, and the ab-solute frequency difference between two Raman beams was 3.035 732 436 GHz. The scanned range of frequency detuning was 400 kHz, and the frequency difference of Raman beams changed from 3.035 532 436 GHz to 3.035 932 436 GHz. The dotted line in Fig. 6 is the popula-tion of sublevels before optical pumping, while the solid line is that after optical pumping. Atoms distributed in different Zeeman sublevels were pumped to mF= 0 state via optical pumping process. The number of atoms involved in Raman transition was improved more than three times by optical pumping.
Fig. 6 Population distribution of hyperfine Zeeman sublevels. The bias magnetic field B was 220 mG. The peaks (−2,−2), (−1,−1), (0, 0), (1, 1), (2, 2) are resonance transitions between differentmF states ofF= 2 andF= 3. The scanned range of fre-quency detuning was 400 kHz, and the zero detuning corresponding to the absolute frequency difference of 3.035 732 436 GHz between two Raman beams. The dotted line is the population distribution of sublevels before optical pumping, while the solid line is after optical pumping.
3.4 Stimulated Raman transitions
In atom interferometers, Raman beams help to realize the population transition and supply the recoil momen-tum to atoms; the process is stimulated Raman transi-tions [23, 24]. If atoms absorb a photon from the laser field and spontaneously emit a photon at the same time, because the direction of spontaneously emitted photon is
random, the equivalent recoil momentum is single photon recoil. However, in stimulated Raman transitions, atoms absorb a photon and stimulated a photon emission, the direction of stimulated emission relies on the propagating direction of two Raman photons. As shown in Fig. 7, the momentums of counter-propagated two Raman photons are |k1| and |k2|, respectively. An atom absorbs the first photon and obtains a co-propagated photon recoil |k1|, it emits a photon and obtains a counter-propagated photon recoil|k2|. In the end, the atom emits two pho-tons with momentum|2k2|and obtains two photon re-coils|k1|+|k2|.
Fig. 7 Momentum evolution in stimulated Raman transition. Atom obtains a co-propagated photon recoil|k1|and a counter-propagated photon recoil|k2|, emits two photons with momentum |2k2|.
In our experiment, we chose two hyperfine ground states 5S1/2, F= 2 and 5S1/2, F= 3 of 85Rb as Raman lower levels, and the excited state 5P3/2,F= 2 was used for intermediate level. The wavelength of Raman lasers was set to 780 nm, and the frequency difference of two Raman laser beams was tuned to 3.035 GHz. One of the Raman laser was tuned to the red side of transition 5S1/2,
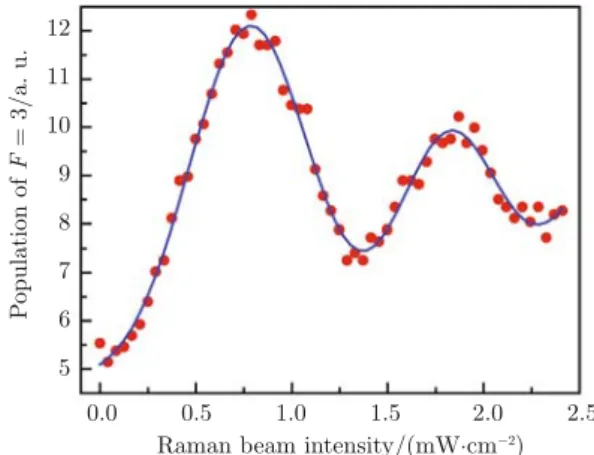
F = 2→5P3/2,F=2 with a large detuning of 1.5 GHz, while the other Raman laser was tuned to 1.5 GHz red shift of transition 5S1/2,F = 3→5P3/2, F=2. Raman lasers were collimated beams with a diameter of 10 mm as mentioned above. The intensity ratio of two Raman lasers was 1:5.3 which was optimized to greatly reduce the ac Stark shift. Stimulated Raman transition was re-alized by applying Raman laser beams to cold atoms. The result of population transfer versus intensity of Ra-man beams was recorded. Typical data is shown in Fig. 8 [14]. The dots show the experimental relative population of stateF=3 versus total Raman laser intensity, and the solid curve is a fitting.
3.5 Rabi oscillation
In a three-level system coupled by two Raman laser fields, Rabi oscillation occurs when the condition for stimulated Raman transition is satisfied [25]. The
ef-Fig. 8 Rabi oscillations for co-propagating Raman beams with detuning Δ = 1.5 GHz. The dots are the experimental relative population of stateF=3 versus total Raman laser intensity (the ratio of two lasers R1:R2 is 1:5.3). The solid curve is a fitting to the dots.
fective Rabi frequency Ωeff of coupling the two ground states is
Ωeff =Ω21ΔΩ2 (3)
where Ω1 and Ω2 are the single-photon Rabi frequen-cies, respectively. The effective Rabi frequency is pro-portional to the product of the two single-photon Rabi frequencies and inversely proportional to the laser detun-ing. According to Eq. (1), Rabi oscillation depends on the intensity of Raman lasers (Ωeff) and interaction time (τ). Gradually varying the intensity of Raman lasers, the population of state|bwill display a Rabi oscillation. We scanned the intensity of Raman lasers, by probing the population signal of hyperfine level 5S1/2, F=3 of
85Rb; we observed the Rabi oscillation as shown in Fig. 8.
The curve is a gradually attenuating sine wave, and the maxima (corresponding to π pulses) appear at a total Raman beam power of 0.8 mW/cm2 and 1.7 mW/cm2. Attenuation of Rabi oscillation was caused by the inho-mogeneous distribution of Raman beams and the broader velocity distribution of atoms. The Rabi oscillation sig-nal provides a reference for choosing theπ/2–π–π/2 Ra-man pulse sequences experimentally.
4 Mach–Zehnder interferometer
Based on the stimulated Raman transition and Rabi os-cillation, we here repeat a result of our cold atom M–Z interferometer [14] with stimulated Raman transitions. Cold 85Rb atoms were prepared in the MOT area and were pushed to the interference area by resonant laser pulse. Atomic wave packets were coherently manipu-lated using π/2–π–π/2 Raman pulse sequences in the interference region.
The detailed information of manipulation of cold atoms was mentioned in the previous paragraph. Briefly,
about 100 million 85Rb atoms were cooled and trapped in the MOT by Doppler cooling and PGC process, a near resonance laser pulse horizontally pushed the cold atoms to flight to the interaction region. The state selection process, which prepared atoms toF=2 state, was applied by a near resonant laser beam whose direction was per-pendicular to the propagating direction of atoms. The interaction chamber included five cubes with viewports, which were connected one by one. The axes of window pairs were in the vertical direction, the first pair of win-dows was used for applying optical pumping beams, the three pairs of windows in the middle were used forπ/2,π,
π/2 Raman pulse beams, respectively, and the last pair of windows was for probe beams. Also, there were five pairs of windows which were mounted on the front and back sides of the vacuum chamber. The axes of these window pairs were in the horizontal direction and perpendicular to the axes of the above window pairs, and these windows were used for fluorescence detection. For the purpose of defining a quantization axis, a bias magnetic field par-allel to Raman beams was applied. The bias field was supplied by a pair of rectangle Helmholtz coils, and the intensity of the field was 800 mG. There were additional six pairs of Helmholtz coils mounted around the interac-tion chamber, transverse bias magnetic fields supplied by these coils were used to compensate the unwanted earth magnetic field and the residue magnetic field of the ion pump.
M–Z atom interferometry was carried out as follows. Atoms in F = 2, mF = 0 state were driven by the first
π/2 Doppler insensitive Raman beams. About half of them were split and coherently transmitted to the state
F = 3, mF = 0, another half stayed in F = 2,mF = 0 state. After 4.8 ms free propagation,πRaman beams re-flected atoms and changed their internal states with each other. Then, atoms freely propagated for another 4.8 ms, the secondπ/2 Raman beams combined the atoms. Pop-ulation of state F = 3, mF = 0 orF = 2, mF = 0 was probed by LIF and recorded by a PMT.
We adjusted the phase shift of the Raman beams to verify the interference pattern. According to Equation (2), the relative phase of the firstπ/2 and theπRaman beams, φ1, φ2, were kept unvaried, while the relative phase of the secondπ/2,φ3, was changed with a cosine function. An electro-optical modulator (EOM) was in-serted in the path of one of the secondπ/2 Raman beams. We then changedφ3 gradually by adjusting the voltage applied to the EOM.
A typical M–Z interferometer fringe is shown in Fig. 9 [14]. Dots are experimental data, and the solid line is the fitted result with a cosine function. The half-wave voltage of the EOM is 125 V. There are two complete os-cillation cycles from 0 to 500 V, indicating a phase shift of 4πfor Raman beams. The fringe contrast is 37%.
Fig. 9 Interference fringes of the cold atom Mach–Zehnder inter-ferometer. Dots are experimental data, and solid line is the fitted result with a cosine function. Voltage of the EOM changes from 0 to 500 V, which generates phase shift of 4πfor Raman beams. The fringe contrast is 37%.
5 Ramsey–Bord
`
e
interferometer
Similar to the optical Ramsey–Bord`e interferometer, an atom Ramsey–Bord`e interferometer uses two pairs ofπ/2 Raman laser beams as oscillating fields. We realized a horizontally spatially separated Ramsey–Bord`e atom in-terferometer, and observed clear Ramsey fringes. In this interferometer, cold 85Rb atoms were first prepared to
F=2 state and coherently manipulated by using π/2–
π/2 Raman pulse sequence in the interference region. Among the five pairs of optical windows, the second and the fourth pairs of windows were used for twoπ/2 Ra-man pulse beams which were supplied by the same laser. Atoms inF=2,mF =0 state were driven by the firstπ/2 Raman beams, and the secondπ/2 Raman beams inter-acted with atoms after 5.7 ms free propagation. A near resonantce beam was applied to probe the population of stateF=3,mF =0.
Dependence of population of stateF=3 on frequency detuning between two Raman beams reveals a typical Ramsey interference fringes as shown in Fig. 10. As many as 23 fringes were observed and the profile of these fringes displays a good Ramsey pattern. The full width at half maximum (FWHM) of each fringe is 120 Hz. The FWHM of the Ramsey fringe can be further narrowed by optimizing the experimental parameters. It is possible to use this fringe to lock an atomic transition as a frequency standard.
6 Precision measurements of the quadratic
Zeeman shift
The atom interferometer is a very good candidate tool for precision measurements. Due to the dependence of stimulated Raman transition signal on the external mag-netic field, it is possible to measure the magmag-netic fields
Fig. 10 Ramsey fringes shown as dependence of population of stateF=3 on frequency detuning between two Raman beams. The frequency difference of Raman beams was scanned 12 kHz, zero de-tuning corresponds to a frequency difference of 3.035 732 GHz.
accurately using an atom interferometer. We have exper-imentally investigated the dependence of coherent popu-lation transfer on magnetic field [16], and measured the quadratic Zeeman shift by a cold85Rb atom interferom-eter [17]. Experimental data showed that both Rabi fre-quency and population greatly depend on the magnetic field.
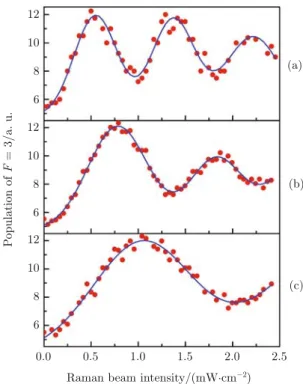
The experimental arrangement for magnetic field mea-surement is shown in Fig. 11. Two pairs of Helmholtz coils were used to supply the magnetic field B0 and B in the interference area, and a pair of circularly polar-ized Raman beams propagated along the axis of one pair of Helmholtz coils. The frequency difference of Raman beams was tuned to resonant with the space of ground states (F= 2,mF= 0) and (F= 3,mF= 0). Experimen-tal data of Rabi oscillation is shown in Fig. 12 as dots, and the solid line is the fitted result. Curves (a), (b) and (c) in Fig. 12 are Rabi oscillations data for β=0◦, 40◦, and 60◦ respectively, where β is the angle between the Raman beams and the resultant magnetic field. The population oscillates with the increase of Raman beam intensity, and the oscillation frequency (Rabi frequency) depends on the direction of the magnetic field. When a fixed parallel magnetic field (B=250 mG) was applied to
Fig. 11 The experimental arrangement for magnetic field mea-surement. Two pairs of Helmholtz coils are used to supply the magnetic fieldB0andBin the interference area, and a pair of cir-cularly polarized Raman beams propagates along the axis of one pair of Helmholtz coils.
Fig. 12 Rabi oscillation of the stimulated Raman transition. The population changes with the variation of Raman beam intensity. The oscillation periods depend on the direction of the magnetic field. Typical data for different cross angle of Raman beams and magnetic field (β=0◦, 40◦ and 60◦) are shown as(a),(b), and
(c), respectively. Dots are experimental data and solid lines are fitting curves.
the Raman beams, and the perpendicular magnetic field (B0) was increased step by step (100 mG per step), Rabi frequency changed gradually. The relation between the Rabi frequency andβ is shown in Fig. 13.
Fig. 13 Dependence of Rabi frequency on the magnetic field di-rection. The relative Rabi frequency was a cosine function ofβ. Experimental data is shown as black dots, and the dashed line is the fitted result.
When the parallel magnetic fieldB was changed while the value of perpendicular magnetic field B0 was fixed, the population transfer and oscillations were observed. Experimental data of population dependence on the magnetic fieldB and B0 are shown in Fig. 14 as doted lines, while the solid lines are theoretical results. The intensity of Raman beams was 2.9 mW/cm2, and plots
(a), (b) and (c) correspond to the perpendicular mag-netic fields ofB0=0, 250, and 500 mG, respectively.
Fig. 14 Population dependence on the perpendicular magnetic fieldB0. Plots(a),(b)and(c)are forB0= 0, 250 and 500 mG, respectively. The intensity of Raman beams is 2.9 mW/cm2. The dots are experimental data, while the solid lines are theoretical results.
Experimental data of population in F=3 versus the parallel magnetic fieldB are shown in Fig. 15. The
per-Fig. 15 Population ofF=3 versus the parallel magnetic fieldB. The perpendicular magnetic field isB0=500 mG, and plots (a),
(b) and (c) correspond to a laser intensity of 2.2, 4.1 and 6.6 mW/cm2, respectively. The dots are experimental data, while the solid lines are the theoretical prediction.
pendicular magnetic field was fixed to 500 mG, and plots (a), (b) and (c) are results corresponding to laser inten-sity of 2.2, 4.1 and 6.6 mW/cm2, respectively. When the Raman beam intensity was increased, more peaks appeared for the case of (σ+, σ−) as shown in Fig. 15 (c).
The accuracy and the fringe contrast of an atom inter-ferometer could be improved by optimizing the magnetic field dependence coherent population transfer. For this purpose, a homogenous magnetic field along the Raman beams was needed. This bias field was used to keep the quantum axis consistent and to avoid degeneracy of the magnetic sublevels, and thus Zeeman shift occurs. The quadratic Zeeman shift is important for rotation mea-surement using an atom interferometer, microwave fre-quency standards [26, 27], optical frefre-quency standards [28, 29] and coherent population trapping clock [30], and other applications. It is useful to measure accurately the quadratic Zeeman shift. We analyzed the energy of the hyperfine sublevels of the ground states in the magnetic field, and measured the quadratic Zeeman shift of the ground state of85Rb by the two-photon resonance of the stimulated Raman transition [17]. The ac Stark shift was cancelled and the residual magnetic field was com-pletely compensated, where the magnetic field was scaled by the first Zeeman shift. The quadratic Zeeman shift was measured to Hz level for magnetically insensitive states (5S1/2,F= 2,mF= 0→5S1/2,F= 3, mF = 0) in our experiment. The cancellation ratio of the differential ac Stark shift due to the imbalanced Raman beams was also measured by using stimulated Raman transitions.
When the Raman beams (R1,R2) with (σ+,σ+) prop-agate along the magnetic field B, coherent population transfer occurred. The resonance frequencies for the transitions (−2,−2) and (2, 2) under different magnetic fields were measured, and the data are shown in Fig. 16 as dots, and the solid line is the linearly fitted result. According to the scaled parameters [31−33], the scale
Fig. 16 Correlation between the resonance frequency of the hy-perfine Zeeman sublevels (−2,−2) and (2, 2) and the current of the Helmholtz coils. The dots are experimental data, while the solid line is a linear fit to the dots.
factor of the magnetic field was 1576.9±1.3 mG/A. The dependence of resonance frequency on the magnetic field intensity is shown in Fig. 17 as dots, and the solid line is the polynomial fitted result [17]. The measurement un-certainty was mainly caused by the calibrated magnetic field and the fitted error. The average frequency shift induced by the quadratic Zeeman effect for the hyper-fine Zeeman sublevels (5S1/2, F=2, mF = 0 → 5S1/2,
F=3, mF=0) was 1296.8 Hz/G2, and the average un-certainty of the quadratic Zeeman shift was 2.1 Hz/G2 for the scaled magnetic field and that for the fitted error was 2.5 Hz/G2. Considering an independent error source model, the final quadratic Zeeman shift was determined to be 1296.8±3.3 Hz/G2.
Fig. 17 Dependence of resonance frequency on the magnetic field intensity. The dots are experimental data, while the solid line is a polynomial fitting.
The precision of the quadratic Zeeman shift was mainly limited by the interaction time. Decreasing the atomic flight velocity, increasing the Raman beam di-ameter, and using the separated oscillation field method will help for more accurate measurement. However, the present experimental data are useful for higher preci-sion measurement of the quadratic Zeeman shift of85Rb, and thus for determining the rotation rate of an atom-interferometer gyroscope.
7 Conclusions
We realized a cold atom M–Z interferometer; the inter-ference fringes with contrast of 37% were observed and reported in our previous papers. Additionally, we carried out experiments with a Ramsey–Bord`e atom interferom-eter, and observed clear Ramsey fringes. Using these in-terferometers, we investigated the coherent population transfer dependence on the magnetic fields, and thus measured the quadratic Zeeman shift of Rb atoms to Hz level for magnetically insensitive states. These data are useful for improving the measurement accuracy using atom interferometers, such as the rotation rate measure-ment of an atom gyroscope.
Acknowledgements This work was supported by the National Basic Research Program of China (Grant Nos. 2005CB724505/1 and 2006CB921203), the National Natural Science Foundation of China (Grant Nos. 10774160, 10804124 and 10827404), and also funds from the Chinese Academy of Sciences.
References
1. I. Rabi, J. Sacharias, S. Millman, and P. Kusch, Phys. Rev., 1938, 53: 318
2. N. Ramsey, Phys. Rev., 1949, 76: 996
3. R. Delhuille, C. Champenois, M. Buchner, L. Jozefowski, C. Rizzo, G. Trenec, and J. Vigue, App. Phys. B, 2002, 74: 489
4. M. A. Kasevich and S. Chu, Phys. Rev. Lett., 1991, 67: 181
5. A. Peters, K. Y. Chung, and S. Chu, Nature, 1999, 440: 849 6. T. L. Gustavson, P. Bouyer, and M. Kasevich, Phys. Rev.
Lett., 1997, 78: 2046
7. T. L. Gustavson, A. Landragin, and M. Kasevich, Class. Quantum Grav., 2000, 17: 2385
8. B. Canuel, F. Leduc, D. Holleville, A. Gauguet, J. Fils, and A. Virdis, Phys. Rev. Lett., 2006, 97: 010402
9. M. C. Lee and U. E. Israelsson, Physica B, 2003, 329: 1649 10. W. M. Liu, B. Wu, and Q. Niu, Phys. Rev. Lett., 2000, 84:
2294
11. W. M. Liu, W. B. Fan, W. M. Zheng, J. Q. Liang, and S. T. Chui, Phys. Rev. Lett., 2002, 88: 170408
12. H. W. Xiong, S. J. Liu, W. P. Zhang, and M. S. Zhan, Phys. Rev. Lett., 2005, 95: 120401
13. K. Li, L. Deng, E. W. Hagley, M. G. Payne, and M. S. Zhan, Phys. Rev. Lett., 2008, 101: 250401
14. P. Wang, R. B. Li, H. Yan, J. Wang, and M. S. Zhan, Chin. Phys. Lett., 2007, 24: 27
15. M. S. Zhan, K. Li, P. Wang, L. B. Kong, X. R. Wang, R. B. Li, X. H. Tu, L. X. He, J. Wang, and B. L. Lu, J. Phys.: Conference Series, 2007, 80: 012047
16. R. B. Li, P. Wang, H. Yan, J. Wang, and M. S. Zhan, Phys. Rev. A, 2008, 77: 033425
17. R. B. Li, L. Zhou, J. Wang, and M. S. Zhan, Opt. Com-mun., 2009, 282: 1340
18. J. Wang, X. J. Liu, J. M. Li, K. J. Jiang, and M. S. Zhan, Chin. J. Quantum Electronics, 2000, 17: 44 (in Chinese) 19. K. J. Jiang, J. Wang, X. H. Tu, M. He, and M. S. Zhan,
Chin. Opt. Lett., 2003, 1: 377
20. K. J. Jiang, K. Li, J. Wang, and M. S. Zhan, Chin. Phys. Lett., 2005, 22: 324
21. J. M. McGuirk, M. J. Snadden, M. A. Kasevich, Phy. Rev. Lett., 2000, 85: 4498
22. P. Bouyer, T. L. Gustavson, K. G. Haritos, and M. A. Ka-sevich, Opt. Lett., 1996, 21: 1502
23. M. Kasevich, D. S. Weiss, E. Riis, K. Moler, S. Kasapi, and S. Chu, Phys. Rev. Lett., 1991, 66: 2297
24. K. Moler, D. S. Weiss, M. Kasevich, and S. Chu, Phys. Rev. A, 1992, 45: 342
25. M. Kasevich and S. Chu, Appl. Phys. B: Photophys. Laser Chem., 1992, 54: 321
Lett., 1982, 48: 867
27. P. R. Hemmer, G. P. Ontai, and S. Ezekiel, J. Opt. Soc. Am. B, 1986, 3: 219
28. M. Kajita, Y. Li, K. Matsubara, K. Hayasaka, and M. Hosokawa, Phys. Rev. A, 2005, 72: 043404
29. M. M. Boyd, T. Zelevinsky, A. D. Ludlow, S. Blatt, T. Z. Willette, S. M. Foreman, and J. Ye, Phys. Rev. A, 2007, 76: 022510
30. J. Vanier, Appl. Phys. B: Laser and Optics, 2005, 81: 421 31. P. L. Bender, E. C. Beaty, and A. R. Chi, Phys. Rev. Lett.,
1958, 1: 311
32. S. Penselin, T. Moran, and V. W. Cohen, Phys. Rev., 1962, 127: 524
33. E. Arimondo, M. Inguscio, and P. Violino, Rev. Mod. Phys., 1977, 49: 31