MacKenzie, L. E. and Harvey, A. R. (2018) Oximetry using multispectral
imaging: theory and application. Journal of Optics, 20(6), 063501.
(doi:
10.1088/2040-8986/aab74c
)
This is the author’s final accepted version.
There may be differences between this version and the published version.
You are advised to consult the publisher’s version if you wish to cite from
it.
http://eprints.gla.ac.uk/159073/
Deposited on: 15 March 2018
Enlighten – Research publications by members of the University of Glasgow
1
1
Oximetry using multispectral imaging: theory and application
1Lewis E. MacKenzie1, Andrew R Harvey2
2
1. Department of Chemistry, Faculty of Science, Durham University, Durham, UK.
3
DL1 3LE.
4
2. School of Physics and Astronomy, College of Science and Engineering, University
5 of Glasgow, UK. G12 8QQ. 6 7 E-mail: [email protected] 8 9
Abstract. Multispectral imaging (MSI) is widely applied across various imaging modalities as
10
a technique for measurement of blood oxygen saturation (OS) in vivo, consequently providing
11
new information about physiology and disease development. This tutorial aims to provide a
12
thorough introduction to the theory and application of MSI oximetry for researchers new to the
13
field, whilst also providing detailed information for more experienced researchers. The optical
14
theory underlying two-wavelength oximetry, three-wavelength oximetry, pulse oximetry, and
15
multispectral oximetry algorithms are described in detail. The varied challenges of applying MSI
16
oximetry to in vivo applications are outlined and discussed, covering: the optical properties of
17
blood and tissue, optical paths in blood vessels, tissue auto-fluorescence, oxygen diffusion, and
18
common oximetry artefacts. Essential image processing techniques for MSI are discussed, in
19
particular, image acquisition, image registration strategies, and blood vessel line profile fitting.
20
Calibration and validation strategies for MSI are discussed, including comparison techniques,
21
physiological interventions, and phantoms. The optical principles and unique imaging
22
capabilities of various cutting-edge MSI oximetry techniques are discussed, including
23
photoacoustic imaging, spectroscopic optical coherence tomography, and snapshot MSI.
2 2 Contents 25 1. Introduction 26
1.1 The application and utility of multispectral imaging oximetry --- 3
27
1.2 The principle of optical oximetry --- 3
28
1.3 Milestones in the development of MSI oximetry technology --- 5
29
2. Theory of oximetry
30
2.1 Two wavelength oximetry --- 6
31 2.2 Pulse oximetry --- 9 32 2.3 Three-wavelength oximetry --- 10 33 2.4 Multispectral oximetry --- 11 34
3. Challenges for in vivo multispectral imaging oximetry
35
3.1 Optical absorption by haemoglobin variants and blood plasma --- 14
36
3.2 Pigmentation in tissue --- 15
37
3.3 Optical scattering by tissue --- 15
38
3.4 Other challenges of imaging through tissue --- 16
39
3.5 Scattering by blood --- 17
40
3.6 Mitigating specular reflections from blood vessels --- 18
41
3.7 Optical paths through blood vessels --- 19
42
3.8 Rattlesnake artefacts --- 20
43
3.9 Oxygen diffusion --- 20
44
3.10 Multi-OS laminar flow in trunk veins --- 22
45
4. Image processing for multispectral imaging oximetry
46
4.1 Image acquisition --- 22
47
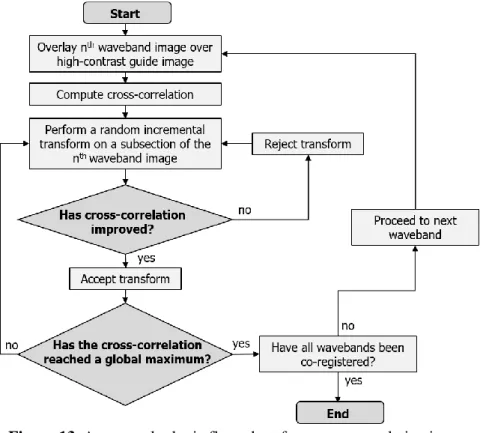
4.2 Co-registration of multispectral images --- 23
48
4.3 Estimating the Transmission of blood vessels --- 25
49
5. Strategies for validation of multispectral imaging oximetry
50
5.1 Testing fundamental optical assumptions: Monte Carlo simulations --- 26
51
5.2 Validation with artificial phantoms --- 27
52
5.3 In vivo validation strategies --- 27
53
6. Multispectral oximetry imaging modalities
54
6.1 Time-sequential multispectral imaging --- 29
55
6.2 Snapshot multispectral imaging oximetry --- 29
56
6.3 Scanning laser ophthalmoscopes --- 30
57
6.4 Photoacoustic imaging --- 30
58
6.5 Spectroscopic Optical Coherence Tomography --- 31
59
6.6 Dual-wavelength photothermal optical --- 31
60
7. Summary and Conclusions --- 31
3
3
1.Introduction
62
1.1.The application and utility of multispectral imaging oximetry 63
Highly localized measurement of blood oxygen saturation (OS) within tissue is useful for establishing
64
physiological norms, and for monitoring hyperoxia (i.e. elevated OS) and hypoxia (i.e. reduced OS);
65
which can be cause or symptom of various diseases. For example, hyperoxia is associated with
66
retinopathy of prematurity[1]; arterial occlusion induces hypoxia, with subsequent of tissue function[2];
67
and cancerous tumours can cause localized hypoxia due to excessive metabolic demand.[3,4] However,
68
many commonly used oximetry techniques, including blood gas measurement and pulse oximetry, lack
69
the spatial resolution or tissue specificity required to measure blood OS in a manner relevant for detail
70
studies of physiology or disease development. Multispectral imaging (MSI) oximetry is an optical
71
technique that utilises the OS-dependent absorption spectra of haemoglobin within blood to quantify OS
72
with high spatial and temporal resolution. This makes MSI oximetry ideal for highly specific studies of
73
OS in small blood vessels that supply tissue.[5]
74
MSI oximetry can be applied with various imaging techniques to image blood vessels in different bodily
75
tissues. For example, MSI retinal fundus cameras are utilized for measuring blood oxygen in the eye[6],
76
and MSI microscopes can be used to measure oxygen within individual red blood cells.[5] Emerging
77
imaging modalities such a photoacoustic tomography (PAT) and spectroscopic optical coherence
78
tomography (S-OCT) have also been utilized for to provide enhanced oximetry imaging capabilities:
79
PAT enables oximetry in deep tissue, and S-OCT provides simultaneous 3D mapping of both issue and
80
OS (see Section 6).
81
MSI oximetry has been applied to diverse applications in vivo, including measurement of blood OS in
82
the spinal cord,[7] the brain,[8] muscle tendons,[9,10] the bowel,[11] the oral microvasculature,[12]
83
and the skin.[13] In the eye, MSI oximetry has established the oxygen dynamics and physiological
84
norms of the retina,[6] the choroid,[14] the bulbar conjunctiva,[15] and the episcleral blood vessels.[15]
85
Various diseases have been studied with MSI oximetry, including diabetic retinopathy,[16,17]
86
glaucoma,[18–20] retinal vessel occlusion,[2,6] stroke,[8] rheumatoid arthritis,[10] diabetic foot
87
ulcers,[13,21] and cancerous tumor development.[3,22] For the full applications of oximetry to the
88
monitoring of retinal disease, readers are referred to recent reviews.[6,23,24]
89
1.2.The principle of optical oximetry 90
91
The theory of MSI oximetry is fundamentally the same across for all imaging techniques, in that all MSI
92
modalities measure the OS-dependent absorption of light by haemoglobin (see Figure 1). Haemoglobin
93
is the dominant absorber of light in blood, with typically ~250 million haemoglobin molecules inside a
94
normal red blood cell (RBC).[25] The function of haemoglobin is to transport oxygen around the body
95
by reversible binding of oxygen to four heme sub-units. These heme units strongly absorb blue and
96
green light, giving haemoglobin its distinctive red colour.* When oxygen binds or unbinds to 97
hameoglobin, the optical absorbance properties of haemoglobin are altered, resulting in a change in the
98
optical absorption spectra of blood (see Figure 1).† The affinity of haemoglobin for oxygen is described 99
the sigmoid-shaped oxygen dissociation curve, which varies with temperature and pH, as well as
100
* Note that contrary to popular belief, deoxygenated blood is not blue. The blue appearance of veins through skin
tissue is due to the combination of multiple effects, including optical scattering and absorption by tissue, combined with quirks of human visual perception.[157]
† The change in optical absorbance of haemoglobin as oxygen binds or unbinds is due to a change in electron
4
4
between species.[26] Each haemoglobin molecule can bind up to four oxygen molecules: one to each
101
heme group – resulting in five possible states for each individual hameoglobin molecule: 0%, 25%,
102
50%, 75%, and 100% oxygen occupancy. A population of many haemoglobin molecules can be of an
103
average OS anywhere between 0 – 100% OS.
104
The OS of blood is defined as:
105
OS = 𝐶𝑂2𝐻𝑏
𝐶𝐻𝑏𝑇 =
𝐶𝑂2𝐻𝑏
𝐶𝑂2𝐻𝑏+ 𝐶𝐻𝑏 , 1
Where 𝐶𝐻𝑏𝑇, 𝐶𝑂2𝐻𝑏, and 𝐶𝐻𝑏 are, respectively, the molar concentrations of total haemoglobin, fully
106
oxygenated haemoglobin, and fully deoxygenated haemoglobin. For typical arteries (i.e. blood vessels
107
carrying oxygenated blood away from the heart), nominal OS is in the range 94 - 98%, corresponding
108
to a partial pressure of oxygen (pO2) of ~ 100 mmHg. In typical veins (i.e. deoxygenated blood vessels
109
carrying blood towards the heart), nominal OS is ~70%, corresponding to a pO2 ~ 40 mmHg.[27]
110
However, OS values within the body vary considerably, depending on parameters, such as the
111
atmospheric partial pressure of oxygen (pO2), blood flow velocity, and metabolic demand by tissue. For
112
example, the metabolic remand for oxygen in retinal tissue is particularly high, resulting in venous OS
113
~60%.[28]
114
The absorption spectra of fully oxygenated haemoglobin (O2Hb) and fully deoxygenated haemoglobin
115
(Hb) are shown in Figure 1. The spectra exhibit several isosbestic wavelengths at which the extinction
116
coefficients of haemoglobin are insensitive to changes in OS, interspersed with spectral bands where the
117
extinction coefficients vary strongly with OS. Two-wavelength oximetry, a simple approach to
118
oximetry, exploits the approximately linear relationship between OS and the ratio of measured optical
119
density at an isosbestic waveband to the optical density at an OS-sensitive waveband. The strength of
120
such a ratiometric technique arises from the simplicity of application: however, the assumption of
121
linearity, based on the Beer-Lambert law is an over simplification, where presence of optical scattering
122
and additional chromophores in neighboring tissue, or indeed other species of Hb within the blood, can
123
lead to inaccuracies.[29] The use of multispectral imaging with various degrees of sophistication and
124
complexity provides scope for increased accuracy and robustness in oximetry. Simply put, recording the
125
absorption of blood at more wavelengths enables more unknown parameters to be accounted for,
126
improving oximetry (see Section 2.4).
127 128
5
5
Figure 1. The optical absorption spectra of oxygenated haemoglobin (HbO2)[the red line] and deoxygenated haemoglobin (Hb)[the blue line].
Figure created from spectroscopic data tabulated by S. Prahl (1999).[30] The units for extinction coefficient are per centimetre per mole (cm-1 M-1).
1.3.Milestones in the development of MSI oximetry technology 129
130
The pioneering MSI oximetry studies of retinal OS were undertaken in the 1960s, establishing the
131
fundamental principles of two-wavelength oximetry upon which all subsequent research has been
132
built.[31–33] Initially, retinal oximetry was calibrated by ex vivo blood gas measurement. However, the
133
advent of fingertip pulse oximetry subsequently enabled simpler calibration by non-invasive
134
measurement of arterial OS via the fingertip (see Section 2.2).[34] Later oximetry studies advanced the
135
field by establishing techniques such as three-wavelength oximetry,[35] scanning laser retinal MSI,[36]
136
and high spectral resolution retinal spectrophotometry.[37,38] For more detailed information on the
137
development of retinal oximetry, the reader is referred to the 2014 retrospective by Jim Beach.[24]
138
In the late 1990s, digital imaging technology began to replace photographic cameras, paving the way
139
for automated computational analysis of images.[24,39] The mid-to-late 2000s saw the development of
140
two commercially available retinal oximetry systems; the Oxymap T1 retinal oximeter (Oxymap ehf,
141
Iceland) [40] and the Imedos retinal oximeter (Imedos Systems UG, Germany).[17] Advances in
142
computational power and techniques enabled automatic oximetry, consequently enabling the study of
143
numerous retinal diseases by ophthalmologists.[23]
144
In the past decade, emerging imaging modalities have enabled MSI oximetry to be applied to
145
increasingly diverse in vivo applications. Snapshot MSI systems have enabled oximetry with sub-second
146
temporal resolution, enabling observations of fast biological processes such as oxygen diffusion into the
147
microvasculature [15] and MSI endoscopes have provided measurements in tissue that are not accessible
148
with traditional imaging techniques, e.g. within the bowel.[11] Photoacoustic techniques have enabled
149
deep-tissue oximetry of the brain, cancer tumors, and entire small animals,[41] and spectroscopic optical
150
coherence tomography (S-OCT) has enabled complimentary 3D mapping of OS and tissue structure.[42]
151
Across all MSI modalities, advancement and application of MSI oximetry technology has yielded
152
considerable insights into physiological norms and disease development.[6] Section 6 provides further
153
details on the applications and optical-principles underpinning these emerging MSI modalities.
6 6 2.Theory of oximetry 155 2.1.Two-wavelength oximetry 156
2.1.1.Derivation of two-wavelength oximetry 157
The simplest and most commonly used form of oximetry is two-wavelength oximetry, which is based
158
on the Beer-Lambert law of light transmission through a medium:
159
Iλ = Iλo exp (−𝑐ελ d) 2
where Iλis the intensity of the light transmitted through the medium, Iλois the intensity of the light 160
incident upon blood, c is the molar concentration of absorbers (i.e. haemoglobin) within blood [M], ελ
161
is the wavelength-dependent molar extinction coefficient of haemoglobin [cm-1M-1], and d is the optical
162
path length of light through the blood [cm]. For blood, ελ, is defined by:
163
𝜀𝜆= (𝑂𝑆 𝜀𝜆𝑂
2𝐻𝑏)+((1- OS) 𝜀𝜆𝐻𝑏), 3
where OS is the fractional blood oxygen saturation (range 0-1), ελO
2Hb is the molar extinction
164
coefficient of fully oxygenated haemoglobin, and ελHb is the molar extinction coefficient of
165
deoxygenated haemoglobin. No other chromophores are included in this simplified model. The
166
transmission, T𝜆, of the blood is defined as:
167
𝑇𝜆 = (𝐼λ
𝐼λo). 4
The optical-density of the blood, ODλ, is then defined as: 168
𝑂𝐷λ = −𝑙𝑜𝑔(𝑇𝜆) = 𝑙𝑜𝑔 (𝐼λ
𝐼λo) = c d ελ. 5
Assuming that c and d are identical at both wavelengths, then the optical-density ratio, ODR, is:
169 𝑂𝐷𝑅 =𝑂𝐷λ1 𝑂𝐷λ2= 𝑐 𝑑 𝜀𝜆1 𝑐 𝑑 𝜀𝜆2= 𝜀𝜆1 𝜀𝜆2 . 6
If one wavelength is chosen to be isobestic, i.e. insensitive to changes in OS, and the other wavelength
170
is chosen to be sensitive to changes in OS, then ODR will be linearly proportional to OS.[31] If nominal
171
OS values are known by independent means, then ODR can be empirically calibrated to OS by fitting
172
ODR to the equation of a straight line, i.e.:
173
𝑂𝑆 = 𝑎 ∗ 𝑂𝐷𝑅 + 𝑏, 7
where a and b are empirically derived calibration coefficients obtained by plotting ODR vs. OS. Thus,
174
from measuring transmission at two wavelengths, ODR can be calculated, from which OS can be
175
estimated by empirical calibration.
176
2.1.2.Optimal vessel transmission and wavelength combinations for two-wavelength oximetry 177
For accurate oximetry, blood vessels must neither be too transparent nor too opaque. Based upon work
178
by Assendelft (1970),[43] Smith derived the following optimal transmission for a blood vessel in order
179
to minimize sensitivity to measurement noise.[44] Smith’s derivation starts from the definition of
180
optical-density, ODλ: 181
𝑂𝐷λ= − 𝑙𝑜𝑔 (𝑇λ) = 𝑙𝑛(10)𝑙𝑛(𝑇λ). 8
The absolute error function for ODλ is then found by differentiating:
182 𝛥𝑂𝐷λ=𝑑𝑂𝐷𝑑𝑇λ λ 𝛥𝑇λ= 𝛥𝑇λ 𝑙𝑛 (10) 1 𝑇λ . 9
7
7 The fractional error function of ODλis then:
183
𝛥𝑂𝐷λ
𝑂𝐷λ =
𝛥𝑇λ
𝑇λ𝑙𝑛(𝑇λ) . 10
To minimise the relative error of ODλ, the first derivative, with respect to 𝑇λ, of Equation 10 must be
184
found, and then set to zero. 185 𝑑(𝛥𝑂𝐷λ/𝑂𝐷λ) 𝑑𝑇λ = 𝑙𝑛 (𝑇λ) + 1 [𝑇λ 𝑙𝑛(𝑇λ)]2 𝛥𝑇λ= 0 . 11
Discarding the non-physical solution of Tλ= 0, leaves the following solution: 186
𝑙𝑛(𝑇λ) + 1 = 0,
=> 𝑇λ = 1/e = 36.8%,
=> 𝑂𝐷λ= 0.434.
12
This solution indicates that transmission of 36.8% or an optical-density of 0.434 will be optimal for
187
minimizing errors due to uncertainties in transmission in two-wavelength oximetry. Expanding this
188
further, Smith showed that the transmission range between 10% and 70% is broadly optimal for
189
oximetry; outside this transmission range, the error function associated with measurement errors grows
190
rapidly, so accurate oximetry becomes untenable.[44]
191
In the same study, Smith (1999) theoretically investigated the noise-sensitivity of various waveband
192
combinations for two-wavelength oximetry, concluding that optimal waveband combinations for retinal
193
oximetry would be 635 nm & 965 nm as well as 488 nm & 635 nm.[44] However, these theoretical
194
waveband combinations may not be practical because they do not take into account the practical
195
constraints of available light sources, tissue irradiance limits, pigmentation, and tissue scattering
196
properties.
197
In practice, the optimal-wavelength combination for a given application is dictated by the calibre of
198
blood vessels being investigated, potential sources of confounding absorption by tissue, and the
199
constraints of the illumination and imaging systems. For two-wavelength retinal oximetry, the
200
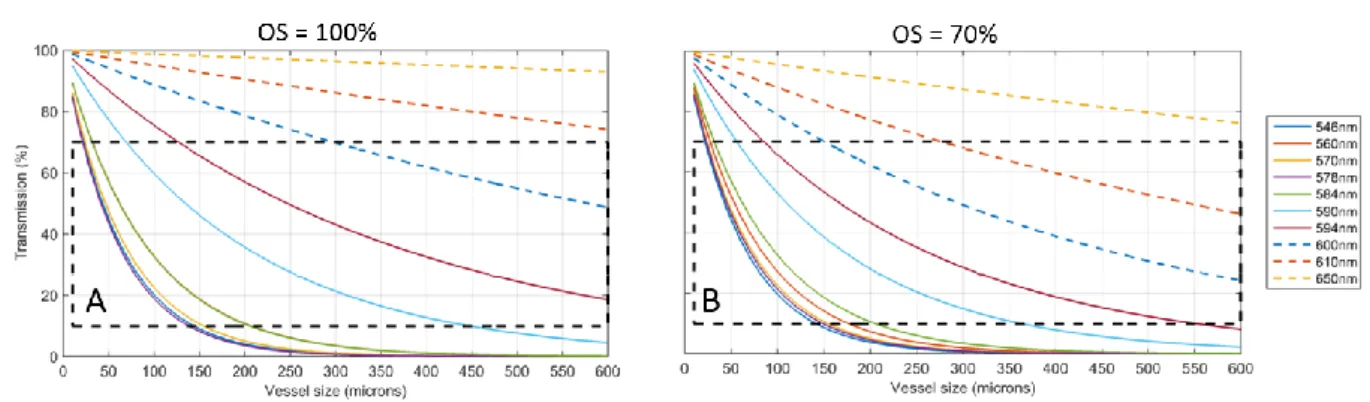
wavelength combination of wavebands ~600 nm (OS sensitive) and ~570 nm (isobestic) has been widely
201
adopted. Calculated transmissions at several wavelengths of blood vessels of a range of calibers
202
containing fully and partially oxygenated blood are shown in Figure 2. Scattering is neglected and the
203
wavelength and caliber ranges for accurate oximetry are highlighted.
204 205
8
8 206
Figure 2. Calculated single-pass transmissions for blood vessels at various wavebands assuming 207
single-pass transmission and the concentration of haemoglobin to be 20 mM. (A) 100% OS, (B) 208
70% OS. No other chromophores or optical scattering was modelled. 209
2.1.3.Corrections for blood vessel diameter and tissue pigmentation in two-wavelength oximetry 210
211
Hickam et al. (1963) noted that the observed ODR of a blood vessel is dependent on the diameter of that 212
blood vessel.[32] Exemplar experimental data verifying this effect shown in Figure 3. It is thought that 213
this ODR diameter-dependence is due to scattering of light and other terms which are not incorporated 214
in the normal Beer-Lambert law, and thus not included in the theory of two-wavelength oximetry.[45] 215
The resultant ODR offset between blood vessels of different diameters is of particular importance in 216
experiments where blood vessels change in diameter (i.e. if the vessels dilate or contract). Stimuli such 217
as hypoxia, hyperoxia, and, in the retina, flicker-light stimulation can cause such responses (see Section 218
5.3.3), and thus potentially introduce changes in ODR that are not due to changes in OS alone. 219
220
This vessel diameter-dependent effect is also problematic for oximetry of veins, which are typically 221
larger than arteries; this can lead to a spurious decrease in venous OS estimated by two-wavelength 222
oximetry. To compensate for this, Hammer et al., (2008) implemented an empirically-derived size-223
dependent venous OS correction factor.[29] A similar calibration issue is associated with tissue 224
pigmentation: in two-wavelength oximetry, venous OS can spuriously appear to increase with increasing 225
retinal pigmentation. Again, Hammer et al., (2008) implemented an empirically-derived, pigmentation-226
dependent, venous OS-correction factor to compensate for this effect.[29] 227
228 229 230
9
9 Figure 3. ODR vs. OS for fluorinated ethylene propylene
(FEP) capillaries filled with ex vivo heparinised equine blood. The 150 µm capillary has a greater baseline ODR than the 100 µm capillary, but change in ODR for a given change in OS is approximately the same for both (fitted lines). Equipment used: FEP capillaries imaged with a retinal fundus camera modified with a snapshot multispectral imaging system. OS of ex vivo equine blood verified by an optical blood gas analyser [GEM OPL, Instrumentation Laboratories] with a quoted OS uncertainty of ± 1.8% (not depicted). OS of blood was varied by addition of sodium dithionite.[46] Vertical error bars show the standard deviation of ODR along the length of the capillary section analysed.
231
2.2.Pulse oximetry 232
Pulse oximetry is widely used to non-invasively monitor arterial OS via the fingertip. Pulse oximetry
233
uses the varying optical absorption due to pulsatile arterial blood to remove the influence of background
234
absorbance by tissue and venous blood (assumed to be non-pulsatile); in this manner, pulse oximetry is
235
similar to photoplethysmography.[47] Yet, by calculating the ODR of the pulsating absorbance
236
component, two-wavelength oximetry can then be applied to estimate peripheral arterial OS.[34] To
237
enable measurement through relatively thick tissue (i.e. in the range of one to five centimeters) pulse
238
oximeters typically use wavelengths which are minimally absorbed and scattered by blood or tissue, e.g.
239
650 nm and 800 nm. Pulse oximeters are calibrated across many subjects by relating average ODR to
240
average arterial OS, as measured by an ex vivo blood-gas analyzer. In humans, pulse oximeters are not
241
calibrated for OS < 80% due to ethical constraints,[48,49] and generally have an uncertainty quoted at
242
± 2%.[50] Pulse oximeters for animal use may, however, be calibrated for lower oxygen saturations due
243
to less stringent ethical constraints.
244
In adult humans, the fingertip is the usual location for monitoring arterial OS, but pulse oximetry
245
measurements can also be made via the earlobe[51] and the big toe.[52] In infants, being smaller than
246
adults, pulse oximetry measurements can be made via alternative tissue beds, including via the palm of
10
10
the hand, the sole of the foot, and the scrotum.[53,54] However, it should be noted that pulse oximeter
248
manufacturers typically do not provide calibration for non-fingertip applications. The reliability of pulse
249
oximeters can be reduced by low blood flow, caused by factors such as pressure on the measurement
250
tissue, or by cold temperatures. As an example, the earlobe is particularly sensitive to reduced blood
251
flow due to the pressure of clip-on pulse oximeters.[51] Additionally, diseases that affect the optical
252
properties of blood, e.g. sickle cell anemia, may interfere with pulse oximetry.[55] Further, commercial
253
pulse oximeters are often ‘black box’ devices with non-optional features such as time-integrated signal
254
averaging to reduce noise in measurement. Consequently, when using pulse oximetry as a reference for
255
MSI oximetry, the limitations of both the equipment, and the physiology of the subject should be
256
carefully considered to ensure a relevant comparison.
257
2.3.Three-wavelength oximetry 258
2.3.1.Derivation of three-wavelength oximetry 259
Three-wavelength oximetry was developed by Pittman and Duling in 1975, and advanced the field of
260
oximetry by incorporating optical scattering parameters into the optical transmission models of
261
blood.[35] The technique requires three wavebands, proximal to each other in the haemoglobin
262
absorption spectrum: two isobestic wavelengths are used to estimate the contribution by optical
263
scattering, and a third wavelength is used as for OS sensitivity.
264
The derivation of the three-wavelength oximetry model starts with the modified Beer-Lambert law:
265
𝑂𝐷𝜆= 𝜀𝜆 𝑐 𝑑 + 𝐵𝜆, 13
where Bλ is a term describing the effect of scattering on optical-density. For two proximal wavelengths,
266
λ1 and λ2, 𝐵λ will be approximately equal for both, i.e.:
267
𝐵𝜆1= 𝐵𝜆2= 𝐵, 14
𝑂𝐷𝜆1= 𝜀𝜆1 𝑐 𝑑 + 𝐵, 15
𝑂𝐷𝜆2= 𝜀𝜆2 𝑐 𝑑 + 𝐵. 16
Solving Equations 15 and 16 simultaneously yields: 268
𝐵 =(𝜀𝜆1/𝜀𝜆2) 𝑂𝐷𝜆1− 𝑂𝐷𝜆2
(𝜀𝜆1/𝜀𝜆2) − 1 . 17
It should be noted here, that if the term of (ελ1/ελ2) is close to 1, then minor errors in the measurement
269
of OD can result in large errors in the estimation of 𝐵.[44] However, assuming the value of 𝐵 is
270
estimated accurately, then it can be incorporated into Equation 7 to yield:
271
𝑂𝑆 = 𝑎 (𝑂𝐷𝜆3+𝐵
𝑂𝐷𝜆𝑟𝑒𝑓+𝐵) + 𝑏, 18
Where, 𝑂𝐷𝜆3 is the optical-density at a third, oxygen sensitive, wavelength; 𝑂𝐷𝜆𝑟𝑒𝑓 is the
optical-272
density at one of the isobestic wavelengths; and 𝑎 and 𝑏 are empirically derived calibration coefficients. 273
Equation 18 is of the form of the equation of a straight line, so the OD ratio can be calibrated to OS in
274
similar manner to two-wavelength oximetry, i.e. by plotting at least two known OS reference points
275
versus the product of the right side of Equation 18.[35]
276
2.3.2.Discussion, and the application of, three-wavelength oximetry 277
278
Three-wavelength oximetry is somewhat limited in that it is only applicable for waveband triads that
279
exhibit near-identical scattering properties, somewhat similar absorption properties, whilst including
280
two isobestic wavebands and one OS-dependent contrast waveband. For example, Pittman and Duling
11
11
(1975)[35] found that blue wavelengths (420 – 450 nm) are particularly susceptible to spurious errors
282
in the estimation of the parameter, 𝐵, due to the large variations of 𝜀𝜆, and thus large variations of
283
refractive index, across this waveband. Instead, Pittman and Duling employed the more favourable
284
wavelength triad of 520 nm, 546 nm, and 555 nm, reporting ± 1% OS uncertainty for ex vivo blood
285
samples.[35]
286
Smith (1999)[44] suggested the following wavelength triads as theoretically optimal for
three-287
wavelength oximetry of retinal blood vessels: (1) 488 nm, 635 nm, and 905 nm; (2) 600 nm, 635 nm,
288
and 905 nm; (3) 635 nm, 720 nm, and 905 nm. Whilst three-wavelength oximetry may offer improved
289
accuracy over two-wavelength oximetry by accounting for scattering, three-wavelength oximetry still
290
requires calibration of ODR to blood of known OS, and the choice of potential imaging wavebands is
291
rather limited. As such, three-wavelength oximetry has been largely superseded by multispectral
292
oximetry algorithms (see Section 2.4).
293
2.4.Multispectral oximetry 294
2.4.1.Theory and derivation of multispectral oximetry algorithms 295
Multispectral and hyperspectral‡ oximetry algorithms estimate OS by computationally fitting 296
experimentally determined blood vessel transmission values to a theoretical optical model incorporating 297
OS and other optical parameters, e.g. to model the effects of optical scattering or background 298
pigmentation. Unlike two- and three-wavelength oximetry, this optical model approach enables 299
multispectral oximetry algorithms to be applied without implicit empirical calibration; however, 300
validation of oximetry is a key challenge for applying multispectral oximetry (see Section 2.4.2). 301
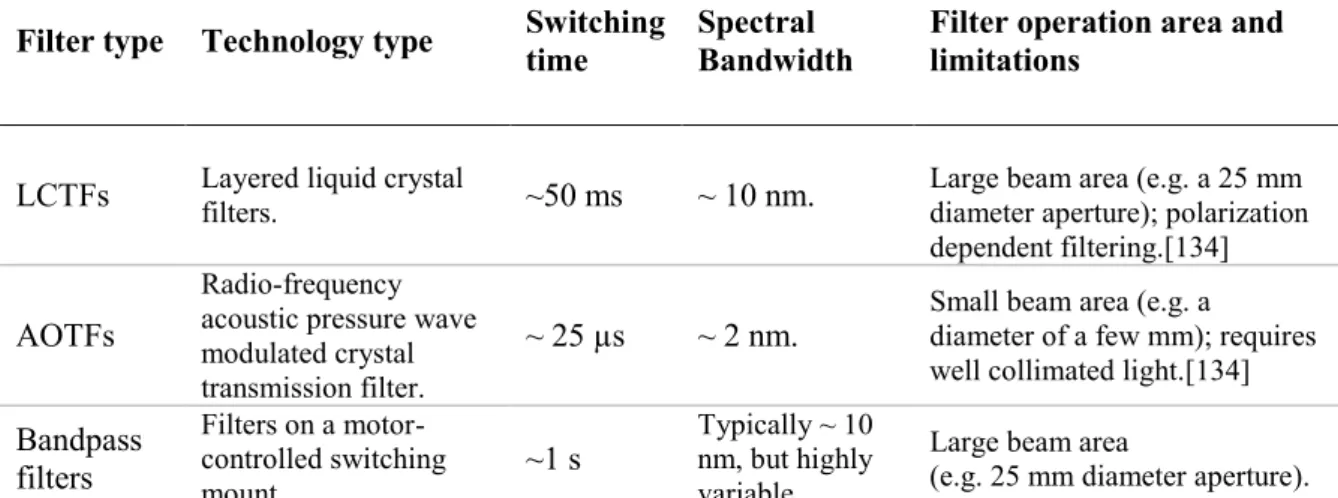
The parameters included in multispectral oximetry models vary between studies; some parameters are 302
“hard wired”, and some are estimated from the recovered fit to transmission profile. Table 1 provides a 303
summary of hard-wired and recovered parameters in published multispectral oximetry models. As a 304
minimum, multispectral oximetry models will “hard wire” in the OS-dependent extinction coefficients 305
of haemoglobin, 𝜀𝜆𝑂
2𝐻𝑏 and 𝜀𝜆𝐻𝑏. Further terms may be added to account for various other parameters,
306
including concentration of haemoglobin, blood-vessel diameter, optical-path through a blood vessel (see 307
Section 3.7), optical back scatter by blood, pigmentation of surrounding tissue, and contrast reduction 308
due to overlying tissue and scattering by the ocular media. As a general rule, the maximum number of 309
parameters that can be estimated to a model cannot be greater than the number of independent 310
measurements incorporated in the model,§ thus the more parameters that are modelled, the more 311
wavelengths are required to apply the model. A summary of multispectral oximetry models reported in 312
the literature, and the optical parameters they include, is provided in Table 1. 313
314
van der Putten et al. (2017) reported the most sophisticated multispectral oximetry model to date.[7]
315
Their model builds upon the thoroughly validated model developed by Smith et al., (2000), which is
316
applied to directly imaged blood vessels.[56] The derivation of their model starts with the Beer Lambert
317
law:
318
𝑂𝐷𝜆 = 𝑙𝑜𝑔10(𝑇λ) = 𝜀𝜆 𝐶𝐻𝑏𝑇 𝑑, 19
‡ There is no formal definition of multispectral or hyperspectral imaging. Both techniques follow the same
principle, but multispectral imaging typically incorporates fewer than ten wavebands, often non-continuous, and hyperspectral imaging can incorporate several tens or hundreds of contiguous wavebands (see Table 1 for examples). For simplicity, we will refer primarily to multispectral imaging in this paper.
§ In simplistic terms, one can imagine the example of a straight-line fit, which requires at least two data points,
12
12
where 𝐶𝐻𝑏𝑇 is the total molar concentration of haemoglobin. From Equation 1, 𝐶𝐻𝑏𝑇= 𝐶𝑂2𝐻𝑏+ 𝐶𝐻𝑏,
319
so 𝑂𝐷𝜆 can be written as:
320
𝑂𝐷𝜆= 𝜀𝜆𝑂2𝐻𝑏 𝐶𝑂2𝐻𝑏 𝑑 + 𝜀𝜆𝐻𝑏𝐶𝐻𝑏𝑑, 20
Rearranging gives:
321
𝑂𝐷𝜆= 𝐶𝐻𝑏𝑇𝑑[(𝜀𝜆𝑂2𝐻𝑏− 𝜀𝜆𝐻𝑏)𝑂𝑆 + 𝜀𝜆𝐻𝑏]. 21
To this, an additive reduced scattering coefficient µλ′ (measured by Faber et al., (2004)[57]) is added
322
to account for scattering of light by red blood cells. This gives: 323
𝑂𝐷𝜆= 𝐶𝐻𝑏𝑇𝑑[(𝜀𝜆𝑂2𝐻𝑏− 𝜀𝜆𝐻𝑏)𝑂𝑆 + 𝜀𝜆𝐻𝑏]+µ𝜆
′𝑑. 22
The contribution of single- and double-pass light paths through a blood vessel [58] can be accounted for
324
by adding two multiplicative factors, 𝛼 and 𝛽, representing the fraction of light rays that undergo
single-325
or double-pass transmission respectively (see Section 3.7). Additionally, 𝑂𝐷𝜆 can be related to
326
transmission by 𝑇λ= 10−𝑂𝐷𝜆. Therefore, Equation 22 can be rewritten as:
327
𝑇λ = [𝛼 10−(𝐶𝐻𝑏𝑇 𝑑[(𝜀𝜆𝑂2𝐻𝑏− 𝜀𝜆𝐻𝑏)𝑂𝑆+ 𝜀𝜆𝐻𝑏]+µ𝜆
′𝑑)
+
𝛽10−(2𝐶𝐻𝑏𝑇 𝑑[(𝜀𝜆𝑂2𝐻𝑏− 𝜀𝜆𝐻𝑏)𝑂𝑆+ 𝜀𝜆𝐻𝑏]+2µ𝜆′𝑑)]. 23
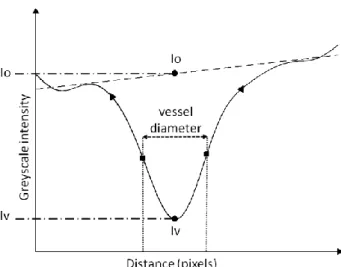
To advance this model, van der Putten et al., incorporated a novel contrast-reduction parameter, 𝐾, into 328
their multispectral oximetry algorithm.This parameter models the effects of tissue overlying a directly 329
imaged vessel. 𝐾 is described as an arbitrary increase in greyscale intensity (𝐼𝑐), both in the centre of 330
the vessel (𝐼𝑣) and outside the vessel (𝐼𝑜):
331
𝐾 =𝐼𝑣+𝐼𝑐
𝐼𝑜+𝐼𝑐 . 24
Thus, transmission can be re-written as: 332
𝑇′λ = (𝐼𝑣+𝐼𝑐
𝐼𝑜+𝐼𝑐) = 𝑇λ(1 − 𝐾) + 𝐾. 25
and the full optical transmission model can then be written as:
333 𝑇′λ = [𝛼 10−(𝐶𝐻𝑏𝑇 𝑑[(𝜀𝜆𝑂2𝐻𝑏−𝜀𝜆𝐻𝑏)𝑂𝑆+ 𝜀𝐻𝑏(𝜆)]+µ𝜆 ′𝑑) + 𝛽10−(2𝐶𝐻𝑏𝑇 𝑑[(𝜀𝜆𝑂2𝐻𝑏− 𝜀𝜆𝐻𝑏)𝑂𝑆+ 𝜀𝜆𝐻𝑏]+2µ𝜆′𝑑)] (1 − 𝐾) + 𝐾. 26
To date, this is the most sophisticated multispectral oximetry algorithm developed and, without direct
334
calibration, has provided plausible oximetry when utilised for in vivo experiments. For example, the OS
335
of the spinal cord dorsal vein in rats was estimated to be 67.8 ± 10.4% at normoxia (mean ± SD, n =
336
4),[7] and the OS of healthy blood vessels in murine tendons was estimated to be ~95%.[10] Despite
337
these encouraging results, there are still numerous challenges associated with validation of multispectral
338
oximetry algorithms. These are discussed extensively in the next section.
13
13 Table 1. Summary of notable studies utilizing multispectral oximetry algorithms.
340 Study Oximetry application Wavebands “Hard Wired” parameter values Estimated parameters recovered
van der Putten et al. 2017.[7]
Rat spinal cord dorsal vein
546, 560, 570, 584, 590, and
600 nm
ε, S. OS, c, S, d, K, 𝛼, 𝛽. van der Putten et
al. 2017.[9,10] Mouse muscle tendon capillary 410, 420, 430, 435, 440, and 450 nm ε, S. OS, c, S, d, K, 𝛼, 𝛽. Hendargo et al.,
2015.[59] microvasculature Mouse skin 540, 560, 580, and 610 nm ε. OS, c. Clancy et al.
2015.[11] Porcine bowel 28 wavebands. 440 – 700 nm, ε. OS, c, S.
Fernandes-Ramos et al.
2014.[5]
Red blood cells (ex vivo) 560 – 600 nm, 8 wavebands ε. OS, c. Mordant et al. 2014.[19] Retinal oximetry of glaucoma patients 556 – 650 nm 47 wavebands ε, S. OS, c, d,𝛼, 𝛽. Chin et al. 2012.[13] Diabetic foot ulcers in humans 500 – 600 nm, 15 wavebands ε. OS, c. Yudovsky et al. 2011.[21] Diabetic foot ulcers in humans 550 – 660 nm,
15 wavebands ε, εmel. ΔOS, c, cmel, S.
Mordant et al. 2011.[60] Human retina 500 – 650 nm 300 wavebands. ε, S. OS, c, d,𝛼, 𝛽. Sorg et al. 2008. [4] and 2005.[3] Mouse tumor model 505 – 575 nm, 16 wavebands ε. OS, c, S, 𝛼, 𝛽. Alabboud et al. 2007.[61] Human retina 500 – 700 nm 27 + wavebands ε, S. OS, c, d, 𝛼, 𝛽. Smith et al. 2000.[62] Human retina 488, 635, 670, 752, 830 nm. ε. OS, c, S, d, 𝛼, 𝛽. Drewes et al. 1999.[63] Human retina 629, 678, 821, 899 nm. ε. OS, c, S, d. Schweitzer et al. 1999.[64]
Human retina 510 – 586 nm, 76 wavebands ε, εmel. OS, c, d, 𝛼, 𝛽.
Key: ε = extinction coefficient of 𝐻𝑏 and 𝑂2𝐻𝑏 εmel = extinction coefficient of melanin pigmentation, S =
341
scattering contribution; c = concentration of Hb, 𝛼, 𝛽 = single and double pass contribution factors respectively;
342
d = diameter of blood vessels; K = contrast reduction factor.
343
2.4.2.Calibration and validation of multispectral oximetry algorithms 344
345
Potential errors in estimation of OS from MSI oximetry models, e.g. due to the influence of transmission
346
quantification error or ill-defined/poorly-modelled systematic parameter(s), have not been thoroughly
347
and robustly explored in the literature. In theory, the multi-parameter fit should, minimise errors in OS
348
due to error in transmission measurement at a single waveband, with robustness of fit increasing with
349
the number of wavebands. Ideally, further research is required to quantify potential measurement errors.
350
Like the work of Smith for two- and three-wavelength oximetry, such error minimisation research would
14
14
likely take the form simulations.[44] Direct experimental validation of MSI oximetry models, in
352
absolute terms, remains a fundamental challenge in the field of oximetry.
353
In the retina, (the vascular bed most commonly studied with oximetry) estimated OS can be compared
354
to well-established reference values (e.g. 96% for arteries and 54% for veins).[40] However, in many
355
other tissues, there are often no known absolute reference values for OS for the physiological context in
356
which the MSI oximetry model is being applied. Further, blood vessels of interest are typically
357
embedded in tissue that is both physiologically, and optically, complex; this complicates measurement
358
and comparison. Further, in applications such as tumor development, OS is likely to be very different
359
from established physiological norms due to abnormal metabolic demands.[3,4,22]
360
Healthy control subjects can be used as a qualitative reference for comparison to diseased subjects, and
361
to help infer inaccurate or spurious OS estimation. However, other factors such as anesthesia, local
362
metabolic demand, inter-subject variability, and oxygen diffusion may affect blood flow rate and OS in
363
healthy controls. Hence, it can potentially be challenging to verify if perceived discrepancies in OS are
364
due to artifacts introduced by a flawed MSI oximetry algorithm, or if they are actually due to real
365
physiological variations.[59]
366
In living subjects, pulse oximetry can only be used to only measure systemic arterial OS. Oxygen
367
sensitive nanophosphors can be used to measure local partial pressure of oxygen, but such
368
nanophosphors require biochemical expertise and complex phosphorescence lifetime imaging
369
equipment; this presents a considerable barrier to entry for researchers (see Section 5.3.2 for more
370
details).[65] Further, validation of in vivo multispectral oximetry algorithms by using artificial phantoms
371
may not be possible due to the significant differences in optical properties between phantom construction
372
materials (e.g. quartz or plastic capillaries) and real tissue (see Section 5.2 for more details on phantom
373
design). Oxygen-sensitive interventions that induce changes in the OS of blood, do however, allow
374
researchers to validate oximetry by inducing artificial changes in OS distinct from physiological norms,
375
enabling inter-subject comparison. Such interventions are discussed in detail in Section 5.3.3.
376
Fundamentally, the challenge of validating multispectral oximetry algorithms is that multispectral
377
oximetry algorithms are often the only method capable of providing OS measurements in many
378
physiological contexts, so no direct calibration with a “gold standard technique” is possible. Instead, the
379
field has to rely on indirect qualitative validation provided by comparison to controls, and by OS –
380
altering interventions to provide context for multispectral oximetry results, and build a case for
381
convincing oximetry measurements from context.
382
3.Challenges for in vivo multispectral imaging oximetry
383
3.1.Optical absorption by haemoglobin variants and blood plasma 384
For understanding errors and uncertainties in oximetry, it is useful to consider the optical properties of
385
blood constituents, other than haemoglobin (Hb), which may absorb or scatter light, and how these may
386
alter the optical transmission of blood vessels. For example, variant globin proteins, blood plasma, and
387
cells within blood.
388
Haemoglobin has two main variants, namely methemoglobin (MetHb), where the iron in heme groups
389
is Fe3+ instead of Fe2+, and carboxyhemoglobin (CoHb), where carbon monoxide is bound to
390
haemoglobin. If present in the blood, MetHb and CoHb can contribute spectral absorption that is similar
391
to normal Hb.[66–68] However, the concentration MetHb and CoHb are normally present only at low
392
concentrations in blood and are thus generally ignored for oximetry.[68] Another molecule similar to
393
Hb is neuroglobin, which supplies oxygen to nervous tissue, such as the brain and retina.[69] However,
15
15
the extent to which neuroglobin can be found in the blood is currently unclear.[70–72] Other proteins
395
similar to Hb can sometimes be found in the blood. For example, myoglobin (Mb) – a protein which
396
supplies oxygen to muscle tissue - can be found in blood when a subject has undergone skeletal or
397
cardiac muscle damage, e.g. due to a heart attack or traumatic injury.[73,74] The absorption spectra of
398
Mb is broadly similar to Hb, but with weaker optical absorption because Mb contains only a single heme
399
group compared to the four heme groups of Hb.[75] Mb is not considered in MSI oximetry, even in
400
experiments that may cause muscle damage.
401
White blood cells account for <1% of whole blood volume, but do not contribute significant absorption
402
or scattering,[76] and are not considered in oximetry. However, blood plasma is ~55% of the total
403
volume of human blood, and contains many proteins which can absorb and scatter light.[77] When
404
isolated from whole blood, blood plasma has a pale-yellow coloration due to strong absorption by serum
405
albumin at wavelengths < 550 nm. Additionally, blood plasma auto-fluoresces under ultraviolet and blue
406
light exposure, [78] which could potential induce errors in oximetry (see Section 3.4 for more on
auto-407
fluorescence). However, to the best of our knowledge, no oximetry studies to date have incorporated the
408
optical parameters of blood plasma.
409
3.2.Pigmentation within tissue 410
Melanin is the main pigment chromophore** of concern for oximetry. Melanin strongly absorbs blue and 411
green light, with red light less strongly absorbed.[79] If present in high concentration, absorption by
412
melanin may be sufficient to make meaningful MSI oximetry challenging. Melanin is particularly
413
abundant in the skin and retina, and as such, is particularly relevant for oximetry of blood vessels in
414
these tissue beds. Retinal melanin can be quantified via the proxy of assessment of iris coloration;
415
subjects with low retinal melanin tend to have blue iris coloration, whereas subjects with a high degree
416
of retinal melanin tend to display brown iris coloration.[80]
417
The non-uniform distribution of melanin in retinal tissues introduces considerable variability in the
418
reflectivity of background for blood vessels, compromising oximetry measurements. For this reason,
419
Hammer et al., (2008) introduced an empirically derived calibration factor to account for the effect of
420
retinal melanin pigmentation in two-wavelength oximetry.[29] In subjects with minimal retinal melanin
421
pigmentation, the retinal tissue is so transparent that the blood vessels of the choroid – at the back of the
422
retina - can be directly studied by MSI oximetry.[14]
423
Other chromophores such as adipose fat and yellow pigment could affect the spectra of tissue at visible
424
wavebands, but the influence of such pigments is not normally accounted for in oximetry. Absorption
425
by water is not typically a concern for oximetry, because water only strongly absorbs light at >1000 nm,
426
which is beyond the waverange of 400 – 800 nm typically used for oximetry. A thorough review on
427
absorption and scattering properties of these miscellaneous tissue chromophores is provided by Jacques
428
et al., (2013).[79]
429 430
3.3.Optical scattering by tissue 431
Optical scattering by tissue is due to inhomogeneities in the refractive index of the tissue, e.g. cells or
432
blood vessel walls. Consequently, such scattering is well-described by Mie scattering theory, where the
433
scattering structures are similar dimension to the wavelength of light being scattered. Unlike Rayleigh
434
** A chromophore is a molecule that absorbs visible light, responsible for the characteristic colour of a substance when viewed with the eye.
16
16
scattering, Mie scattering does not strongly vary with wavelength, but becomes more important when
435
absorption is reduced, e.g. at red and near-infra red wavelengths. The scattering properties of the
436
skin,[81–83] the retina,[84,85] the sclera,[86] and blood[87] are well characterised.
437 438
Optical scattering by overlying tissue can alter the transmission of blood vessels.[7] For example, in the 439
highly scattering tissue of the choroid scattering results in blood vessel appearing to be brighter than the 440
surrounding tissue, producing a negative OD. This is particularly apparent when the reflectivity of 441
surrounding tissue is low. In such situations, two-wavelength oximetry calibration is not applicable, but 442
nevertheless indications of relative OS may instead be reported in terms of ODR.[14] The best example 443
of this phenomenon has been reported by Kristjansdottir et al., (2013).[14] 444
Although generally unavoidable, scattering by skin tissue can be reduced by the application of optical
445
clearing substances, which match the refractive index of inhomogeneities within tissue, thus reducing
446
scattering. Optical clearing agents are typically used to reduce scattering in skin to provide deeper and
447
clearer optical imaging, however, they may alter various tissue properties may require invasive
448
injections for maximum effectiveness.[88,89] Hence, optical clearing agents are not commonly used in
449
oximetry experiments.
450 451
3.4.Other challenges of imaging through tissue
452
Aside from absorption by chromophores and optical scattering, there are other challenges associated 453
with imaging blood vessels through tissue, including limited depth penetration of light, tissue-specific 454
wavelength filtering effects, polarization dependent effects, tissue geometry, and tissue auto-455
fluorescence. 456
457
The penetration depth of light in tissue is highly variable, with blue and green wavelengths generally 458
limited to a penetration depth of < 2 mm due to strong absorption and scattering.[90,91] However, 459
wavelengths between 600-1000 nm can pass further through tissue due to reduced absorption at these 460
wavelengths, enabling applications such as pulse oximetry. This waveband is sometimes referred to as 461
“the biological window”. Photoacoustic imaging techniques get around this limit by combining optical 462
excitation with ultrasonic detection (see Section 6.4). 463
464
Specific tissue may also have associated wavelength-filtering effects: for example, the lens within the 465
human eye acts an ultraviolet filter, with the transparency of the lens decreasing across all wavelengths 466
with age.[92] Cataracts can also influence oximetry measurement by effectively applying a spectral-467
filter function over images, consequently altering ODR of blood vessels imaged within the eye.[93,94] 468
469
Tissues may also exhibit birefringence, caused by parallel strands of fibrous tissue. In the eye, the sclera, 470
the cornea, and the retinal nerve fibre layer are generally birefringent.[95–98] Birefringence is 471
particularly important for studies utilising orthogonally polarised illumination to mitigate reflections 472
(see Section 3.7) because birefringence can result in uneven tissue reflectivity that can cause challenges 473
for oximetry. 474
475
Defocus due to tissue curvature or bulk motion can significantly reduce the apparent contrast of blood 476
vessels with respect to other features. Defocus due to tissue curvature is a particular challenge for both 477
endoscopic and ocular imaging. To minimise defocus, retinal oximetry studies typically limit 478
measurements to a well-defined, well-constrained region near the optic disc[99]; when imaging the 479
surface of the eye, (the sclera), maximising the depth of field is a good strategy for minimising any 480
potential defocus.[100] 481
17
17 Some tissues may exhibit auto-fluorescence when illuminated with the appropriately exciting 483
wavelengths (typically ultraviolet or blue light). For example, proteins within blood plasma will strongly 484
auto-fluoresce under blue illumination (e.g. ~400 nm), and emit at longer wavelengths (e.g. ~500 485
nm),[78] and auto-fluorescence of retinal tissue (excitation ~ 470 nm, emission at ~600 nm) is strong 486
enough to be utilized as a retinal imaging modality in its own right.[101] To date, auto-fluorescence has 487
not yet been considered as a source of potential errors in oximetry, but nevertheless it is prudent to be 488
wary of, and minimise, any tissue auto-fluorescence in oximetry experiments. 489
3.5.Scattering by blood 490
3.5.1.General considerations 491
Optical scattering by blood should be considered when interpreting transmission of blood vessels for
492
oximetry. In blood, light is predominately Mie scattered by individual red blood cells (RBCs) which
493
make up approximately 44% of blood volume, and which are each ~6 – 8 µm in diameter with a concave
494
shape (see Figure 4).[77] Proteins in blood plasma also contribute Rayleigh scattering effects, but the
495
magnitude of this scattering is 100-1000 times less than scattering from RBCs.[77] The scattering
496
properties of blood can alter due to several factors, including: changes in OS,[102] change in % of RBCs
497
by volume (the haematocrit),[103] changes in overall blood volume (e.g. due to water drinking),[104]
498
and changes in blood flow rate.[64,105]
499 500
The quantitative parameters that describe the scattering of light by blood are the absorption coefficient 501
( 𝜇𝑎) [units: cm-1M-1]; the scattering coefficient (𝜇𝑠) [units: cm-1]; the anisotropy factor (𝑔)
502
[dimensionless]; and the effective scattering coefficient: 𝜇′𝑠 = 𝜇𝑠(1– 𝑔) [units: cm-1].[77] The
503
anisotropy factor is defined as: 𝑔 = 𝑐𝑜𝑠(𝜃), where 𝜃 is the typical angle at which incident light is 504
deflected by a scattering event. 𝑔 = 0 indicates no forward scattering, and 𝑔 = 1 indicates complete 505
forward-scattering. For whole blood, 𝑔 has been estimated to be ~ 0.985 - 0.997, i.e. highly forward-506
scattering.[57] 507
508
Figure 4. Depiction of red blood cells showing their biconcave shape. Figure reproduced from the public
domain.[106]
3.5.2.The influence of oxygen saturation on optical scattering by blood 509
OS plays a role in determining the optical scattering properties of blood by mediating the transmission
510
of blood. Monte Carlo simulations by Friebel et al., (2009) demonstrated that an increase in 𝜀𝜆 will
511
decrease 𝑔. Thus, if a change in OS results in a decreases in the optical transmission of blood, then the
18
18
degree of forward scattering through blood will also decrease, resulting in a further decrease in
513
transmission, not described by the Beer-Lambert law.[102]
514
3.5.3.The influence of blood flow speed on scattering and reflection by blood 515
The orientation of RBCs within flowing blood is dependent on blood flow velocity: if blood is static or 516
flowing very slowly, then RBCs will be randomly orientated, and biconcave in shape. However, if blood 517
is flowing, then RBCs will preferentially align with the flow, and elongate in the direction of flow due 518
to shear stress (see Figure 5).[107] This alignment consequently alters the optical properties of blood, 519
particularly backscattering. Klose et al., (1972) demonstrated that preferential alignment of RBCs under 520
flow results in an increase of backscattered light from blood vessels.[105] Schweitzer et al., (1999) 521
demonstrated that once all RBCs are orientated in the same direction, then the back-scattered light would 522
reach a maximum. For a 50 µM diameter blood vessel, this critical flow speed corresponding to complete 523
preferential alignment was found, empirically, to be 6.4 mm/s.[64] Thus, it is important that blood flow 524
speed is considered in oximetry experiments because blood at low, moderate, and critical flow rates will 525
have different optical back-scattering properties. Back-scattering from blood can produce specular 526
reflections, which can introduce errors into oximetry (see Section 3.6). 527
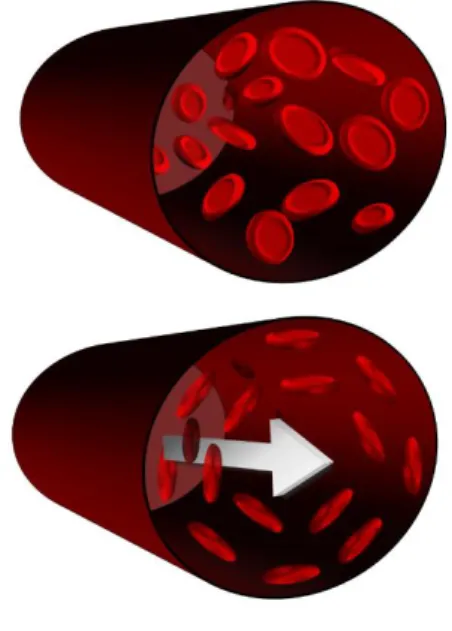
528
Figure 5. Depiction of the preferential alignment of red blood cells under flow due to shear stress. Top: no flow. Bottom: under flow. A more detailed depictions of this phenomenon can be found in Cimalla et al., (2011).[107] Note, this depiction describes a relatively large blood vessel (e.g. 100- 200 µm diameter), and is not valid in capillaries (<10 µm in diameter) were red blood cells elastically deform to flow through capillaries.[108]
3.6.Mitigating specular reflections from blood vessels 529
Illumination light can create a bright specular reflection from a blood vessel, typically manifesting in
530
the centre of a vessel. Such specular reflections can introduce errors in the estimation of transmission of
531
a blood vessel and thus induce errors in MSI oximetry (see Figure 6). There are several methods for 532
mitigating specular reflections. One strategy is to use off-axis illumination of blood vessels, thus moving
533
the position of specular reflections to a less intrusive angle. However, off-axis illumination creates
534
shadowing effects and is impractical for many in vivo applications, such as retinal imaging, where
off-535
axis imaging requires invasive procedures.[109] Another, simpler, approach is to modify blood vessel 536
19
19 transmission-measurement algorithms to compensate for reflections. With this approach, the potential 537
for systematic errors should be carefully considered. Alternatively, annular illumination can be 538
employed to back-illuminate blood vessels via diffuse scattering via surrounding tissue; totally 539
eliminating specular reflection from the blood vessel.[110] 540
Perhaps the most elegant approach to mitigate specular reflections is to use orthogonal polarisation
541
imaging (OPI). In OPI the illumination light is linearly polarised, but becomes depolarized when it
542
undergoes multiple scattering by tissue. In contrast, specularly reflected light, does not lose its
543
polarisation because it does not undergo multiple scattering. Thus, by placing a linear polariser in the
544
imaging path, with polarisation axis orientated orthogonally to the polarisation axis of the illumination
545
light, specular reflections can be completely mitigated, whilst light that has undergone multiple
546
scattering by tissue is imaged.[111]
547 548 549 550
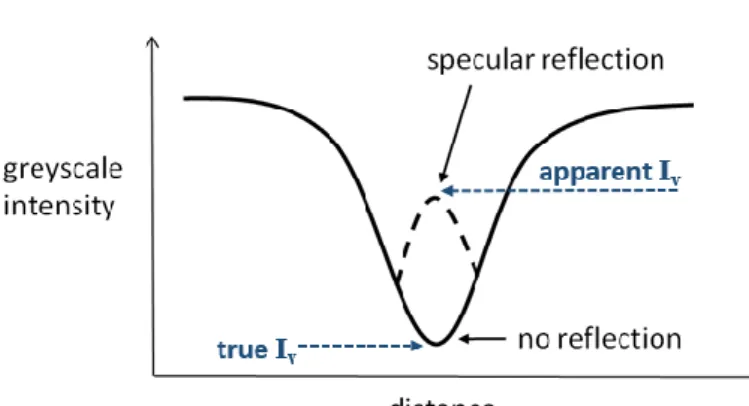
Figure 6. An ideal blood vessel intensity-profile cross section, with and without specular reflection. Specular reflections increase the apparent intensity (Iv) in the centre of a blood vessel.
3.7.Optical paths through blood vessels 551
Light does not simply follow a single path through blood vessels; scattering, reflection, absorption all
552
play a role in determining the path of individual photons through blood. Scattering is described in terms
553
of scattering probabilities, with the outcome of each event determined in a pseudo-random manner.
554
Hence, Monte Carlo simulations are a useful method for investigating light paths through blood vessels
555
because they simulate many individual photons propagating through blood. Predictions by Monte Carlo
556
models can be compared to experimental data to assess optical models or to test predictions of
557
parameters, e.g. the scattering anisotropy factor of blood, g (see Section 3.5.1).
558
Hammer et al., (2001) [112] used Monte Carlo simulations to investigate different light paths through
559
blood vessels when the blood vessels were illuminated by retinal fundus cameras and scanning laser
560
opthalmoscopes (SLOs). Simulations were conducted for light in the waveband 520 -586 nm and
561
investigated model blood vessels 25 – 200 µm in diameter. Examples of the light paths through blood
562
vessels simulated in this study are shown in Figure 7. They found that back-scattered and single-pass
563
transmitted light dominates for both fundus cameras and SLOs. However, compared to fundus cameras,
564
SLOs have a higher degree of backscattered light, with relatively larger double pass transmission
565
contribution.[112]
20
20
Rodmell et al., (2014)[110] conducted Monte Carlo simulations to investigate if vessels can be diffusely
567
illuminated by illuminating nearby tissue, instead of directly illuminating blood vessels, e.g. by using a
568
confocal SLO illumination scheme. Their study concluded that if the tissue surrounding a vessel is
569
illuminated, then the vessel will be effectively back-illuminated.[110] This finding has subsequently
570
been used to simplify multispectral oximetry models by enabling the use of annular illumination to
571
eliminate double-pass contributions in MSI oximetry models.[9,70]
572 573
574
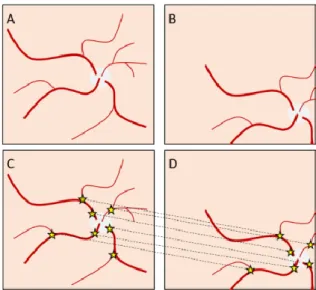
Figure 7. Potential light paths through a blood vessel. (A) specular reflection. (B) backscattered. (C) 575
double pass. (D) Single-pass (back illuminated).[112] 576
3.8.Rattlesnake artefacts 577
A common artefact in oximetry is “rattlesnaking”, where estimated OS spuriously varies along the
578
length of a blood vessel, causing a stripey, “rattlesnake” pattern to appear when OS is visualized as a
579
colour-coded map (see Figure 8). Spurious variations in estimated blood vessel transmission can arise 580
due to a number of reasons, including variations in red blood cell concentration, optical scattering,
581
background pigmentation, and vessel-fitting errors. To minimize the adverse effects of rattlesnaking,
582
OS is often averaged along the length of a blood vessel or vessel segment to reduce random variations
583
in OS prior to further analysis.
584
585
Figure 8. Two-wavelength retinal oximetry images of a healthy subject (left) and a subject with chronic 586
obstructive pulmonary disorder (right). Rattlesnaking artefacts are apparent in both subjects. Figure 587
reproduced from Eliasdottir et al., (2017) under a Creative Commons BY 4.0 licence.[113] 588
3.9.Oxygen diffusion 589
21
21
Oxygen diffusion has recently emerged as both a challenge and a tool for oximetry of blood vessels
591
exposed to ambient air, e.g. in bulbar conjunctival and tendon oximetry.[10,15] Oxygen will naturally
592
move from regions of high partial pressure of oxygen (pO2) (e.g. the air) to areas of lower pO2 (e.g.
593
exposed blood vessels), until a pO2 equilibrium is reached. This will raise the OS of blood. Nominal pO2
594
of blood is ~ 100 mmHg and ~ 40 mmHg for arteries and veins respectively, whereas nominal pO2 of
595
air at sea level is much higher, at ~160 mmHg.[27] Therefore, if blood reaches equilibrium with ambient
596
air, then the OS of blood will be close to 100%. The rate of oxygen diffusion for air to blood is described
597
by Fick’s law of diffusion, which incorporates two main factors: the pO2 gradient, and the oxygen
598
diffusivity of any tissue between the air and the blood. The oxygen diffusivity of tissue depends on tissue
599
thickness and composition.[114–117]
600
Oxygen diffusion will occur when blood vessels are exposed to the ambient air. Foe example. in the first
601
MSI oximetry study of the bulbar conjunctival microvasculature (located on the surface of the eye),
602
MacKenzie et al., (2016)[15] observed rapid oxygen diffusion from ambient air into hypoxic bulbar
603
conjunctival microvessels when the eyelid was open. This oxygen diffusion occurred in a timescale of
604
just a few seconds, with 50% of the oxygen diffusion occurring on average in 3.4 ± 1.4 seconds (see
605
Figure 10). Closure of the eyelid created a barrier to oxygen diffusion from ambient air. Due to this
606
oxygen diffusion, it is thought that all bulbar conjunctival vessels will be highly oxygenated when
607
exposed to air after a few seconds.[15]
608
This diffusion oxygenation effect has been exploited by other studies. Sarkar et al., (2017) exploited
609
oxygen diffusion to remove OS as a source of uncertainty in their experiments to non-invasively measure
610
bulbar conjunctival haemoglobin concentration for anemia diagnosis.[118] van der Putten et al.,
611
(2017)[9] utilized reoxygenation by diffusion as an intervention to alter OS and confirm oximetry
612
capability.[9] It has been suggested that oxygen diffusion rates could be investigated as a parameter for
613
the measurement of microvascular function, e.g. to investigate vessel wall thickening due to diabetes,
614
but further research on this matter is required.[15]
615
Oxygen diffusion is a concern in studies where blood vessels are surgically exposed, because oxygen
616
diffusion can spuriously increase blood OS. A test for ongoing oxygen diffusion into surgically exposed
617
venules was reported by van der Putten et al., (2017)[7] They reasoned that if oxygen diffusion was
618
occurring, then blood would become more oxygenated as it flowed down the length of a vein. In their
619
particular case, van der Putten et al. did not observe an OS gradient along the length of veins examined.
620
indicating no significant oxygen diffusion into these veins.[7]
621
In the retina, oxygen diffusion is not a concern, because retinal blood vessels are shielded from air by
622
the tissue of the eye. However, the potential effects of oxygen diffusion should be carefully considered
623
in any oximetry application where blood vessels may be exposed to air. For example, if invasive
624
intravitreal retinal illumination is used, then diffusion may cause spurious changes in OS.[109]
![Figure created from spectroscopic data tabulated by S. Prahl (1999).[30] The units for extinction coefficient are per centimetre per mole (cm -1 M -1 ).](https://thumb-us.123doks.com/thumbv2/123dok_us/1311348.2675367/6.892.224.654.187.483/figure-created-spectroscopic-tabulated-prahl-extinction-coefficient-centimetre.webp)
![Figure 4. Depiction of red blood cells showing their biconcave shape. Figure reproduced from the public domain.[106]](https://thumb-us.123doks.com/thumbv2/123dok_us/1311348.2675367/18.892.294.732.576.915/figure-depiction-showing-biconcave-figure-reproduced-public-domain.webp)