저작자표시-비영리-변경금지 2.0 대한민국 이용자는 아래의 조건을 따르는 경우에 한하여 자유롭게 l 이 저작물을 복제, 배포, 전송, 전시, 공연 및 방송할 수 있습니다. 다음과 같은 조건을 따라야 합니다: l 귀하는, 이 저작물의 재이용이나 배포의 경우, 이 저작물에 적용된 이용허락조건 을 명확하게 나타내어야 합니다. l 저작권자로부터 별도의 허가를 받으면 이러한 조건들은 적용되지 않습니다. 저작권법에 따른 이용자의 권리는 위의 내용에 의하여 영향을 받지 않습니다. 이것은 이용허락규약(Legal Code)을 이해하기 쉽게 요약한 것입니다. Disclaimer 저작자표시. 귀하는 원저작자를 표시하여야 합니다. 비영리. 귀하는 이 저작물을 영리 목적으로 이용할 수 없습니다. 변경금지. 귀하는 이 저작물을 개작, 변형 또는 가공할 수 없습니다.
Doctoral Thesis
Multi-Biosignal Sensing Interface with Direct
Sleep-Stage Classification
Sung-Woo Kim
Department of Electrical Engineering
Graduate School of UNIST
2020
Multi-Biosignal Sensing Interface with Direct
Sleep-Stage Classification
Sung-Woo Kim
Department of Electrical Engineering
Abstract
Sleep is a time of mental and physical rest in a person’s daily cycle. It is an indispensable metabolic activity that helps the body grow and boosts immunity. Therefore, sleep disorders can cause illness in the body as well as just physical condition. Among these diseases are typically included rapid eye movement (REM) sleep behavior disorder, nocturnal enuresis, sleepwalking, etc., which can cause serious injury on sleep.
Sleep disorders are a common disease. According to a survey, sleep deprivation and disability affect a significant part of the world’s population. It is a disease that affects tens of millions of people around the world. In general, treatment for sleep disorders checks the quality during sleep and prescribes various sleep diseases by checking the condition of sleep. Sleep quality and sleep disease are determined by the depth and time of the sleep phase. Therefore, the analysis and classification of the sleep stage are essential. According to the manual of the American Academy of Sleep Medicine (AASM), sleep stages are divided into five stages.
Various methods for sleep analysis have been developed. Polysomnography (PSG), called the golden standard, is the most reliable measurement of sleep quality in hospitals for sleep disorders, but this conventional method requires the use of various human body signals, and it is difficult to access due to the complex interface and various electrodes. It is not economical because of its infrastructure, which does not lead to direct treatment of prospective patients. In addition, the conventional interface system process is not an integrated interface system. The integrated interface system refers to the integration of the interface in the measuring and analysis process. Conventional sensing and analysis take place on the instrument measuring the patient and on the analyst’s computer. Therefore, conventional treatments are not economical and make patient self-analysis difficult. Furthermore, this makes it difficult to increase the demand for prospective patients.
This paper presents a multi-biosignal sensing interface system with direct sleep-stage classification. Unlike conventional systems, this work proposes an interface system that is an integrated interface system, measuring, and analysis based on the analog circuit and system. The proposed paper configures a biosignal sensing interface consisting of single-channel EEG, EMG, and 2EoG. The multi-biosignal sensing readout integrated circuit (ROIC) collects analog signals from the electrodes and extracts features from the signal. The multi-biosignal sensing ROIC has a feature extraction stage that directly extracts the characteristic of sleep stages. The analog feature extraction stage consists of the optimized circuit for three multi-biosignal extracts the feature of each stage during sleep on the waveform. The extracted signal is scored by the rule-based decision tree sleep stage proposed by the micro controller unit (MCU). The multi-biosignal sensing ROIC can analyze the sleep stage through
EEG, EMG, and 2EOG, and can simultaneously analyze four channels. The multi-biosignal sensing ROIC is implemented using a compensate metal-oxide-semiconductor 0.18um process. In addition, this system implements a low-power, integrated module for portable device configuration, and from this interface makes a smart headband for prospective patients. Depending on the purpose of use, it consists of 2 type paths, including raw data recording and analog feature extraction based direct sleep classification using decision tree algorithm. Finally, sleep stage scoring can be displayed, or raw data can be sent to the personal computer interface to increase accuracy.
The sleep stage was verified by comparing the OpenBCI module-based MATLAB analysis using SVM with this system, and the result shows an overall accuracy of 74% for four sleep stages.
Keywords: sleep-classification, multi-biosignal interface, rule-based decision tree, feature extraction stage, headband, wearable device
Contents
I. Introduction ……….……… 1
1.1 Sleep disorder, a rapidly growing field ……….. 2
1.2 Conventional sleep diagnostic tool and currently studies ……….. 4
1.3 Conventional sleep analysis process and direction for improvement ……… 6
II. Background ……….………..………….. 7
2.1 Sleep stages and classification ……… 8
2.2 Electrode placement for multi-biosignal ……….. 14
2.3 Introduce a problem of sleep analysis of conventional PSG ………. 16
2.4 The problem with commercial product for sleep analysis ……… 17
III. Previous work ……….………... 19
3.1 A skin-inspired sensor interface using customized analog circuit and system……….…. 20
IV. Implementation of multi-biosignal sensing interface with ROIC ……….……… 33
4.1 Multi-biosignal sensing system for sleep analysis ……… 34
4.2 Proposed multi-Biosignal sensing ROIC ……….………. 39
V. Experimental results ……….………. 54
5.1 Evaluation of the EEG analysis using sleep dataset ………. 55
5.2 Sleep scoring using a rule-based decision tree algorithm ……….… 60
List of Figures
Fig. 1.
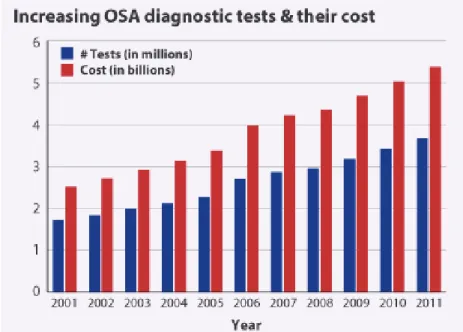
Increasing Cost of Sleep Disorder Treatment.
Fig. 2.
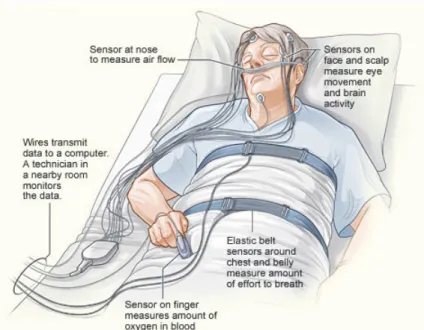
Polysomnography test for sleep disorder.
Fig. 3.
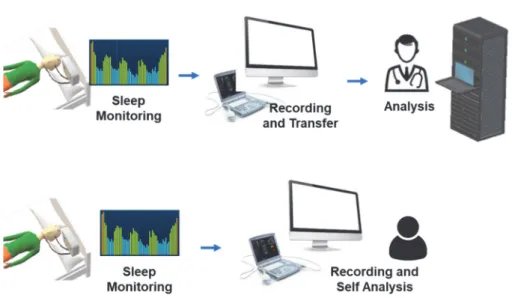
Conventional sleep analysis process and proposed process.
Fig. 4.
Repeated cycle of Sleep stages.
Fig. 5.
In wakefulness, (a) EEG (beta wave) (b) relaxed wakefulness EOG.
Fig. 6.
In sleep stage1, (a) EEG (alpha wave) (b) sinusoidal eye movements.
Fig. 7.
In sleep stage2, (a) EEG (alpha wave with sleep spindle) (b) sinusoidal eye
movements.
Fig. 8.
In sleep stage3, (a) EEG (delta wave) (b) slow eye movement.
Fig. 9.
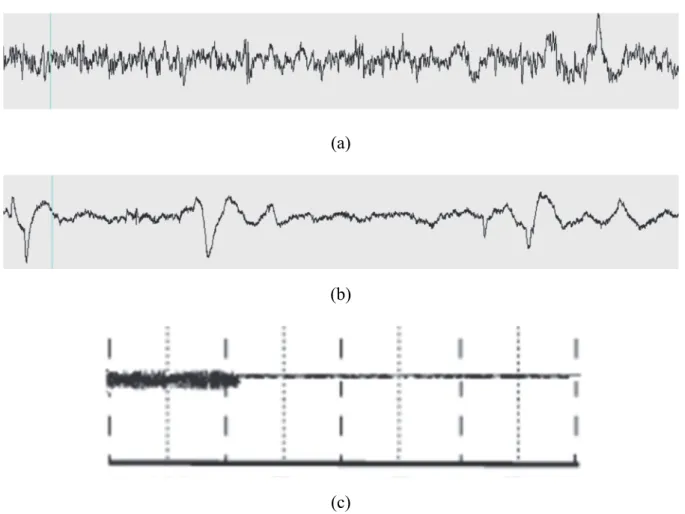
In REM sleep, (a) EEG (alpha) (b) rapid eye movement (c) EMG amplitude tone.
Fig. 10.
10-20 system of electrode placements.
Fig. 11.
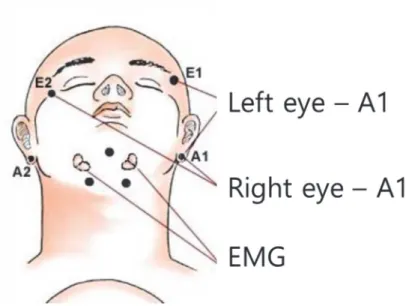
Electrode placement for EOG and EMG.
Fig. 12.
Conventional signal process of PSG.
Fig. 13.
Commercial product of wearable heathcare device for sleep analysis (a) Sleep
profiler (b) Smartsleep (c) Fitbit one/flex.
Fig. 14.
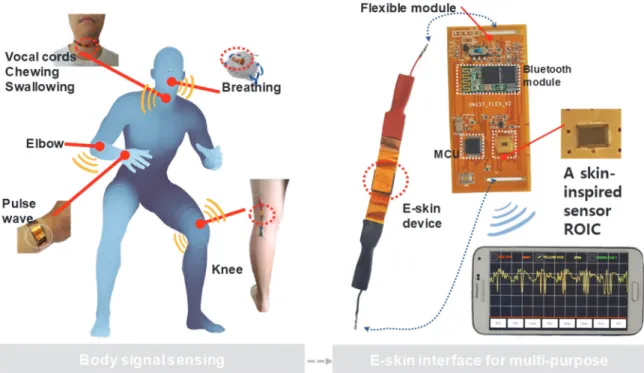
A skin-inspired sensor electronic system.
Fig. 15.
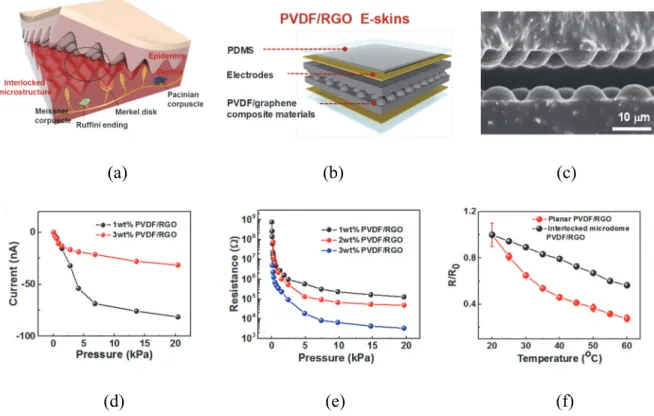
Human fingertip and electrical characteristic of e-skin device: (a) structure of
human fingertip (b) Inspired e-skin device from fingertip skin; (c) micrograph of
e-skin device (d) piezoelectric characteristic (e) piezoresistive characteristic (f)
pyroresistive characteristic.
Fig. 16.
Block diagram of a skin-inspired sensor ROIC.
Fig. 17.
Detailed circuit operation of R mode for static pressures: (a) active path when CK
is on state; (b) active path when CKB on state; (c) linearization process; and (d)
transient node voltages.
Fig. 19.
Sensor readout characteristics after three type mode signal process: (a) R mode
(b) E mode (c) HR mode.
Fig. 20.
Flexible E-skin sensor module with ROIC.
Fig. 21.
Proposed multi-biosignal sensing interface process for sleep analysis.
Fig. 22.
Overview Multi Bio Signal Sensing Interface Systems for Sleep Monitoring (a)
Electrode placement (b) smarthead band (c) Module.
Fig. 23.
Overview Multi-BioSignal Sensing Interface Systems for Sleep Monitoring (a)
Block diagram (b) Module (c) PSG Analyzer with patch.
Fig. 24.
A micrograph of the multi-biosignal sensing ROIC.
Fig. 25.
Schematic of preamplification stage including LNA and PGA.
Fig. 26.
Characteristics of PGA for multi-bio signals.
Fig. 27.
(a)
TEO operator in Feature extraction Block diagram with graph
(b)
Signal level
detector for EMG in Feature extraction Block diagram with graph
(c)
Signal peak
detector in Feature extraction Block diagram with graph.
Fig. 28.
DATA interface with serial data format.
Fig. 29.
Diagram of the proposed decision tree.
Fig. 30.
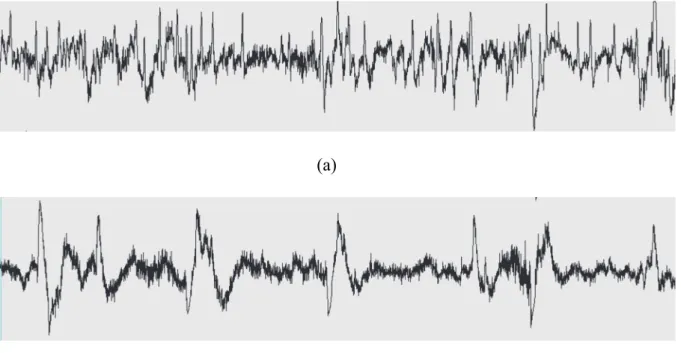
Validation test by sleep dataset (a) shallow stage signal (b) Deep stage signal.
Fig. 31.
Comparative test environment of Openbci and Smart-headband.
Fig. 32.
Measurements of the feature extraction for a 800 epoch (6h 40m) (a) Plot of EEG
feature extraction data (b) Plot of EOG feature extraction data (c) Plot of EMG
feature extraction data.
Fig. 33.
Comparison of the sleep scoring with proposed work and OpenBCI.
Table. I.
The characteristics of each sleep stage
Table. II.
Confusion matrices for processing sleep stages with the multi-biosignal interface
using dataset
Nomenclature
AASM
America academy sleep medicineDS
deep sleepEEG
electroencephalographyEMG
electromyographyEOG
electrooculographyE-skin
electrical skinFPCB
flexible printed circuit boardHR mode
high-resistive modeLNA
low noise amplifierMCU
micro control unitNREM
non rapid eye movementPSG
polysomnographyPSD
power spectral densityPVDF/RGO
polyvinylidene fluoride and reduced graphene oxidePGA
programmerble gain amplifierREM
rapid eye movementROIC
readout integrated circuitR mode
resistive modeR-DAC
resistive digital to analog converterSTFT
short fourier transformSEM
sinusoidal eye movementSS
shallow sleepSPI
serial peripheral interface1
Chapter I
2
1.1
Sleep disorder, a rapidly growing field
Sleep is a time of mental and physical rest in a person's daily cycle. It is an indispensable metabolic activity that helps the body grow and boosts immunity. Therefore, sleep disorders can cause illness in the body as well as just physical condition. [1] Among these diseases, there are typically sleep behavior disorder in rapid eye movement (REM) period, apnea, sleepwalking, etc., which can cause serious injury on sleep [2]. Sleep disorders are a common disease.
There are Several reasons the increasing population of sleep disease. According to a survey, the number of people killed in car accident is double to 2.3 millon global, of which 230,000-345,000 will be expected to sleepiness or fatigue [3]. Epidemiology of population show that [4] sleep deprivation and disability are a significant part of the world's population, with 30% of adults who have insomnia. And the prevalence of obstructive sleep apnea is 9 to 21%, and males are estimated to be 24-31%. This phenomenon can also be seen in the biorhythms of the irregular modern population.
In Fig. 1 shows 2011 statistics, about $ 5.4 billion was spent on the treatment of sleep disorders. If self-diagnosis can be used to treat sleep disorders, it will be a cost effective and effective solution.
3
4
1.2
Conventional sleep diagnostic tool and currently studies
Treatments of sleep disorder have examined in a variety of ways. In general, it checks the quality during sleep and prescribes various sleep diseases by checking the condition of sleep. Currently, sleep analyzing is classified by measuring sleep cycles based on multiple signals using the polysomnography (PSG), which is the golden standard, as shown in Fig. 2. PSG measures wake, REM, and non-REM (NREM) consisting of three stages. For sleep quality test using PSG, five or more signal detections including electroencephalography (EEG), electrooculography (EOG), electromyography (EMG), heart rate, and other signals are performed. And for the various signals, the electrode bundle should be attached to the body during the test [5]. Therefore, PSG can analyze and diagnose with high accuracy. But not only the inspection process is complicated and difficult, but also a physician and nurses must be stationed. There is a burden of having to be admitted to the hospital. As a result, the sleep analysis is challenging to access for treatment of sleep diseases. For this reason, research is being conducted on a health care device for detecting the sleep stage and sleep quality of the examinee at home [6].
5
The common point of health care devices for sleep analysis is that they are handheld [7], so they can be carried and can be measured at home. Besides, it was designed to be applied to IoT interfaces and moved away from storing data in existing optical and semiconductor storage devices. And a new approach helps ease convenience for subjects [8]. However, they were only used in partial sleep analysis and simple body condition checks such as heart rate, and pedometer. Also, the main functions of the mentioned healthcare devices are limited to the role of data collection.
Today, sleep management healthcare devices are emerging that are more accurate than existing devices and provide a user-centric interface [9,10], which offers an intuitive solution using smartphones. This means that the patient can quickly check the sleep state. Sleep profiler [9] created by omitting PSG is easy to extract professional sleep data including signal detection and data collection in the form of PSG. But it does not have its analysis function and provides an indirect solution to users.
Smartsleep [10] provides a smartphone-based user-centric interface that allows easy sleep testing and provides a solution for sleep quality right after sleep. However, it lacks the sensor interface of PSG and has the limited analytical ability. Wearable headband research for dry electrodes [11] is a fairly ideal home sleep analysis tool, but also does not have its own sleep analysis. This provides an indirect environment for the subject.
In the health-care device research for sleep apnea patients [12], analytical systems [13] with their own algorithms are being studied.
Overall, healthcare devices need to as follow for the sleep assessment. 1. A Sleep analysis system for the Healthcare device itself
2. Implement a customized PSG interface for wearable devices.
This is a necessary list for self-diagnosis, and especially the direct analysis system is insufficient in the sleep classification of healthcare device research. The proposed study met the above items and presented an algorithm for them.
6
1.3
Conventional sleep analysis process and direction for improvement
Fig. 3(a) shows a conventional sleep monitoring procedure, and Fig. 3(b) describes a sleep stage simplification. The conventional process has a device configuration that can be carried out by person. But it still only does serve as a recording device using PSG interface configuration. so, this proposed research can analyze sleep analyze itself. It serves as a multi-biosignal sensing interface system that analyzes and provides classification through EEG, EMG, and EOG signals. It was designed to support sleep state monitoring and sleep stage analysis selectively.
In Chapter 2, it is introducing the background and previous work before the multi-biosignal sensing interface. Section III presents multi-biosignal sensing interface systems and read-out integrated circuit (ROIC) including preamplification and feature extraction on circuit level implementation. Finally, Chapter 4 shows the experimental result. Finally, conclusions are drawn in Chapter 5.
7
Chapter II
Background
8
2.1 Sleep stages and classification
The stage of sleep consists of research, which consists of shallow, deep and REM sleep. They found that cerebral activity is relatively active but distinguished from a coma that is not aroused by stimulation. In particularly, deep sleep and REM stage play a role in physical and mental health. In practice, these three rules are divided into five-sleep stages by the America academy sleep medicine (AASM) [5].
The five-sleep stage mentioned above is characterized by various body signals in each sleep stage. Among them, electroencephalography (EEG), electromyography (EMG), and electrooculography (EOG) are important indicators for determining sleep stages, and their characteristics differ from each sleep stage. Based on the extracted features of sleep stage, sleep stages can be classified, and the human body's sleep state can be analyzed.
9
2.1.1 Wakefulness
In wakefulness stage, it come up before and throughout the various sleep stages. Wakefulness stage is the period if brain wave frequency is at beta wave and muscle tone has high amplitude tone. The EOG signal has a large amplitude due to the blinking of the eye, and the frequency shows a frequency below 2 Hz. Wakefulness is mainly determined based on eye movements and muscle signals of the chin.
(a)
(b)
10
2.1.2 Sleep stage I
The sleep stage1 of the sleep stage is a transition stage which the body and brain shift from a wakefulness stage to Sleep stage2. This stage is short under 5 percent of whole sleep. People may wake up from this stage of sleep more easily than from other stages. In stage 1, the body signals start to slow. The heart rate and breathing rate slow down, and the eyes movement begin to relax. EOG signal shows the sinusoidal eye movement as shown Fig. 6(b). The muscles also relax but may occasionally twitch. The EEG is to be slow down as brain activity as alpha waves.
(a)
(b)
11
2.1.3 Sleep stage II
The second stage of NREM sleep is another lighter stage of sleep. In the body, the heart rate and breathing rate slow down even more than stage 1. The muscles relax further, and eye movements slow as if it stops. The body temperature also goes down. Although the brain waves slow down further, this stage also includes small bursts of electrical signals in the brain as sleep spindle which is 11 to 16 Hz and K-complex which is A well-delineated, negative, sharp wave immediately followed by a positive component standing out from the EEG as shown Fig. 7(a).
(a)
(b)
Fig. 7. In sleep stage2, (a) EEG (alpha wave with sleep spindle)
(b) sinusoidal eye movements.
12
2.1.4 Sleep stage III
The third stage, Deep sleep, and known as “slow-wave sleep,” helps to relieve fatigue from daytime activities. Firstly, body signal, the breathing rate and heart rate are lowest during the sleep stage. The chin’s muscles and eyes are more relaxed than sleep stage 1 and 2, and the EEG become also slower about 0.5 to 4 Hz, and the amplitude of the EEG is highest during the sleep cycle.
(a)
(b)
13
2.1.5 Rapid eye movement stage
REM sleep is the final stage of the sleep stage. Human body goes into REM sleep about 1hour 30 minute after falling asleep. In REM sleep stage, the eyes dart back and forth behind the closed eyelids. This status is closer to the wakeful state than the other stages of sleep. The frequency of the EOG signal has over 2Hz, it is faster than wakefulness. And an important REM sleep indicator is the tone of the amplitude of the EMG signal. In REM sleep, the chin’s muscles relax muscles called by myatonia as shown Fig. 9(c). Therefore, the activity signal of the muscle is almost flat, which is an important indicator of REM sleep.
In case of EEG, it starts to resemble the EEG of the wakeful state. The heartbeat and breathing rate faster. The REM stage is also when most dreaming occurs. The brain temporarily paralyzes the arms and legs to prevent the body from acting out these dreams.
(a)
(b)
(c)
14
2.2 Electrode placement for multi-biosignal
2.2.1 10-20 system with electrode placement
The 10-20 system with electrode placement is an internationally placement used to present the location of EEG electrodes in PSG sleep study. These EEG electrodes are used to measure the EEG. This method measures the result of the electrical activity on the relationship between the location of an electrode and the brain. The sleep stage of activity changes with the level of a person's sleep depth and arousal. if a human body is in deep sleep in sleeping, at that time the EEG is slow wave. If a human body is in wakefulness, then the EEG has higher frequency.
Each electrode shows with a letter and a number. The letters FP and F refer to frontal pole and frontal. then C and P represent central and parietal. lastly, T and O represent occipital and temporal. Z denotes midline electrode placement sites. sites of Z are electrically ground. The ground electrode is for to balance the differential amplifier.
15
2.2.2 Electrode placement for EOG and EMG
The electrode placement recommended by AASM is was 1 cm above and slightly lateral to the outer canthus of one eye, with a reference electrode on the ipsilateral earlobe or mastoid. The other side EOG channel was to be recorded from an electrode 1 cm below and slightly lateral to the outer canthus of the other eye, referred to as the contralateral ear or mastoid.
In case of EMG, three electrodes are refered by AASM. One centered electrode is 1cm above the edge of the mandible. Other electrodes are placed 2cm below the edge of the mandible. One electrode is 2cm right and the other is 2cm left of the midline.
16
2.3 Introduce a problem of sleep analysis of conventional PSG
After the PSG measurement, biosignals as raw data are transferred to the server and analyzed using power spectral density (PSD) and short term fourier transform (STFT). This analysis process requires a high-end pc interface for PSD, FFT, and STFT. Also, if deep learning based Artificial neural network analysis is combined, even higher specifications are required. Furthermore, the conventional PSG process is divided into two-part, sensor interface and analysis interface based on PC or server as follow Fig. 12. From this reason, the conventional analysis process is not suitable for wearable healthcare devices.
17
2.4. The problem with commercial product for sleep analysis
For measuring and analyzing sleep status, various types of wearable healthcare products have been developed. The products are divided into products that use the existing PSG analysis interface and devices that implement their own sleep analysis.
The sleep profiler is compliant with PSG's interface and detects EEG, heart rate, and EMG. Thus, it has high accuracy, which shows 90% of the performance of the existing PSG. However, this product is inconvenient and expensive to use the existing PSG analysis process. Also, as mentioned earlier, the interface is separated, which makes it impossible to analyze itself.
Devices that can perform their own sleep analysis are the Smartsleep and Fitbit. Both products received sleep data using a smartphone and implemented sleep analysis. Therefore, the user can check his or her sleep status immediately after sleep.
However, both products do not comply with the PSG standard, and the sleep data analysis was analyzed by one biosignal. The Smartsleep performs sleep analysis using EEG signals, and Fitbit implements sleep analysis using only Actigraphy. This shows that it is difficult to control a large amount of sleep data of PSG standard in a wearable device. According to one sleep study, Fitbit loses 70% of its sleep data[14]. Therefore, the reliability of non-PSG wearable devices is not sufficient.
18
Fig. 13. Commercial product of wearable heathcare device for sleep analysis
(a) Sleep profiler (b) Smartsleep (c) Fitbit one/flex.
19
Chapter III
Previous work
20
3.1 A skin-inspired sensor interface using customized analog circuit and systems
The proposed work is a research of sensor interfaces. The shape of the sensor has been changed to an electrode, and the signal is also interpreted from an electrophysiological point of view. Therefore, other areas of research have been the basis for implementing the proposed multi-biosignal sensing interface. Studying the multi-biosignal sensing interface for a signal is not a piece of complete knowledge. It blends in a variety of research fields to create new things. As a multi-biosignal sensing interface is a sensor interface, the previous work's sensor interface has a close influence on this study. Previous works are the study of analog ROIC for sensing resistance-based sensors and sensor interfaces for nonlinear sensors. In order to reduce the power consumption and reduce the chip area for an efficient sensing interface, we designed an ROIC optimized for the target signal. For example, in an electrical skin (e-skin) device, three signals come from one composite. Since three signals have three electrical characteristics, it is necessary to design an optimizer for them. It has the same direction as finding and implementing features at the circuit level, corresponding to the implementation of the optimized signal process for a multi-biosignal sensing interface system.
Chapter 3 shows the circuit design for the optimization of the target signal as the previous work. In chapter 3.1, it presents the development of the sensor interface for an e-skin sensor, which implements to analyze the characteristics of analog signals and implement the circuit accordingly.
21
3.1.1 A skin-inspired sensor interface system
Fig. 14 present A skin-inspired sensor interface system whose three stage are implemented by utilizing polyvinylidene fluoride and reduced graphene oxide (PVDF/RGO) composite structures as electrical skin devices with three electrical characteristics. The proposed system shows a customized analog circuit and systems for application to body parts of the human body, giving motion. Body signals measured from the body parts are processed through A skin-inspired sensor ROIC, then it can be measured and collected in real time by consisting of a Bluetooth module, a micro controller unit (MCU) and a battery with flexible printed circuit board (FPCB). The e-skin device is specialized in three electrical characteristics of pyroresistive, piezoelectric, piezoresistive. According to external readout topologies, and each sensing property can be controlled by amount of graphene in the composite process. It means that the e-skin device and the ROIC should be designed to be optimally correlated or a skin-inspired sensor electronic system
22
3.1.2 A skin-inspired sensor ROIC
Therefore, the ROIC is proposed to have an optimized circuitry architecture for operating three electrical characteristics of the e-skin device consist of PVDF/RGO. Firstly, the Resistive mode (R mode) performs a method to measure static pressure to the maximum 20 kPa by utilizing the piezoresistive of the e-skin device for trembling like a heart rate. Secondly, the Electrical mode (E mode) performs a method to process the piezoelectric characteristic and it treat of dynamic pressure characteristics having frequency components. Third, the high-resistive mode (HR mode) deals with high-resistance range and provides signal processing according to the pyroresistive input of resistance change caused by temperature change. A flexible e-skin sensor module is desined to have a polyimide-based FPCB substrate and designed to be comfortably worn on human body parts such as neck, wrist, and leg for detecting motion.
23
3.1.3 Three characteristics of an E-skin device
An e-skin device consisting of a composite of PVDF/RGO was made by mimic human epidermis. Fig. 15(a) describes how fingertip skin of human is an interlocked architecture, in which the receptors that detect external pressure or temperature are gained together. The e-skin device proposed implements inspired receptors to detect pressure and temperature of the skin in an interlocked architecture. Fig. 15(b), 15(c) are micrograph of the e-skin device using PVDF/RGO and show the interlocked architecture that is mimic structure from the fingertip skin. The electrical characteristics of e-skin devices made of PVDF/RGO composites have three characteristics like a receptor under the fingertip skin: piezoelectric, piezoresistive, and pyroresistive.
24
(a)
(b)
(c)
(d)
(e)
(f)
Fig. 15.
Human fingertip and electrical characteristic of e-skin device: (a) structure of
human fingertip (b) Inspired e-skin device from fingertip skin; (c) micrograph of e-skin device
(d) piezoelectric characteristic (e) piezoresistive characteristic (f) pyroresistive characteristic.
25
3.1.4
ROIC Implementation
Unlike conventional readout circuits [15], the ROIC is implemented to be reconfigurable so that it can support three electrical characteristic mode of the e-skin device. Fig. 16 shows the block diagram of a skin-inspired sensor ROIC, where three modes of R, E and HR are implemented to reuse common blocks, minimize the area and the power consumption. The R mode is implemented as a resistive sensor interface circuit using a differential amplifier and a resistive digital-to-analog converter (R-DAC). The differential amplifiers are used to linearize detection signals after comparing e-skin device with R-DAC. The E mode acts as a differential charge amplifier which is similar to an integrator, reusing the R mode circuits. The HR mode is a kind of an oscillator-based resistance to digital converter to support high-resistance region over tens of mega-ohms. Digital outputs in these three-type modes are transferred to the MCU through the serial peripheral interface (SPI), and then wireless data delivered to the smartphone via the Bluetooth communication.
26
Fig. 17 describes circuit operation of the R mode which measures the static pressure. The R mode has an optimized circuitry for operating three electrical characteristics that uses a differential amplifier and a programmable gain amplifier (PGA). In particular, the chopper stabilization is applied around the first differential amplifier to suppress the low frequency noises including flicker noises while performing single-ended to differential signal conversion. Depending on the chopper clock, the input path to the e-skin device changes alternately. As shown in Fig. 17(a), 17(b), the chopper stabilization with CK and CLKB connects the e-skin device to Vout1 or Vout2 via Rstd. The Rstd is resistance value of the R-DAC which is adjusted by the comparator and the control logic so that the P mode can detect wide range of resistances. The Nodal analysis of Fig. 17(a) around the differential amplifier can be written as follows:
(1)
(2)
From Equations (1) and (2), the differential amplifier outputs can be derived by
V
V
VDD
V
(3)
V
V
VDD
V
(4)
When CKB is on state as in Fig. 17(b), the same equation is derived like Equations (3) and (4). Since the e-skin device resistance is inversely proportional to its pressure input, the differential output of Equations (3) and (4) can have linear relationship with the pressure. For wide coverage of Rsens, Rstd is tuned depending on the region not to saturate the amplification, and the differential output would have linear relationship with the pressure input as shown in Fig. 17(c). Transient waveforms of the differential outputs are also shown in Fig. 17(d). When e-skin device is wore to human body, in this linear relationship process based on the resistance ratio, the resistance variation of the e-skin device from bending characteristic is minimized by adjusting range in R-DAC. In this way, the R mode converts single-ended signals of the e-skin device into differential signals so that the pseudo-differential structure and the chopper stabilization can increase the noise immunity considerably.
In the E mode, the e-skin device is connected to two input nodes in parallel as shown in Fig. 18(a), and the differential-amplifier pair is reconfigured to act as an integrator by changing its internal paths. The e-skin device generates charges from dynamic pressures, and the integrator operation convert the
27
input charge to the differential output voltage. The detected signal passing through the buffer is inserted to the ADC, and then converted to the digital output.
In the HR mode for temperature sensing, the e-skin device characteristic is located in high-resistance range over tens of mega-ohms when pressure is not applied as shown in Fig. 15(e). Thus, instead of using conventional voltage-converting methods, an oscillator-based readout is adopted to generate frequency displacements according to resistance changes, where the frequency displacement is converted into a digital value through the counting logic using an external clock. The oscillator consists of a NAND gate, an inverter, and a RC network. When the reset signal is ‘H’, the oscillator repeats charging and discharging whose period is decided by time constant of RC. The following counting operation converts the period or the frequency to a digital output which explains about temperature sensing of the e-skin device. Fig. 19 present measured characteristic curves of these three operation modes.
28
Fig. 17.
Detailed circuit operation of R mode for static pressures: (a) active path when CK
is on state; (b) active path when CKB on state; (c) linearization process; and (d) transient node
voltages.
29
(a)
(b)
Fig. 18.
Circuit-level implementations for (a) E mode and (b) HR mode.
REF
Control logic
SPI
Ext. clk INV Buffer counter14bit
Ext. reset NAND Piezo-resistive Piezo-electric Pyro-resistive (PVDF-rGO 3wt%) Digital out
30
(a) (b) (c)
Fig. 19.
Sensor readout characteristics after three type mode signal process: (a) R mode (b)
31
3.1.5
Flexible E-skin sensor module implementation
A flexible e-skin sensor module was implemented to provide real-time detections of human body signals by wearing the e-skin device as shown in Fig. 20. The skin-inspired sensor ROIC is directly mounted on the flexible sensor module in the form of a chip on board. The module size is 3.9 cm x 8.1 cm and its weight is 10.9 g, including both the e-skin device and battery. Two PVDF/RGO composites of 1 wt% and 3 wt% were applied for the e-skin sensor. The 1 wt% PVDF/RGO sample gave better piezoelectric responses with more charge generation and the 3 wt% smaple provided better piezoresistive responses with lower characteristic resistance, whose sizes are 2.5 cm × 2.5 cm and 1.2 cm × 1.2 cm respectively. They attached two copper electrodes on both sides using silver paste and annealed at 90 °C for 1 h. The flexible PCB that is made of polyimide-based flexible substrate improved flexibility by placing margins in the conductive layer to be worn on the human body. This blank area increases the module robustness from the bending. The input and output terminals were made by constructing holders such that it can connect with the e-skin device stably. Silicon molding was applied to sensitive input terminals and surfaces to prevent disconnection even if the PCB substrate is bent. Output signals are transmitted through the Bluetooth to an Android-based mobile platform where wireless real-time monitoring is provided by connecting to analytical applications.
32
3.1.6 Summary
This work presented a skin-inspired sensor ROIC sensor system which includes a flexible PVDF/RGO sensor device, a reconfigurable ROIC, and a mobile interface. Based on measured multi-functional characteristics of an in-house e-skin device, the ROIC was also optimally designed to support three type mode interfaces for piezoelectric, piezoresistive, and pyroresistive sensing targets. Seven wearable applications can be detected the feasibility of the proposed e-skin sensor interface for multiple sensor applications, where flexible sensor modules were properly adapted to provide comfortable skin-attached measurements depending on their target locations.
33
Chapter IV
34
4.1 Multi-biosignal sensing systems for sleep analysis
4.1.1 System Architecture
Multi-biosignal sensing interface has dual signal processing for proposed sleep analysis. Fig. 21. shows the dual-type signal process, monitoring mode, and analysis mode.
Firstly, multi-biosignal sensing ROIC can detect raw analog signals such as EEG, EMG, and EOG. After the preamplification stage, then these signals are divided into monitoring mode and analysis mode depending on the application. In the case of analysis mode, raw signals go to the feature extraction stage. The feature extraction stage extracts some signals with features of brain waves during sleep by using the scoring manual of the AASM. The output of the feature extraction stage is digital value, and they go to the MCU by serial to a parallel interface on ROIC.
The decision tree algorithm rearranges and scores the sleep stage using the digital values of the input feature extraction in the MCU. In monitoring mode, the measured raw-signal is directly digitized by a 16-bit sigma delta ADC built into the ROIC. The monitoring mode focused on a signal on the time-domain and transferred raw data to the personal computer and server. That is when MCU only serves as a data transfer. Through monitoring mode, raw data can be collected or used for various purposes. The two types of modes introduced above are designed to be used selectively or simultaneously. In the proposed paper, the result can display on the smartphone application and PC interface.
35
36
4.1.2 Decision tree algorithm for sleep stage
The sleep stage consists of three phases : wake, NREM, and REM [5]. However, depending on the application, the NREM stage is further divided.
AASM’s stages are divided into five stages, which are divided into three stages of NREM. In this paper, four phases are composed of wake (W), shallow sleep (SS), deep sleep (DS), and REM.
Looking at the human sleep cycle, N1 is a stage within 5% of the total, which is measured as the transition time between wake and N2 when the person is in shallow sleep. On the other hand, N2 is about half of the overall sleep period. Each stage, N3 and REM, accounts for 20-25% of the entire sleep cycle. Therefore, the period of N1 is insignificant compared to other stages for implementing a healthcare device. In the case of N1, the characteristics of the waveform representing the sleep period are also unclear [11,16,17,18], which improves the accuracy of the proposed paper consisting of analog signals proposed by dividing the sleep stage into SS, DS and REM. This method has been applied to existing healthcare products and is applied to most smartwatches and headbands [14]. In this paper, as in [14], N2 corresponds to SS (light sleep) and N3 to DS. The algorithm suitable for analog signal processing on time-domain applied in this paper is signal processing using a rule-based decision tree [19]. Sleep classification using the decision tree is intuitive and clear because it distinguishes features by already validated rules. The proposed paper implements a decision tree that is minimized to fit three features using EEG, EMG, and EOG.
37
4.1.3 Implementation of Smart-head band
Fig. 22(a) presents the placement of the electrodes on the bust image by the international 10-20 system [20]. In general, there are three types of signals used for sleep EEG analysis, three kinds of EEG, eye movement, and EMG from the submental. As a rule of AASM, an EEG signal requires three different placements of the electrode. But informal single-channel EEG analysis is being actively studied for healthcare devices, and its reliability has been recognized [21]. Therefore, it consists of the FP1 and Fpz of EEG placement, E1 and E2 of EOG placement, and Chin and Chinz of submental for EMG. Additionally, the ground electrode of total electrodes is taken with earlobe as clip type. Fig. 22(b) presents the proposed interface system and electrodes on the bottom side. It shows a healthcare device named Smart-headband. The implementation of the Smart-headband makes it possible to check the sleep condition conveniently. Its components consist of a headband made of rubber and mesh material with modules and electrodes. The size of the healthcare device is 3.5cm X 4.5cm for the module at the top and 3cm X 12cm for the headband at the bottom. It is designed not to burden on the forehead.
Fig. 22(c) shows a module consisting of multi-biosignal sensing ROIC, STM32L4 low power MCU, and HC-06 Bluetooth module. The module can send and receive data by the dual-type interface for data transmission with smartphone and PC interface through BT communication. The power consumption of the multi-biosignal sensing interface system is 70.9mW, among them ROIC is occupied by 0.9mW.
38
Fig. 22.
Overview Multi Bio Signal Sensing Interface Systems for Sleep Monitoring
39
4.2 Proposed Multi-biosignal sensing ROIC
The overall structure of the multi-biosignal sensing ROIC and MCU with BT module are shown in Fig. 23. Among them, the multi-bio sensing ROIC is divided into two parts : the preamplification stage, and the feature extraction stage in Fig. 24. The preamplification stage has a low dropout regulator with a bandgap reference block, SPI, clock generator, and 4 ExG channels such as EEG,2 EOG, and EMG. When body signals are input through the electrodes of the module, they are amplified and filtered according to the signal characteristics of each part of the body in the preamplification stage. The feature Extraction Stage is a proposed structure for the feature extraction of EEG, EOG, and EMG. The target of the EEG frequency has an 11-16 Hz configuration that distinguishes N2 and N3 from the sleep stage. This EEG signal identifies the sleep stage by detecting N2's characteristic Sleep spindle and filtering only N2's frequency band. EMG aims to measure and develop asthma during REM sleep. Lastly, EOG feature extraction can classify the REM and Wake.
After the processing of two parts, feature extraction digital values go to SPI for data transfer to MCU, and BT wireless data transmission can be done through UART communication. If the purpose is to transfer raw data rather than feature extraction, signal processing can be performed via a 16-bit sigma delta ADC and analysis can be performed in MATLAB on the PC interface via Bluetooth communication.
40
Fig. 24.
A micrograph of the multi-biosignal sensing ROIC
Fig. 23.
Overview Multi-BioSignal Sensing Interface Systems for Sleep Monitoring (a)
41
4.2.1 Preamplification stage
Fig. 25 illustrates the schematic of the preamplification stage, including a low noise amplifier (LNA) with chopper stabilization and switched capacitive type PGA. In particular, LNA with chopper stabilization is resistant to flicker noise. Also, it resolves DC offset due to mismatch using a DC servo loop and ripple in chopper using a ripple reduction loop. These techniques reduce not only noise, but also implementation as a bandpass filter to help detect the multi-biosignal and contribute to stable analog signal processing. This high pass filter’s cut off bandwidth is 0.6 Hz to 7 Hz. In the PGA, a design for each waveform characteristic is applied. During sleep, EEG has delta wave, theta wave, and alpha wave EEG change by sleep stage. Its frequency ranges from 4 to 30 Hz, and the EOG has several Hz blinks when waking and REM sleep. EMG typically detects changes in amplitude and has a 300 Hz range. So, the cut-off frequency range shows 30Hz, 6Hz, and 300Hz channel configuration for each frequency characteristic, and the gain is designed to be 35,33,26dB. Fig.26 shows a graph of the frequency characteristics of the PGA for each channel adapted for EEG, EOG, and EMG. Therefore, it is suitable for eye movement and EEG and chin muscle biosignals for sleep analysis.
42
Fig. 25.
Schematic of preamplification stage including LNA and PGA
43
4.2.2 Feature extraction stage
Feature Extraction mainly collects various biological data on servers and personal computers and performs FFT-based feature extraction and spectrum analysis in the frequency domain. These are primarily subdivided into LDA, ANN, SVM, KNN, and DT based on machine learning, and have high accuracy and reliability. However, it is necessary to configure a desktop computer for processing and must mobilize to the GPU. This is not suitable for wearable healthcare device [22]. The proposed paper analogizes signal processing on the time-domain to implement healthcare devices for sleep analysis. It is mounted on the chip. The features extracted from the analog chip are immediately decide into a rule-based decision tree on the MCU and sleep scoring data is sent to the user. The feature extraction stage performs signal processing according to the data characteristics of each channel to extract each waveform. Fig. 27 shows the feature extraction circuit for each channel, and below that is described in the waveform flow chart. Fig. 27(a) shows the Teager energy operator (TEO), which is the feature extraction circuit of the EEG sleep stage. First, the EEG signal processed by the preamplification stage is input to the BPF for the classification of a specific sleep stage. It is input to the TEO designed by the following formula [23]. TEO is a circuit for measuring instantaneous energy composed of a low-pass filter and a multiplier, and here is the definition for it.
x t
𝑥 𝑡
Ψ (1)
𝑥 𝑛
𝑥
𝑥
𝑥
(2)
Each equation represents a continuous and discrete time. Eq. (1) Implement a differential operator circuit of a high pass filter configuration. However, this circuit configuration is not suitable for biological signals below 30Hz, which is the frequency characteristic of EEG. Therefore, when a circuit is mounted with an operator-induced on the discrete domain as in eq(2) [24,25], a design suitable for a biological signal by a low-pass filter configuration is possible. In addition, the current consumption for the circuit structure of the gm-cell configuration is reduced. The transconductance of the amplifier at the input stage changes its frequency characteristics according to the amount of current. Then the pole moves to a lower frequency band as the amount of current is applied, so it is suitable for biosignals. In the designing, its cut off frequency was set within 60Hz. This circuit passes through a BPF of 11 to 16
44
Hz, and this signal is input to the TEO. Then the signal has filtered the frequency of the N2 stage, which derives the sleep spindle through the comparator. This process is to distinguish between SS and DS, and it can be used for the measurement of the essential features of the sleep spindle [25].
The compared value is output as a bit value and is determined as SS or DS stage by decision tree algorithm implemented in the MCU. The waveform on the bottom side of Fig. 27(a) shows the waveform of each node of the circuit. The upper side shows the processed EEG. When the pre-processed EEG signal comes in first, it is filtered by BPF and goes to TEO. The implemented circuit implements the equation by delaying the time element of Eq (2) through LPF and multiplier composed of GM-cells inside. The waveform of TEO OUT is normalized and compared so that it senses the frequency band of N2. The digit value of feature extraction is presented on in the bottom side of Fig. 27(a).
Fig. 27(b) is a signal level detector specialized to detect changes in the EMG waveform during sleep [26]. EMG exhibits distinct features of NREM sleep and REM sleep. When entering the sleep stage, the EMG waveform is weakened. Then, at the REM sleep stage, it becomes atonia and has a waveform under the 1uV [27]. Therefore, a signal level detector was constructed using a rectifier circuit and an integrator. The amplified EMG signal is input to a rectifier composed of CMOS to rectify the signal. The rectified signal affects the charging cycle of the integrator feedback capacitor, depending on the amplitude. So, the amplitude of the rectified signal is changed based on the sleep stage, REM and NREM can be detected. The final comparator output signal has its count period determined by the Epoch period of the MCU, and the finally counted value is transmitted to the MCU through an input or output port configured by SPI. The waveform on the bottom of fig. 27(b) shows the signal processing for each node. There are amplified signals and a rectified signal from top to bottom. Such signal processing makes simple and intuitive REM determination. Finally, a peak detector for EOG detection was implemented as follow Fig. 27(c). When NREM, there is no change in the waveform. However, EOG shows a sharp peak and a frequency exceeding 2Hz when entering REM. Similar in the Wake, EOG shows a peak about frequency under 2Hz. When peak appears, the EOG of both eyes has a reverse phase, which is a feature displayed during REM. Therefore, a peak detector configuration is required to measure peaks on both eyes and simultaneously measure the reverse phase. For this reason, four paths are shared for each input signal. They are paths created to detect the opposite phases one by one. Each phases including inward and outward are composed of two hysteresis threshold blocks and outputs only value within the set voltage range. The feature extraction value is divided into low voltage, and high voltage peak ranges. So, two amplitudes of other sizes are set. This is because NREM and REM can be
45
distinguished by setting the peak values of other sizes to low and high. The feature extraction value is stored in DFF. After that, it is transmitted to the MCU stage via SPI.
The waveform on the bottom side of Fig. 27(c) presents the processing of the EOG signal, indicating the amplified signal in the REM. From top to bottom, the waveforms show amplified signal waveform for both the eyes, and the feature extraction value includes high and low amplitude comparison. The data interface between the MCU and the ROIC is shown in Fig. 28. The data and control configuration are implemented to 16bit serial data SPI communication. MCU configuration can control the ROIC, and then ROIC transfers the data to the MCU. It can selectively send data1 for raw data transfer, as mentioned in Fig. 22 and data2 for feature extraction. On the bottom side of Fig. 28, it presents a serial data format from ROIC to MCU. This can be counted for sleep stage classification on the MCU. The dummy data of DATA2 is a pattern for clear checking each feature extraction during measurement.
46
47
48
49
Fig. 28.
DATA interface with serial data format.
Data1 Raw Data2 Features CLK EOC Config. Data
MCU
ROIC
CLK LES EOG_FE EEG_FE EMG_FE P
DATA2
D<14:11> D<9> D<7:2>
S DATA<15:0> P
50
4.2.3 Sleep stage classification based on decision tree
Table 1 summarizes the sleep stage characteristics regarding AASM for the proposed research. EOG waveform shows significant waveforms during Wake and Rem sleep. It is waveform below 2Hz due to the blinking of the eye, and when it is REM, it shows the characteristic of signal form that goes over 2Hz. In the case of SS, weak sinusoidal eye movement (SEM) appears. The EEG waveform slows down gradually from wake to deep sleep. Then, when the sleep stage enters the REM, the frequency rises slightly. During sleep, the EEG waveform repeats the cycle described. EMG waveform shows a weakening of Amplitude stage by stage. Depending on the counting of the feature for an epoch, stage classification is determined by the decision tree in Fig. 29. The first is SS versus DS using EEG feature extraction counting by experience threshold count. After comparison SS and DS, each group consists of NREM, REM, and Wake. EOG feature extraction consisted of high and low peak decide stage of step2. Unless it is NREM, the sleep stage is determined Wake or REM using EMG feature extraction counting. Signals processing in the feature extraction stage is analyzed by the counting and decision tree algorithm in the MCU. Table 2 shows the rule-based on each decision tree. According to Fig. 29 with Table 2, if the feature extraction counting of an epoch fits the dividing contents in a decision node, the epoch state goes in the direction of the left side. Otherwise, the epoch state follows the right side.
The rules of Table 2 are implemented in Algorithm 1. Algorithm 1 counts the feature extraction data for the 30s epoch and returns the stage value. The counting number of feature values for each stage was obtained empirically and implemented based on Table 2. This counting value is transmitted to MCU, and then each variable of fe_cnt is increased. In synchronization with the ADC throughput, there are 6000 signals received per 200 samples per second, after which the variables are initialized, and the next epoch begins.
51
TABLE I
T
HE CHARACTERISTICS OF EACH SLEEP STAGEWake Shallow Sleep (N1,N2) Deep Sleep (N3) REM EOG (frequency) 0.5~2Hz Blink SEM - Over 2Hz Blink EMG
(relative tone) High High - Medium Small Very small EEG (frequency) 8~13Hz (alpha wave) 11 – 16Hz (Sleep spindle) 0.5-2Hz (delta wave) 4-7Hz (theta+alpha wave) TABLEII.
D
ETAILS OF DECISION TREE NODErule comparative stages condition 1 SS/DS EEG FE counting > th 2 SS/REM,Wake High and low peak detection on
EOG < th
3 DS/REM,Wake High and low peak detection on EOG < th
4 Wake/REM EMG amplitude counting > th 5 Wake/REM EMG amplitude counting > th
52
Fig. 29.
Diagram of the proposed decision tree.
8-16 Hz EEG FE counting
High peak && Low peak on
EOG > th
High peak && Low peak on EOG > th SS, REM,Wake REM,WakeDS, SS REM,Wake Amp EMG counting Wake REM Amp EMG counting Wake REM DS REM,Wake
Feature extraction stage
FE data (16bit)
② ③
④ ⑤
53
Algorithm 1
: Rule Based Decision tree with fuzzy logic inference
1: function StageClassification(data , epoch){ 2: if data is EEG_FE then fe1_cnt++ 3: if data is EOG_HFE then fe2_cnt++ 4: if data is EOG_LFE then fe3_cnt++
5: if data is EMG_FE of range 5 to 10 then fe4_ cnt++ 6: if data is EMG_FE of range 2 to 4 then fe5_ cnt++ 7: if data is EMG_FE of range 0 to 1 then fe6_ cnt++ 8: cnt++
9: if (epoch == cnt){
10: if fe1_cnt is higher than th_eeg and fe2_cnt and fe3_cnt less than th_eog
then stage=SS;
11: if fe2_cnt and fe3_cnt is high than th_eog and EMG_FE of rage 0 to 1 higher than th_emg then stage=Wake
12: if fe2_cnt and fe3_cnt is high than th_eog and EMG_FE of rage 2 to 4 less than th_emg then stage=REM
13: else if fe6_cnt is high than th_emg then stage=Wake 14: }}
15: While(1) { 16: data_cnt++;
17: Stage_Detect( if(data_cnt >= 6000) 18: { epoch_ cnt ++;
19: fe1_cnt, fe2_cnt, fe3_cnt, fe4_cnt , fe5_cnt = 0; 20: stage = 0;
54
Chapter V
55
5.1 Evaluation of the EEG analysis using sleep dataset
The measurement was conducted in two forms. Firstly, public sleep datasets were used to score the proposed study. One of the datasets has the sleep-EDF dataset, which consists PSG records included six sleep stages [28,29]. The dataset sampling rate is 100Hz, and it was scored based on the R&K rule. These signals recorded for 7 hours, 50 minutes. Among them, this experiment is to validate for SS and DS. Fig. 30 shows the experiments of the validation test by the sleep dataset. The progress method extracts data into the CSV file by dividing SS and DS waveforms by epoch through the Hypnogram file of a dataset. The data was input to the smart band module through the simulator with an amplitude of less than 50uV, the size of the brain waves. Fig. 30(a) is an experimental figure using the sleep stage2 signal corresponding to SS using dataset, and Fig. 30(b) is a figure taken by inputting the signal of sleep stage3 corresponding to DS. The tablet on the left side of Fig. 30 is a real-time monitoring of the serial feature extraction data of the EEG processed in the multi-biosignal sensing ROIC. At the upper right side-hand of the figure is an oscilloscope scoped amplified analog waveform from the preamplification stage. Below that, we construct an EEG simulator with a wave generator. As shown in the Tablet display, the output of feature extraction differs because the frequency of stage2 is relatively higher than stage3. The Accuracy of the proposed analysis for distinguishing the SS and DS evaluated by specificity, sensitivity, and accuracy, are computed by the following equations below:
Sensivity TP TP FN Specifity TN TN FP Accuracy TN TP TN TP FN FP
The TP indicate the true positive, TN refer to the true negative, FP indicate the false positive, and FN refer to the false negative. As a result, a multi-biosignal interface was obtained in this work, and the performance of the proposed method could be determined by the average performance of the EEG feature extraction, as shown in Table 3.
56
The second experiment is the comparison of EEG measurement with OpenBCI and the proposed smart band. OpenBCI is a high-resolution EEG interface with TI's ADS1299. It is a proven open-source device that is already used in various EEG and human signal research fields. [30, 31, 32, 33, 34]
Fig. 31 shows a photograph of the experimental environment. The OpenBCI interface was worn on the upper part of the head, and the proposed smart-headband was worn on the front forehead. Sleep stage verification was performed by extracting single-channel signals of F4 and F3 using the verified EEG interface [4]. The two signals received from OpenBCI were subjected to sleep classification using a custom code using the SVM classifier of MATLAB.
57
(a)
(a )(b)
58
TABLEIII
C
ONFUSION MATRICES FOR PROCESSING SLEEP STAGES WITH THE MULTI-
BIOSIGNAL INTERFACE USING DATASETdataset1
Shallow
Sleep
Deep
Sleep
dataset2
Shallow
Sleep
Deep
Sleep
Shallow
Sleep
82
12
Shallow
Sleep
78
11
Deep
Sleep
18
88
Sleep
Deep
22
89
dataset1
dataset2
Sensitivity, %
87
87
Specificity, %
83
80
Accuracy, %
85
83.5
59
60
5.2 Sleep scoring using a rule-based decision tree algorithm
Fig. 32 shows the results of a six-hour 40-minute sleep test on a 32-year-old adult male. This is a graph of 800 epoch data collected for 6 hours and 40 minutes. Fig. 33(a) shows the FE collection data of the EEG for an epoch about the 30s. For example, Fig. 33(a) shows the transition point of the stage of SS to DS, which is the point of transition from SS to DS at about 200 epochs.
Fig. 32(b) shows the FE collection data graph of the EOG, the gray line is EOG_LFE, which counted the low peak of EOG, and the red line is EOG_HFE, which counted the high peak of EOG. They are used to determine REM and Wake depending on the size of two values by a rule-based decision tree. And Fig. 32(c) shows the results of the EMG collection data graph. The feature extraction of EMG has different output values depending on the amplitude. The 7-bit counter of the signal level detector outputs the FE of the amplitude. The counting speed is adjusted so that only 0 to 10 values are output. The counting outputs are grouped to determine the REM from 0 to 1 count. 2 to 4 was used for NREM, and over 5 for Wake. These values are also counted for each epoch and are represented in Fig. 32c. The epoch of the initial emg_FE is mostly occupied by 2 to 4 red lines. However, it is shown that it is reversed from the 200epoch part entering the DS of the EEG_FE graph. Fig. 32(d) and Fig. 32(e) show the results of the sleep stages for the final comparison with the Hypnogram. The overall comparison accuracy is 74% as follow Fig. 33, and there may be some errors because the comparison using the OpenBCI tool is a single-channel configuration.
Table IV summarized their measurement results and provided the performance comparison with other recent healthcare device works for sleep analysis where it shows various types of healthcare device is supported with portable and convenient. What stands out to this table, the proposed work achieves low power consumption and is an integrated wearable device with its own analytical system. This is the first study for sleep stage scoring of PSG interface except for commercial products. The power amount was the best in the wrist band study as follows table3. But it was excluded because it did not have a PSG interface. The accuracy is equivalent to or slightly less than that of other devices as 74%, but this is due to the high specification difference in the analysis environment.
61
(a)
(b)
(c)
Fig. 32.
Measurements of the feature extraction for a 800 epoch (6h 40m)
(a)
Plot of EEG feature extraction data
(b)
Plot of EOG feature extraction data
(c)
Plot of EMG feature extraction data
62
(d)
(e)
63
TABLE IV
C
OMPARISON OF WEARABLE DEVICE FOR SLEEP STAGE CLASSIFICATIONThis work [7] [11] [35] [36]
Wearable types Headband Portable type
Headband Wrist band and pillow type
Wrist band Target signal 1ch EEG,
2ch EOG, 1ch EMG EEG, EOG, EMG, EKG, airflow 4ch EEG Heartrate Body-movement Actigraphy
ADC resolution 16bit 12bit 24bit 10bit -
Power consumtion
70.9mW (Module 70mW
ROIC 0.9mW)
83mW 225mW Use power source 30mW
Sleep stages Wake, Shallow(N1+N2), Deep(N3),REM Wake,N1,N2, N3,REM Wake,N1,N2, N3,REM N1,N2,N3, REM Wake,N1,N2, N3,REM
Classifier Decision tree -
(clinician scoring)
SVM Fuzzy inference and finite-state machine RNN Performance 74% 85.4% 76.7% 83% 85.9% System integration Integrated module by customized ASIC with CMOS 180nm process Commertial discrete component Integrated module by discrete component Commertial discrete component Integrated module by discrete component Analysis interface
Built in self analysis Matlab based PC
interface
Matlab based PC interface
Server Matlab based PC interface
64
Chapter VI
Conclusion
This work proposes a multi-biosignal sensing interface system that performs a sleep analysis with two kinds of paths, a multi-biosignal raw-data transmission using ADC and a rule-based decision tree through the optimized circuit for multi-biosignal without ADC.
The multi-biosignal sensing ROIC is composed of the preamplification stage and the feature extraction stage, including a specialized multi-biosignal. The preamplification stage consists of LNA and PGA as chopper inputs in a fully differential amplifier configuration. LNA with chopper stabilization is resistant to flicker noise. The PGA is implemented with gains optimized for each biosignal. In particular, the feature extraction stage can detect the characteristics of the sleep stage for scoring the sleep classification. The feature extraction stage consists of the biosignal-customized circuit for EEG, EMG, and EOG. A Teager energy operator can detect the frequency range of 11Hz to 16Hz for shallow sleep using EEG. The amplitude of EMG is measured by a signal level detector, integrating muscle tone for classifying wakefulness and REM. A signal peak detector converts an eye blink to digital bits. There are two hysteresis threshold blocks for eye blink detection, including four hysteresis comparators. Each hysteresis threshold block can detect the eye blink and the inward and outward direction. Except for the signal level detector, the output of the remaining circuit is a digital bit. The signal level detector has a 7-bit counter output. After this, the feature extraction data goes to the MCU through SPI for sleep classification. A rule-based decision tree can determine the stage of sleep from the feature extraction data. The proposed algorithm decides the sleep stage by counting that comes in feature extraction data on the MCU. The multi-biosignal sensing ROIC can analyze the sleep stage through EEG, EMG, and 2EOG and can simultaneously analyze four channels. This ROIC is implemented using a compensate metal-oxide-semiconductor 0.18um process. In addition, the proposed sensing system implements a low-power consumption, an integrated module for wearable healthcare configuration, and a smart headband for prospective patients. Finally, sleep stage scoring can be displayed, or raw data can be sent to the personal computer interface to increase accuracy.
65
The multi-biosignal sensing ROIC is bonded on the module and mounted with the MCU and Bluetooth module in the proposed smart headband. The smart headband has five wet electrodes to measure EEG, EMG, and EOG on the forehead.
The proposed research is a sensor interface system based on an analog circuit and thus could be integrated into the interface of measurement and analysis. This means that it has