Improve Human Settlement Mapping with Big Data
Huina Mao1,21School of Informatics and Computing, Indiana University Bloomington 2Oak Ridge National Laboratory
1
Introduction
Every facet of our daily life is presently recorded by our communication infrastructure. Billions of individuals leave digital traces in social media, search engines, phone records, emails, GPS data, shopping records, and electronic sensors. Twitter reported over 645 million users worldwide in 2013 writing 58 million tweets and submitting 2.1 billion search queries per day1. In the same year, Facebook achieved the milestone of 1.3 billion user accounts, about 1/6th of the world’s population. On a daily basis, these Facebook users generate more than 400 million personal updates and upload 205 million photos 2. In addition to social media data, Google, as the leading search engine in the world, processes over 1 billion search requests and about 24 petabytes of user-generated data every single day, revealing in great detail what captures the attention of billions of web users. These numbers are staggering, but represent only the tip of an iceberg. Internet penetration rates can be rather low in some areas, but almost every single person on the planet now has access to at least one cell phone. The International Telecommunications Union (ITU) reported 6.8 billion mobile phone subscriptions in 2013, out of a global population of 7.1 billion individuals. These mobile devices are becoming increasingly sophisticated computational tools, connecting billions of people in real-time, and their sensors report geolocation data, social relations, environmental conditions, and increasingly the physical status of their users.
These datasets, so called “Big Data”, are available on historically unprecedented large scale, with fine granularity, and in real time, which provide great resources for research and enhance our ability to study individual and collective behavior. Big data are timely, voluminous, diverse, distributed and complex, which have helped transform industries, such as business, financial services, food/agriculture, and retail. This position paper discusses the potentials of big data for human settlement mapping research.
Human settlement mapping provides vital information for resource allocation, epidemic progression, cri-sis management, and urban planning. Recent work adopts high resolution satellite imagery to find informal settlements (i.e. unplanned, unauthorized, and/or unstructured housing) based on their unique spatial char-acteristics [1, 2], but it provides limited information on socioeconomic/cultural aspects of the population. To address this problem, we propose to infer population distributions and their socioeconomic indicators based on large-scale mobile phone usage data and social media data.
2
Methodology
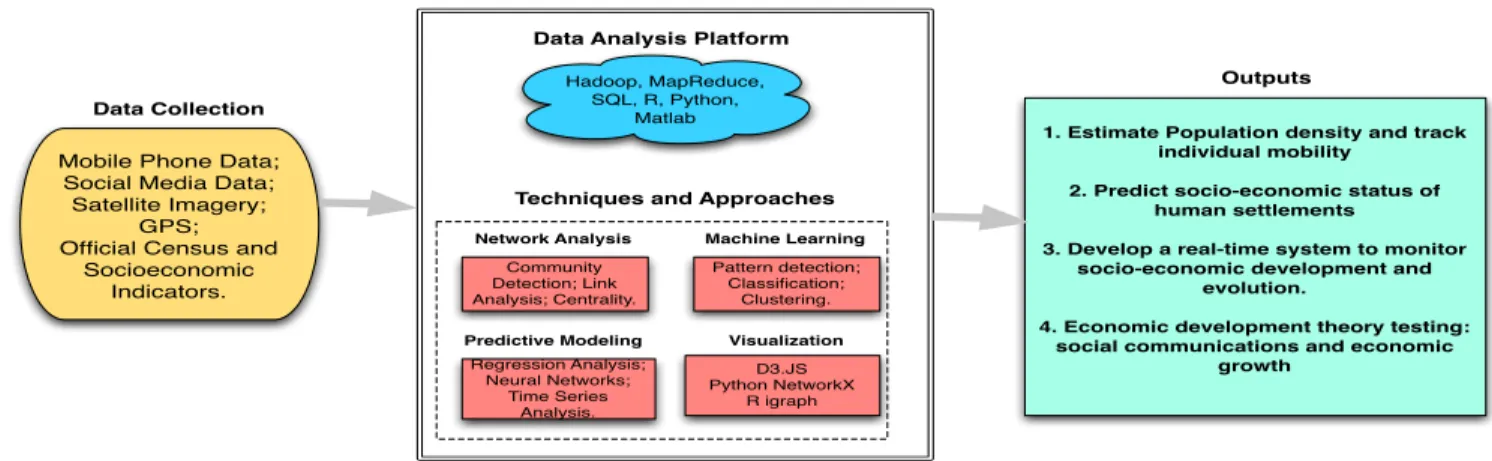
Extracting information from large-scale datasets requires combining methods from statistics, machine learning, natural language processing, and network analysis. Figure 1 displays the methodological framework of this proposed research. This methodology is based on a union of data sources, including high-resolution satellite imagery, mobile phone usage data, geo-tagged social media data, and official statistics. Integrating multiple data sources can outperform each single one in estimating population distribution at large- and finer-scale, and assessing socioeconomic and cultural aspects of regions.
1
http://www.statisticbrain.com/twitter-statistics/
2http://www.statisticbrain.com/facebook-statistics/
Mobile Phone Data; Social Media Data;
Satellite Imagery; GPS; Official Census and
Socioeconomic Indicators. Data Collection Community Detection; Link Analysis; Centrality.
Data Analysis Platform
Network Analysis D3.JS Python NetworkX R igraph Visualization Pattern detection; Classification; Clustering. Machine Learning Regression Analysis; Neural Networks; Time Series Analysis. Predictive Modeling
Techniques and Approaches Hadoop, MapReduce,
SQL, R, Python, Matlab
1. Estimate Population density and track individual mobility
2. Predict socio-economic status of human settlements
3. Develop a real-time system to monitor socio-economic development and
evolution.
4. Economic development theory testing: social communications and economic
growth
Outputs Data Analysis
Figure 1: The framework of proposed methodology.
Call Details Record (CDR) contains the information details about every phone call within the cellular network, including location, call duration, call frequency, and both parties originating and receiving calls. Based on CDR data, we can construct communication networks that allow us to detect the underlying population distribution and motion patterns. Also, community detection method can help identify the socioeconomic and cultural patterns of population distributions [3, 4]. In our previous work, we studied how to monitor the status of economic development in low-income countries, such as Cˆote d’Ivory (see details from [5]). In addition, social media, as an important channel for information dissemination, provide valuable data sources for social and economic research [6, 7]. With official statistics, analysis of big data can help our understanding of our world, and inform efficient and effective policy-making to enhance human well-being.
Data mining techniques, such as network analysis, predictive modeling, machine learning, visualization, and natural language processing, can be leveraged to enhance our understanding of the socioeconomic and cultural aspects of human settlements at global scales, which can complement existing research on settlement mapping based on satellite imagery. Specifically, we aim to investigate the following research questions: (1) estimate population density and track individual mobility; (2) predict socio-economic status of human settlements; (3) develop a real-time system to monitor socio-economic development and evolution (4) test economic theory, e.g. the relation between social communications and economic development [7].
3
Discussion
There has been considerable success in leveraging large-scale behavioral data at the intersection of social sci-ences and computational scisci-ences with myriad applications in public health, government, education, economics, business, and science, giving rise to the notion Computational Social Science [8] and Data Science. This field is clearly still in its infancy. The community of data scientists and computational social scientists are actively exploring the power as well as the limitation of a new paradigm in which to conduct scientific research, namely one where large-scale data and sophisticated computational methods have acquired a central role in the pro-cess of scientific discovery. In the future, leveraging large-scale data for scientific research and development would require intensive collaborations across different domains including computer science, statistics, mathe-matics, physics, geology, economics, psychology, and other social sciences. We expect these collaborations across different scientific domains will be productive.
References
[1] Graesser, J.et al.Image based characterization of formal and informal neighborhoods in an urban landscape.
[2] Vatsavai, R. R. Gaussian multiple instance learning approach for mapping the slums of the world using very high resolution imagery. In Proceedings of the 19th ACM SIGKDD international conference on Knowledge
discovery and data mining, 1419–1426 (ACM, 2013).
[3] Blondel, V. D., Guillaume, J.-L., Lambiotte, R. & Lefebvre, E. Fast unfolding of communities in large networks. Journal of Statistical Mechanics: Theory and Experiment 2008, P10008 (2008).
[4] Eagle, N., Macy, M. & Claxton, R. Network diversity and economic development. Science 328, 1029–1031 (2010).
[5] Mao, H., Shuai, X., Ahn, Y.-Y. & Bollen, J. Mobile communications reveal the regional economy in ivory coast. NetMob Conference - Data for Development Challenge (2013).
[6] Gundecha, P. & Liu, H. Mining social media: a brief introduction. Tutorials in Operations Research 1
(2012).
[7] Einav, L. & Levin, J. The data revolution and economic analysis.NBER Innovation Policy and the Economy
(2013).
[8] Lazer, D.et al. Computational Social Science. Science 323, 721–723 (2009).
HUINA MAO
www.linkedin.com/pub/huina-mao/26/436/43a
email: [email protected] tel: (812) 272 6400
RESEARCH INTERESTS
Big Data Analysis; Natural Language Processing; Sentiment Analysis; Predictive Modeling; Machine Learning; Econometrics; Network Analysis; Behavioral Economics.
EDUCATION
School of Informatics and Computing, Indiana University at Bloomington, Indiana, United States; Ph.D. Informatics, 2008-2014.
School of Computer Science, The University of Manchester, United Kingdom; M.Phil. Informatics, 2006-2008.
School of Electronics and Communication Engineering, North China Electric Power University, China; BA Communication Engineering, 2002-2006.
RESEARCH PROJECTS Google WellBeing
I developed a model for tracking the composite wellbeing index of the United States by aggre-gating hundreds of billions of Google search queries between 2004 and 2013. This composite wellbeing index consists of four components including economic and financial wellbeing, phys-ical health, mental health, and life satisfaction. Measuring wellbeing via Google searches complements traditional survey-based methods.
Automatic construction of a large-scale Chinese financial semantic lexicon
Good or bad news can have a big influence on financial asset prices. Semantic lexicons play a key role in sentiment analysis. In this project my colleague and I proposed an automatic methodology to construct and optimize a Chinese financial semantic lexicon. The key advan-tage of this proposed method is the ability to classify the polarity of financial news and justify individual lexicon terms based on market returns automatically without invoking human an-notations.
Orange Data For Development Challenge1
In this project we analyzed the mobile phone communication records of 2.5 million Orange customers in Cˆote d’Ivoire. By analyzing various network indicators, we monitored the regional economic patterns within the country in an efficient way. A community detection method was applied to draw the country map based on this mobile data. A rich-club phenomenon was found, indicating wealthy groups are clustered, which may deepen the gap between rich and poor. Research results may provide policy implication for poverty reduction.
Predicting financial markets: comparing survey, news, Twitter and search engine data
Using online data to predict financial markets attracts much attention from business and academia. However, most results rely on a unique or particular combination of datasets and sentiment tracking tools. In this project we collected a range of datasets including news, Twitter, search volume and survey data, and investigated their leading/lagging relationships, and the complex dynamics between public sentiment and financial markets.
Twitter mood predicts the stock market(featured on CNBC, Wired Science, New York Times, CNN International, Bloomberg News, NPR, etc)
Behavior economics tells us that emotions can profoundly affect individual behavior and decision-making. In this project we investigated whether measurements of collective mood states derived from large-scale Twitter feeds are correlated to the value of the Dow Jones In-dustrial Average (DJIA) over time. Our results indicate that the accuracy of DJIA predictions can be significantly improved by the inclusion of specific public mood dimensions such asCalm andHappy.
Huina Mao
Modeling public mood and emotion from a multi-dimensional perspective
A comprehensive emotion lexicon is indispensable for sentiment and emotion analysis. In this project, we construct an emotion tracking instrument, Google-Profile of Mood States (GPOMS), which measures human mood states in terms of 6 mood dimensions, including: Calm, Alert, Sure, Vital, Kind andHappy. Compared with the traditional positive/negative sentiment analysis, GPOMS is an improvement that moves forward to capture the complexity of human moods. Furthermore, we construct the Twitter social network and track longitudinal mood changes as they propagate across follower/friend ties.
Privacy revelation detection from online social networks
Privacy revelation from online social networks has become an important issue due to their mass adoption. Using techniques from computational linguistics, machine learning, and content analysis, we analyzed several privacy-related topics on Twitter: divulging vacation plans, tweeting under the influence of alcohol, and revealing health problems.
RESEARCH EXPERIENCES
Research Fellow,Warwick Business School, University of Warwick, U.K; 09/2013-12/2013
Research Intern, Technology Summer Associate Program, Thomson Reuters, New York City; 06/2012-08/2012
Research Intern,Microsoft Research, Redmond, WA; 05/2011-08/2011
Research Assistant,Indiana University, Bloomington, IN; 09/2010-08/2013
TEACHING EXPERIENCES
Teaching Assistant,Indiana University, Bloomington, IN; 09/2008-05/2010
• INFO-I 202 Social Informatics
• INFO-I 210 Information Infrastructure II – Python/PHP Programming
PATENT
Johan Bollen and Huina Mao. 2013. Predicting economic trends via network communication mood tracking. U.S. Patent 8,380,607.
PUBLICATIONS Working papers
Huina Mao, Scott Counts, and Johan Bollen. “Predicting Financial Markets: Comparing Survey, News, Twitter and Search Engine Data,”http://arxiv.org/abs/1112.1051(citation: 14)
Accepted & Published papers2
Huina Mao, Pengjie Gao, and Johan Bollen. “Automatic Construction of a Large-Scale Chinese Financial Semantic Lexicon,”7th Financial Risks International Forum - Big Data in Finance and Insurance,Paris, March 2014.
Huina Mao, Scott Counts and Johan Bollen. “Quantifying the Effects of Online Bullishness on International Financial Markets,” presented atBehavioral Finance Working Group Conference, Lon-don, UK, December 2013;European Central Bank Workshop on Using Big Data for Forecasting and Statistics,Frankfurt, Germany, April 2014.
Huina Mao, Xin Shuai, Yong-Yeol Ahn, and Johan Bollen. “Mobile Communications Reveal the Regional Economy in Cˆote d’Ivoire,”NetMob Conference - Data for Development Challenge, MIT, Boston, USA, 2013.
Huina Mao, Xin Shuai and Apu Kapadia, “Loose Tweets: An Analysis of Privacy Leaks on Twitter,” 2011 ACM Workshop on Privacy in Electronic Society (WPES 11), Chicago, Illinois, October 2011. (citation: 27)
Johan Bollen, and Huina Mao, “Twitter Mood as a Stock Market Predictor,” IEEE Computer, vol 44 (10): 91-94, 2011. (citation: 30)
Huina Mao
Johan Bollen,Huina Maoand Xiaojun Zeng. “Twitter Mood Predicts the Stock Market,”Journal of Computational Science, vol 2 (1): 1-8, 2011. (citation: 664)
Huina Mao, Scott Counts, and Johan Bollen. “Computational Economic and Finance Gauges: Polls, Search, & Twitter,” National Bureau of Economic Research – Behavioral Finance Meeting, Stanford, CA, November 2011.
Johan Bollen,Huina Maoand Alberto Pepe, “Modeling Public Mood and emotion: Twitter Sen-timent and Socio-economic Phenomena,”ICWSM, Barcelona, Spain, 2011 (short paper). (citation:
230)
Huina Mao, Xiaojun Zeng, Gang Leng, Yongjie Zhai, and John Keane, “Short and Mid-Term Load Forecasting Based On Self-Organizing Fuzzy Neural Networks and Bilevel Optimization Model,” IEEE Transactions on Power System, vol 24 (2): 1080-1090,May 2009. (citation: 23)
Huina Mao, Xiaojun Zeng, Gang Leng, Yongjie Zhai, and John Keane, “Short-Term Load Forecast-ing Based On Self-organizForecast-ing Fuzzy Neural Networks,”Proceedings of IEEE International Conference on Fuzzy Systems,London, UK, July 2007.
Xueming Yang, Jinsha Yuan, Jiangye Yuan, Huina Mao, “A modified particle swarm optimizer with dynamic adaptation,”Applied Mathematics and Computation, vol 189 (2): 1205-1213, 2007. (citation: 169)
PROGRAMMING SKILLS
R, Python, MySQL, Matlab and Mathematica.
REFERENCES
Dr. Johan Bollen
School of Informatics and Computing, Indiana University-Bloomington, U.S.A Phone: 812-856-1833
Email: [email protected]
Hompage: http://informatics.indiana.edu/jbollen/
Dr. Pengjie Gao
Department of Finance, Mendoza College of Business, University of Notre Dame, U.S.A Phone: 574- 631-8048
Email: [email protected]
Hompage: http://www3.nd.edu/~pgao/ Dr. Scott Smart
Kelley Business School, Indiana University-Bloomington, U.S.A Phone: 812-855-3401
Email: [email protected]