Equilibrium Studies, DNA Binding Studies and Anti
Microbial Activity of VO(II) and Zn(II) Complexes
of 2-Acetyl-amino-5-methyl-1,3,4-thiadiazole
Firasath Unnisa1, B. Sireesha1 and P. Acharya Nagarjuna2
1Department of Chemistry,
Nizam College, O.U., Basheerbagh, Hyderabad, INDIA. 2Department of Microbiology,
Osmania University, Hyderabad, INDIA. email:[email protected]
(Received on: August 16, 2016)
ABSTRACT
2-acetyl-amino-5-methyl-1,3,4-thiadiazole (AAMTDA) and its VO(II) and Zn(II) complexes were synthesized and characterized using IR, UV, 1H-NMR, 13
C-NMR, LC-MS and TGA. The proton-ligand and metal-ligand constants [M=Zn(II)] of this compounds were determined in 70%(v/v) DMF-water media at 0.1M KNO3
ionic strength and 303K using Irving Rossetti potentiometric titration method. The DNA binding studies were carried out using UV absorption spectroscopy, spectrofluorimetry and viscosity measurements. From the data obtained the intercalative mode of binding is suggested. Antimicrobial studies showed that the activity of diamagnetic Zn(II) complex is high compared to VO(II) complex.
Keywords: Potentiometric titrations, thermal analysis, UV absorption spectroscopy, spectrofluorimetry, viscosity measurements and antimicrobial studies.
1. INTRODUCTION
for the further pharmacology research12. The complexes of 2,5-disubstituted thiadiazoles have been screened on HL-60 Human leukemia cell lines and U-937 Lymphoma cell lines for anti cancer activity13. In vivo evaluation of antimicrobial activities of the metal complexes and the ligands showed greater activity against some micro organisms when compared to parent compound14.
The present work involves the synthesis of 2-acetyl-amino-5-methyl-1,3,4-thiadiazole (AAMTDA) following reported procedure15, and its VO(II) and Zn(II) metal complexes. The characterization, equilibrium studies, DNA binding studies and anti microbial studies of the compounds have been discussed.
2. EXPERIMENTAL
2.1 Materials and Methods
All the chemicals and solvents used were of Analar grade and used without further purification. Metal salts used are zinc chloride and vanadyl sulphate. Thin layer chromatography was used to access the reactions and purity of compounds synthesized. Melting points were recorded in open capillary tubes on a Toshniwal hot stage apparatus and presented uncorrected. LC-MS of ligand and its complexes were recorded on LC-MS 2010A Shimazdu spectrometer. IR spectra were recorded on Shimazdu prestige-21 FTIR spectrophotometer in KBr disc. UV spectra was obtained in DMSO solution using Shimazdu UV 2450 spectrophotometer within the range of 200-1000nm. 1H-NMR (with D
2O exchange) and 13C-NMR spectra were recorded on Bruker WH-270MHz using TMS as internal standard and chemical shift in
𝛿
ppm. Thermogravimetric analyses were carried out on Perkin-Elmer model TGS-2. Conductance of the metal complexes was determined in DMSO using Digisun digital conductivity meter model D1 909. Magnetic measurements were made on solid complexes on Faraday balance model 7550. ESR spectrum of Vanadyl complex was obtained from JEOL, JES-FA 200 ESR spectrometer. The proton ligand and metal ligand formation constants of complexes were determined potentiometrically using Irving-Rossetti pH titration technique using a digital Elico Electronic model LI-120 PH meter in conjunction with a combined glass and calomel electrode. DNA binding studies were carried out using U.V absorption spectroscopy. Emission spectral study was carried out by using Shimazdu RF 5301 PC spectrofluorophotometer and Viscosity measurements were carried out using an Ostwalds viscometer maintained at a constant temperature of 30.0±0.1°C in a thermostatic water-bath. Antimicrobial activity was tested using Disc Diffusion method.2.2. Synthesis of 2-acetyl-amino-5-methyl-1,3,4-thiadiazole(AAMTDA)
Scheme 1: Synthesis of 2-Acetyl-amino-5-Methyl-1,3,4-Thiadiazole (AAMTDA)
2.3. Preparation of metal complexes
VO(II) and Zn(II) complexes of AAMTDA are prepared by refluxing the metal salt solutions of Vanadyl sulphate (0.0015M) and zinc chloride (0.0015M), respectively with hot methanolic solution of AAMTDA (0.0030M) that is in 1:2 molar ratio for 15hrs. pH was adjusted with methanolic ammonia and the solid complexes separated were washed with hot methanol, to remove unreacted ligand, then with double distilled water to remove unreacted metal salt and then with petroleum ether, and finally dried over fused CaCl2, in a vacuum desiccators at room temperature.
2.4. Computational studies
Keto and enol forms of AAMTDA were built, their geometry optimization is performed and the orbital energy diagrams are generated using Hyperchem 7.5. The total energy, heat of formation and dipole moment of the optimized geometries are calculated. Electrostatic potential diagrams are mapped. Highest occupied molecular orbital (HOMO), Lowest unoccupied molecular orbital (LUMO) have been generated. Important physical parameters like energies of HOMO and LUMO, their gap, hardness(η), ionisation potential(IP), and electron affinity(EA) that are important for studying chemical reactivity and QSAR properties are evaluated16,17. Electrostatic potential mapping, reveal the reactive sites on the molecules18,19.
3. RESULT AND DISCUSSION
Fig.1: Structure of AAMTDA
3.1. Characterization of AAMTDA 3.1.1. LC-MS
showed a base peak at m/z156 (M-1)+., 157 (M)+. molecular ion peak, m/z144 (M-43)+. (-COCH3) and m/z127(M-30)+.(M-CH3).
Fig.2: Mass spectrum of AAMTDA
3.1.2. IR Spectra
IR spectrum of AAMTDA showed characteristic bands at 3170cm-1 υ
(2oN-H), 2792-2918cm-1
υ(C-H), 1701cm-1 υ(C=O), 1573cm-1 υ(O=C-NH), 1567cm-1 thiadiazolic ring υ(C=N-3), 1501cm-1 υ
(C=N-4), 1435cm-1 υ(C-N-S), 1236cm-1 υ(N-C=O), 1194cm-1 υ(C-C), 1037cm-1 υ(N-N), 705cm- 1 υ(C-S)20 and 680 cm- 1 υ(C5-S).
Fig.3: IR spectrum of ligand AAMTDA
3.1.3. 1H-NMR: 1H-NMR spectrum of AAMTDA (Fig.4) in DMSO-d6, showed singals at ppm
𝛿1.29
(s, 3H, (C8) CH3),𝛿
2.18 (s, 3H, (C7) CH3),𝛿
12.38 (s, 1H, 2oNH). The chemical shift of amide (2oNH) proton is supported by the D2O exchange spectrum.
Fig.4: 1H-NMR spectrum of AAMTDA with D
2O exchange (Insert)
3.1.4. 13C-NMR
13C-NMR spectrum of AAMTDA (Fig.5) showed the signals corresponding to 5
carbons in the compound at ppm
𝛿
13.76(C8),𝛿
22.34 (C7),𝛿
158.36 (C5),𝛿
159.03 (C2) andFig.5: 13C-NMR spectrum of AAMTDA
3.1.5. UV - Visible spectra
The UV -Visible spectrum of AAMTDA (Fig.6) showed a highly intense peak at 38314.17cm-1 corresponding to n
→
π
∗ transition in C=O of amide.Fig6: UV - Visible spectrum of AAMTDA
3.1.6. Equilibrium studies
The determination of acid dissociation constant of AAMTDA and the stability constants of its metal complexes with Zn(II) ion were carried out by Irving and Rossoti potentiometric titration method21,22 at 303K and 0.1M ionic strength (KNO
3) in 70% v/v DMF-water medium. The values obtained were further refined by using least square method. The ligand was found to be a monobasic acid with one dissociable proton with pKa value of 9.613 corresponding to the amide hydrogen in the keto form or from hydroxyl group in the enol form of ligand (Fig. 7).
Fig.7: Keto-enol tautomerism in AAMTDA
The stability constant values of Zn(II)-AAMTDA complex were obtained from the
plots of Log 1-
n
/n
vs pL for 1:1 M-L complex and Log 2-n
/n
-1 vs pL for 1:2 M-L complex. The stability constant value of Zn(II)-AAMTDA complex (Logβ= LogK1+ LogK2) is 12.15 (8.14+4.01), thus indicating 1:2 M-L ratio of the complex.3.2. Computational Study of AAMTDA
energy, heat of formation and dipole moment of the optimized geometries were calculated
using quantum mechanics semi-empirical AM1 and are presented in Table 1.
Table: 1Molecular Properties of AAMTDA
The lower energies indicate that both keto and enol forms of the compounds are stable. Close proximity in energies indicate the possibility of co-existence of both the forms. Calculated dipole moment values indicate polar nature.
3.2.1. FMO Analysis
Analysis of HOMO and LUMO of the chemical compounds play an important role in understanding its chemical reactivity. Ionization energy (IE), electron affinity (EA) and hardness can be expressed as – E HOMO, – ELUMO and 1/2 (E HOMO- E LUMO)18,19 respectively and are shown in Table 2. A system with large gap between HOMO and LUMO will be less reactive and is harder in nature, hardness of the molecule in all the two forms also supported by their ionization energy.
Table: 2Comparison of HOMO–LUMO energy, hardness, ionization energy, electron affinity of keto and enol forms of AAMTDA
Energies Keto Enol
E HOMO (ev) -10.678 -9.397
E LUMO (ev) -0.811 -0.926
E HOMO- E LUMO (ev) 9.867 8.471
Hardness=1/2 (E HOMO- E LUMO) 4.933 4.235
I.E=- E HOMO 10.678 9.397
EA=- E LUMO 0.811 0.926
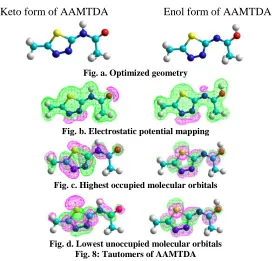
The optimized structures of Keto and enol forms of AAMTDA, electrostatic potential, and the generated -HOMO, LUMO diagram using semi emperical AM1 method are presented in Fig: 8. Electrostatic potential mapping gives information about the reactivity of the molecule with nucleophilic and electrophilic reagents. From the electrostatic potential mapping violet region around oxygen and nitrogen atoms with amide linkages indicate negative ESP, hence more susceptible to electrophilic attack by a suitable molecule.
Molecular Properties AAMTDA
Keto Enol
Total Energy (kcal/mol) -43131.66 -43125.95
Heat of formation (kcal/mol) 37.08 42.80
Keto form of AAMTDA Enol form of AAMTDA
Fig. a. Optimized geometry
Fig. b. Electrostatic potential mapping
Fig. c. Highest occupied molecular orbitals
Fig. d. Lowest unoccupied molecular orbitals Fig. 8: Tautomers of AAMTDA
3.2.2. QSAR Studies
QSAR studies help to recognize and compute the physic-chemical properties of a drug and its effect on biological activity which include hydrophilic, electronic and steric nature. Hydrophobic character of a drug is crucial in identifying its ease in crossing the cell membrane and its interaction with the receptor. It is measured in terms of partition coefficient. Partition coefficient = Conc. of drug in octanol / Conc. of drug in aq. solution. QSAR properties of the title compound are presented in Table 3. The results reveal that enol form of AAMTDA has good QSAR properties than its keto form.
Table: 3 QSAR properties of AAMTDA
Properties (AM1) AAMTDA
Keto Enol
Partial charge 0.00e 0.00e
Surface area (approx) (Å2) 330.50 312.33
Surface area (grid) (Å2) 331.60 329.82
Volume (Å3) 489.60 483.90
Hydration energy (K.cal/mol) -10.10 -14.53
Log P 0.68 1.72
Refractivity (Å3) 39.28 39.52
Polarizability (Å3) 15.48 15.61
3.3. Characterization of metal complexes
3.3.1. Physical properties: VO(II)-AAMTDA is dark brown in color where as Zn(II)-AAMTDA complex is white amorphous solid. VO(II)-complex is water soluble and also undergo decomposition on heating whereas Zn(II) complex is sparingly soluble in DMF and DMSO, stable at room temperature but on heating undergoes decomposition above 300˚C.
Barium chloride test for sulphates23 was carried out for vanadyl complex and confirmed the presence of sulphate anion outside the coordination sphere.
3.3.2. LC-MS: The liquid chromatogram of VO(II)-AAMTDA showed a single peak with retention time of 0.567m indicating the purity of compound. The ESI(+) mass spectrum(9a) of the complex showed a peak at m/z 499(499) is attributed to the molecular ion species [VO(C5H7N3OS)2H2O.SO4]+., a peak at m/z 404(403) is due to [VO(C5H7N3OS)2H2O]+., peak at m/z 385 is VO[C5H7N3OS]2+., m/z 229(228)1:1 M-L fragment of the complex VO[C5H7N3OS ]+., m/z 157 molecular ion of the ligand [C5H7N3OS]+., m/z 95 is due to sulphate ion.
The liquid chromatogram of Zn(II)-AAMTDA(9b) showed a single peak with retention time of 0.558m indicating the purity of compound. The APCI(+) mass spectrum of Zn(II)-AAMTDA showed a peak at m/z 417(415.38) attributable to the molecular ion species [Zn(C5H6N3OS)22H2O]+., a peak at m/z377(376.38) [Zn(C5H6N3OS)2]+., m/z 223(222.38)
[Zn(C5H6N3OS)]+. 1:1 M-L fragment of the complex.
9a: VO(II)-AAMTDA 9b: Zn(II)-AAMTDA Fig.9: Mass spectra of metal complexes
3.3.3. IR: IR spectrum24 of [VO(C
5H7N3OS)2H2O] complex (Fig.10a) showed a broad peak at 3200-3300cm-1 due to the presence of coordinated water. Peaks corresponding to υ
(2oN-H) at 3032cm-1 and υ
(C=O) at 1685cm-1 are present indicating the involvement of ligand in complex formation in its keto form. A peak at 1510cm-1 is due to υ
(C=N-4) of thiadiazole ring that is not involved in binding with the metal ion, a band at 1550 cm-1 υ
(C=N-3) of thiadiazole ring has been shifted to 15-20cm-1 lower frequency compared to its position in AAMTDA due to its involvement in the binding with metal ion through carbonyl oxygen. A peak at 960cm-1 υ(V=O)25, strong band26,27 at 615cm-1 along with a band at 808cm-1 and 550cm-1 are due toυab (SO42-), 408cm-1 υab (SO42-), and a strong band26,27 at 1099 cm-1 is due to υas(SO42-), 366cm-1 υ(V-N), 300cm-1 υ
(V-O), 289cm-1 υ(V-H2O) are also observed. IR spectrum20 of [Zn(C
5H6N3OS)2 2H2O] complex (Fig.10b) showed a broad peak at 3300-3500cm-1 due to presence of coordinated water. Peaks at 3170cm-1 υ
-1 υ
(C=O), which are present in the AAMTDA are absent and new band at 1657cm-1 υ(O-C=N) is observed as a result of enolisation of carbonyl group. A band at 1567cm-1 υ
(C=N-3) of thiadiazole ring is seen at frequency 50-60cm-1 lower compared to AAMTDA at 1508cm-1 due to its involvement in binding with metal ion through enolic Oxygen. Other bands are observed at 1501cm-1 is due to υ
(C=N-4) of the thiadiazole ring, bands at 1022cm-1 υ(C-O), 500-550cm-1 υ(Zn-N), 460 cm-1 υ
(Zn-O), and 350-400 cm-1 υ(Zn-H2O).
10a: VO(II)-AAMTDA 10b: Zn(II)-AAMTDA Fig.10: IR Spectra of metal-complexes
3.3.4. Thermogravimetric analyses: Thermogram of VO(II)-AAMTDA(11a) showed decomposition of complex in five steps. From 150°C-243°C the % weight loss of 4.2% (20.95g) which is attributed to loss of one mole of coordinated water. Weight loss between 243°C-315°C is about 19% (94.81g) may be attributed to loss of sulphate ion, the % weight loss of 54.219% (155.67g) from 315°C-585°C indicate the sudden decomposition of ligand moiety. The % weight left is 20.281%(80.05g) which correspond to the weight of vanadium oxide.
Thermogram of Zn(II)-AAMTDA complex (Fig.11b) showed the decomposition of complex in four steps. From 150°C-240°C % the weight loss is 8.97% (37.22g) which corresponds to the loss of two moles of coordinated water. From 240°C-601°C the weight loss is 16.98%(70.47g) and the % weight loss from 601°C-1000°C is 8.362% (34.7g) which can be attributed to the partial decomposition of the ligand molecule. The residue left at the end is 63.57% (265) which corresponds to the undecomposed complex moiety.
3.3.5. 1H-NMR of Zn(II) complex: The 1H NMR of Zn(II)-AAMTDA complex (Fig.12) showed the absence of peak corresponding to the 2oamide (NH) group at
𝛿
13.3ppm indicating the loss of proton.Fig12: 1H-NMR of Zn(II)-AAMTDA complex
3.3.6. Magnetic susceptibility: The magnetic moment value of VO(II)-AAMTDA was found to be 1.49 BM, indicating the presence of one unpaired electrons and octahedral geometry around the metal ion.
3.3.7. UV: The electronic spectrum of VO(II)-AAMTDA (Fig.13) showed d-d transitions28 due to 4T
1g
→
4A2g(16,025 cm-1), and 2𝐸 →
2B2 (10,193 cm-1) transitions, indicating distorted octahedral geometry. A transition at 37593 cm-1 is due to ligand chromophore.Fig.13: Electronic spectra of VO(II)-AAMTDA complex
3.3.8. ESR: The ESR spectrum of the VO(II) complex (Fig.14) recorded at room temperature showed a typical eight-line pattern, indicating the presence of single vanadium ion and the unpaired electron interacts with the nuclear spin of V(I=7/2)29. The spectrum suggests the distorted octahedral geometry of the complex.
Fig.14: ESR of VO(II)-AAMTDA complex
From the analyses all the analytical and spectral techniques employed the following tentative structures for the metal complexes have been assigned
15a. VO(II)-AAMTDA 15b. Zn(II)-AAMTDA Fig.15: Tentative structures of M(II)-AAMTDA complexes
3.3.10. DNA binding studies
a. UV absorption spectroscopy: DNA binding experiment was performed in TRIS HCl /NaCl buffer (50mM TRIS HCl /5mM NaCl buffer, pH 7.2, using DMSO solution (10%) of metal complex. The concentration of calf thymus (CT) DNA was determined from the absorption intensity at 260nm with a ε31 value of 6600M-1 cm-1. In order to quantitatively compare the binding strength of the complexes, the intrinsic binding constants Kb of the two complexes
with CT DNA were determined according to the following equation32 [DNA]/(εa- εf) = [DNA]/(εb- εf) +1 /Kb(εb- εf), Where, εa=Aobs/[complex]; εf and εb
corresponds to the extinction coefficient for free(unbound) and fully bound complex. The plot of [DNA] / (εa- εf) vs [DNA] will have a slope equal to 1 / (εa- εf) and the intercept
equal to 1/Kb(εb-εf), Kb is given by the ratio of slope and intercept. The non linear least square analysis was performed using Origin pro 6.1. The hypochromism and red shift seen in the absorption spectra is due to strong π
→
π* stacking interaction between the aromatic chromophore of the metal complexes and the base pairs of DNA33 suggesting intercalative mode of binding. The binding constant [K(b)] of the complexes was found to be 5.58 x10⁴M-1 in VO(II)-AAMTDA and 7.98 x10⁴M-1 in Zn(II)-AAMTDA.
b. Fluorescence study: Competitive binding of metal complex to DNA: The affinity of metal complexes towards DNA can be measured by competitive fluorescence studies, as it is a measure of the extent of the emission intensity reduction of the EtBr-DNA adduct. The quenching of the EtBr-DNA adduct fluorescence is studied by monitoring the emission spectra of the species in the wavelength range of 580-610 nm with an excitation wavelength of 520 nm, upon addition of different concentrations of metal complex to DNA pretreated with EtBr. The fluorescence quenching at around 580-610nm is described by the Stern-Volmer equation: Io/I=1 + Ksvr34, where Io and I are the fluorescence intensities the DNA-EtBr adduct in the absence and the presence of complex respectively. Ksv is a linear Stern–Volmer quenching constant, r is the ratio of the total concentration of complex to that of DNA. Ksv values (M-1) are obtained from the graph indicate the extent of interaction of the metal-complex with the DNA.
Fig.17b: VO(II)-AAMTDA(Ksv=2.838x10³M-1) Fig.17a: Zn(II)-AAMTDA(Ksv=4.24M-1) Fig.17: Emission spectra of VO(II) and Zn(II) complexes showing fluorescence quenching on increasing the concentration of metal-complex. (Insert: Stern-Volmer plot of the fluorescence titration data.)
c. DNA viscosity measurements: DNA viscosity experiments are carried out in especially designed Ostwald’s viscometer and the temperature is strictly controlled at 30oC using thermostatic bath35,36. DNA viscosity experiments were carried out to support the results obtained from Electronic absorption and Fluorescence studies. The data obtained is plotted in a graph, (η/η0)1/3 versus the ratio of the compound to DNA concentration, where η is the
viscosity of DNA in the presence of the metal complex and η0 is the viscosity of the DNA
alone. Viscosity values are calculated with the observed flow time of a DNA solution (t),
corrected with the flow time of the buffer alone (t0): η= t – t0/ t037.
Fig.18: Effect of increasing concentrations of EtBr (blue line), VO(II)-AAMTDA(green line), Zn(II)-AAMTDA (red line), on the relative viscosity of CT-DNA.
strains of Eischeria coli, Staphylococcus aureus, Bacillus substilis [gram(+ve)], Klebsiella pneumonia [gram(-ve)]. The compounds were tested at concentration 50μg/1ml of DMSO using Disc diffusion method using gentamycin as standard. The diameter of susceptibility zone was measured in mm. It was found that the diamagnetic Zn(II) complexes showed more activity against bacteria than the paramagnetic VO(II) complex and ligand.
Table: 5 Antimicrobial activity of AAMTDA and its VO(II) and Zn(II) complexes
SAMPLE Staphylococcus aureus Eischeria coli Bacillus substilis Klebsiella
pneumonia
AAMTDA - 8mm - -
VO(II)-AAMTDA - 10mm - -
Zn(II)-AAMTDA 24mm 19mm 25mm 17mm
4. CONCLUSIONS
The geometry of the complexes obtained proposed to be distorted octahedral from various spectro-analytical techniques. The 1:2 (M-L) ratio of Zn(II)-AAMTDA complex is supported by the potentiometric titrations. In Electrostatic potential, total spin and total charge density maps, nitrogen atoms with amide linkage indicate negative ESP, hence more susceptible to electrophilic attack by a suitable agent. Energy gap between HOMO and LUMO proved stability and hardness of the molecule. QSAR properties generated show good penetrating capacity of the enol form of ligand into cell membrane. The effectiveness of the DNA binding of VO(II) and Zn(II) complexes is being confirmed by means of hypochromism in the electronic spectral studies and change in intensity of emission in the case of emission spectral studies. Besides, the effectiveness of binding is also confirmed by the viscosity studies. This reveal that the metal-complex interacts with DNA base pairs effectively by
classical intercalative mode.
5. ACKNOWLEDGEMENTS
The authors thank DST-FIST for funding, Dept. of Microbiology, Osmania University for antibacterial studies.
REFERENCES
1. Siddiqui,N., Ahuja, P., Pandeya, S.N., Ahsan, W. J. Chem Pharm Res., 1: 19-30 (2009). 2. Singh,A.K., Mishra, G., Jyoti, K. J.Appl. Pharm Sci., 1:44-49 (2011).
3. Singh, A.K., Mishra, G., Jyoti, K. J.Appl. Pharm Sci., 1:44-49 (2009). 4. Singh, A.K., Mishra, G., Jyoti, K. Int J.Chem Tech Res., 3:1380-1393 (2011). 5. Shakya, A.K.,Kamal, M., Jawaid, T. Int J.Biomed., 2:41-61 (2011).
6. Rai, A.K., Kushwaha, N., Kushwaha, S.K.S. Int J.Chem Tech Res., 4:517-531 (2011). 7. Gupta, J.K., Dudhey, R., Sharma, P.K. Medichem online., 1:1-9 (2010).
8. Singh, A.K., Ahmad, T. Int Res J.Pharm., 3:70-82 (2012).
11. Kemal SANCAK, Yasemin UNVER, Mustafa ER., TURK J.Chem., 3:125-134 (2007). 12. Xiao-ke zheng, Hong Sun, Xiao-Qing Shen and Hong-Ying Wang. Synthesis and
reactivity in inorganic, Metal-organic and Nano Metal Chemistry., 37: 661-664 (2007). 13. Anjali Uha., Durga, G., Sanyal,U.,Murthy, Y.L.N., Med Chem Res.,21:2548-2556 (2012). 14. Joshua A. Obaleye., Johnson F. Adediji and Matthew A.Adebayo. Molecules., 16(7):
5861-5874 (2011).
15. Wojahn, Hans; Wuckel, Hildebert., Archiv, der Pharmazie and Berichteder Deutschen Pharmazeutischen Gelleschaft., 284, 53-62 (1951).
16. Rajeev, S. Kumar, D. Bhoop, S. Singh, V.K. and Sharma, R. Research Journal of
Chemical Sciences., 3(2), 79-84 (2013).
17. Kumar, D. Singh, R. Sharma, R. and Goswami, Y.C. Arabian Journal of Chemistry., DOI:10.10ma 16/j.arabjc.2014.10.022 (2014).
18. Sutcliffe, B. T. and Smith, S. J. Reviews in Computational Chemistry., 70,271–316 (1997). 19. Cramer, C.J. Essentials of Computational Chemistry: Theories and Models (NJ: John
Wiley & Sons, 2002).
20. Amir Azam, Attar Salahuddin, Shadab Miyan Siddiqui, Med Chem Res., 22: 1305-1312 (2013).
21. Irving, H .M. and Rossotti, H.S. J.Chem. Soc., 2904 (1954). 22. Irving, H.M. and Rossotti, H.S. Acta. Chem Scand., 10:72 (1956).
23. Vogel.A.I., "AText Book of Quantitative Inorganic Analysis" 3rd Ed. Longman Elbs, London (1968).
24. Nakamoto. K, Infrared spectra of inorganic and coordination compounds 2nd edition (New york ; wiley Interscience) (1970).
25. Pedro I da S.maia and Fernando R. Pavan, Clarice Q.F. Leite, Sebastiao S.Lemos, Gerimario F DE Sousa, Alzir A Batista, Otaciro R Nascimento, Javier Ellena, Eduardo E Castellano, Elke Niquet, Victor M Deflon. Polyhedron, 28:398 (2009).
26. Azha. Periasamy, S.Muruganand and M. Palaniswamy. Rasayan J.Chem., 2(4):981-989 (2009).
27. Cotton F A and Wilkinson G, Advanced inorganic chemistry, 5th edn (John Wiley and sons, Newyork), 488 (1988).
28. Lever A B P. Inorganic electronic spectroscopy 2nd edn (Amsterdam; Elsevier) (1984). 29. Maurya MR, Kumar A, Bhat AR, Azam A, Bader C, Rehder D, Inorganic Chemistry,
45:3, 1260-1269 (2006).
30. Swamy S J., Dharma reddy D. and Bhaskar K., Indian Journal of Chemistry, 40A, 1166-1171 (2001).
31. Li D.D., Tian J., Gu W., Liu X., Yan S. J.Inorg Biochem., 104:171-179 (2010). 32. Wolfe A., Shimer G.H., Meehan T. Biochemistry, 26, 6392 (1987).
33. Anupama B., Ushaiah B., Gyana kumari C., Shiva Leela, D., Sunita M. J.Fluoresc., 24(4): 1067-76 Jul, (2014).
35. Castiñeiras A., Alzuet G., Borrás J., García-Giménez J.L., Gonzáles-Alvarez M., Liu-Gonzáles M. J. Inorg. Biochem., 103: 243-255 (2009).
36. Macías B., Alzuet G., Borrás J., García-Giménez J.L., Gonzáles-Alvarez M., Liu-Gonzáles M. J. Inorg. Biochem., 103: 923-934 (2009).