University of Kentucky Doctoral Dissertations Graduate School
2006
INFORMATION SYSTEM CONTEXTUAL DATA QUALITY: A CASE
INFORMATION SYSTEM CONTEXTUAL DATA QUALITY: A CASE
STUDY
STUDY
Daniel Lee Davenport
University of Kentucky, [email protected]
Right click to open a feedback form in a new tab to let us know how this document benefits you. Right click to open a feedback form in a new tab to let us know how this document benefits you.
Recommended Citation Recommended Citation
Davenport, Daniel Lee, "INFORMATION SYSTEM CONTEXTUAL DATA QUALITY: A CASE STUDY" (2006). University of Kentucky Doctoral Dissertations. 277.
https://uknowledge.uky.edu/gradschool_diss/277
ABSTRACT OF DISSERTATION
Daniel Lee Davenport
The Graduate School University of Kentucky
INFORMATION SYSTEM CONTEXTUAL DATA QUALITY:
A CASE STUDY
______________________________________ ABSTRACT OF DISSERTATION
______________________________________
A dissertation submitted in partial fulfillment of the requirements for the degree of Doctor of Philosophy in the Carol Martin Gatton College of
Business and Economics at the University of Kentucky
By
Daniel Lee Davenport Lexington, Kentucky
Director: Dr. Clyde W. Holsapple
Rosenthal Endowed Chair in Management Information Systems Professor of Decision Science and Information Systems
Lexington, Kentucky
2006
ABSTRACT OF DISSERTATION
INFORMATION SYSTEM CONTEXTUAL DATA QUALITY:
A CASE STUDY
This dissertation describes a case study comparing the effectiveness of two information systems that assess the quality of surgical care, the National Surgical Quality Improvement Program (NSQIP) and the University HealthSystem Consortium Clinical Database (UHCCD). For the comparison, it develops a framework for assessing contextual data quality (CDQ) from the decision maker’s perspective. The differences in quality assessment systems to be studied are posited to be due to the differing contexts in which the data is encoded, transformed and managed impacting data quality for the purpose of surgical quality assessment.
Healthcare spending in the United States has risen faster than the rate of inflation for over a decade and currently stands at about fifteen percent of the Gross Domestic Product. This has brought enormous pressures on the healthcare industry to reduce costs while maintaining or improving quality. Numerous systems to measure healthcare quality have been, and are being, developed including the two being studied. A more precise understanding of the differences between these two systems’ effectiveness in the assessment of surgical healthcare quality informs decisions nationally regarding hospital accreditation and quality-based reimbursements to hospitals.
The CDQ framework elaborated is also applicable to executive information systems, data warehouses, web portals, and other information systems that draw information from disparate systems. Decision makers are more frequently having data available from across functional and hierarchical areas within organizations and data quality issues have been identified in these systems unrelated to the system performance from which the data comes.
The study is a cross-sectional retrospective review of archival quality data gathered on 26,322 surgical patients at the University of Kentucky Hospital along with interviews of process owners in each system. The quality data include patient risk/severity factors and outcome data recorded in the National Surgery Quality Improvement Program (NSQIP) database and the University HealthSystem Consortium Clinical Database (UHCCD).
KEYWORDS: Contextual Data Quality, Data Quality, National Surgery Quality Improvement Program, University HealthSystem Consortium Clinical Database, Workgroup Context.
Daniel L. Davenport
INFORMATION SYSTEM CONTEXTUAL DATA QUALITY:
A CASE STUDY
By
Daniel Lee Davenport
Dr. Clyde W. Holsapple Director of Dissertation Dr. Merl M. Hackbart
RULES FOR THE USE OF DISSERTATIONS
Unpublished dissertations submitted for the Doctor's degree and deposited in the University of Kentucky Library are as a rule open for inspection, but are to be used only with due regard to the rights of the authors. Bibliographical references may be noted, but quotations or summaries of parts may be published only with the permission of the author, and with the usual scholarly acknowledgments.
Extensive copying or publication of the dissertation in whole or in part also requires the consent of the Dean of the Graduate School of the University of Kentucky.
DISSERTATION
Daniel Lee Davenport
The Graduate School University of Kentucky
INFORMATION SYSTEM CONTEXTUAL DATA QUALITY:
A CASE STUDY
______________________________________ DISSERTATION
______________________________________
A dissertation submitted in partial fulfillment of the requirements for the degree of Doctor of Philosophy in the Gatton College of Business and
Economics at the University of Kentucky
By
Daniel Lee Davenport Lexington, Kentucky
Director: Dr. Clyde W. Holsapple
Rosenthal Endowed Chair in Management Information Systems Professor of Decision Science and Information Systems
Lexington, Kentucky
2006
ACKNOWLEDGEMENTS
I wish to acknowledge and thank Dr. Clyde W. Holsapple, Dissertation Director, and Dr. Robert M. Mentzer, Jr., Chair of the Department of Surgery at the University of Kentucky. Their scholarly excellence and leadership helped me throughout this project and continue to inspire me.
The following dissertation used data obtained by two dedicated and skilled nurse reviewers, Ms. Devauna Riley and Ms. Mary Beth Rice, as part of the National Surgical Quality Improvement Program. Data was also obtained from the Clinical Data Products Data Base maintained by the University HealthSystem Consortium.
Table of Contents
ACKNOWLEDGEMENTS ... III
LIST OF TABLES ... VI
LIST OF FIGURES... VII
CHAPTER 1: INTRODUCTION ... 1
CHAPTER 2: BACKGROUND AND SIGNIFICANCE... 3
2.1HEALTHCARE COSTS AND QUALITY... 3
2.2INFORMATION SYSTEMS THAT ASSESS HEALTHCARE QUALITY... 3
2.3AHEALTHCARE QUALITY ASSESSMENT MODEL (THE DECISION MODEL) ... 4
2.4APPLICATION OF THE CASE TO BROADER INFORMATION SYSTEM CONTEXTUAL DATA QUALITY ISSUES... 7
2.5FITNESS FOR USE AND THE CONTEXTUAL QUALITY OF DATA... 10
2.6INFORMATION SYSTEM CONTEXT:WORK COMMUNITIES... 11
2.7WORKGROUP CONTEXT INFLUENCES ON ISPROCESSES... 13
2.8PROPOSITION SUMMARY... 17
CHAPTER 3: METHODS ... 19
3.1STUDY DESIGN... 19
3.2SITE SELECTION... 19
3.3STUDY POPULATION... 19
3.4SUBJECT RECRUITMENT METHODS:... 20
3.5INFORMED CONSENT PROCESS... 20
3.6INTERVIEWS FOR PROCESS DESCRIPTIONS... 20
CHAPTER 4: MEASUREMENTS AND ANALYSIS ... 22
4.1QUALITATIVE ASSESSMENT OF WORKGROUP CONTEXT... 22
4.2DATA COMPARISON AND CONTRAST... 22
4.3DATA TRANSFORMATION ANALYSIS... 22
4.4MEASUREMENT OF OUTCOMES... 22
4.5MEASUREMENT OF CONTEXTUAL DATA QUALITY DIMENSIONS... 23
CHAPTER 5: RESULTS ... 26
5.1UHCCDDATA EXTRACTION AND ENCODING PROCESS... 26
5.2UHCCDMANAGERIAL CONTROL AND FEEDBACK... 28
5.3UHCCDDATA TRANSFORMATION PROCESS... 29
5.5NSQIPMANAGERIAL CONTROL AND FEEDBACK... 32
5.6NSQIPDATA TRANSFORMATION PROCESS... 33
5.7COMPARISON OF PATIENT POPULATION... 34
5.8DIFFERENCE IN DOMAIN COVERAGE... 35
5.9OUTCOME VARIABLE DEFINITIONS... 36
5.10RELEVANCY... 45
5.11COMPLETENESS... 45
5.12VALUE ADDED... 50
5.13TIMELINESS... 52
5.14APPROPRIATE AMOUNT OF DATA... 52
CHAPTER 6: DISCUSSION... 54
6.1WORKGROUP CONTEXT... 54
6.2DATA ELEMENT DEFINITIONS AND ENCODING PROCESSES... 54
6.3MANAGERIAL CONTROL AND FEEDBACK... 56
6.4DATA TRANSFORMATION... 56
6.5IDENTIFICATION OF COMPLICATIONS... 57
6.6CONTEXTUAL DATA QUALITY... 58
6.7RECOMMENDATIONS TO ISMANAGERS AND DECISION MAKERS... 60
6.8RECOMMENDATIONS TO THOSE ASSESSING SURGICAL QUALITY... 61
CHAPTER 7: CONTRIBUTIONS AND LIMITATIONS... 63
APPENDIX A: SYSTEM VARIABLES AND ASSOCIATIONS WITH OUTCOMES ... 65
APPENDIX B: REGRESSION MODELS... 74
REFERENCES ... 87
List of Tables
Table 4.1 Outcome Model Comparison... 23
Table 5.2 A comparison of Counts of Surgical Patients by Service from the Operating Room Log, the NSQIP, and the UHCCD... 35
Table 5.3 Complication Comparisons ... 39
Table 5.4 Reasons for Incongruent Coding Between the Two Systems of Postoperative Acute Myocardial Infarction as a Complication ... 42
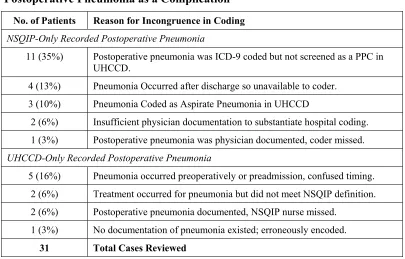
Table 5.5 Reasons for Incongruent Coding Between the Two Systems of Postoperative Pneumonia as a Complication... 43
Table 5.6 Costs and Length of Stay Variation Explained by the Two Datasets... 50
Table 5.7 Added Value: The Number of Significant Variables from Backwards Stepwise Regression Models of the Two Datasets versus Each of the Four Outcomes... 50
Table A.1 UHCCD Model Independent Variables, Correlations (P<0.01) and Strength of Associations (P<0.01) with Outcomes (n=4,221)... 65
Table A.2 NSQIP Model Independent Variables, Correlations (P<0.01) and Strengths of Association (P<0.01) with Outcomes (n=4,221)... 69
Table B.1 NSQIP Mortality Model Summary ... 74
Table B.2 NSQIP Morbidity Model Summary ... 75
Table B.3 NSQIP Costs Model Summary ... 77
Table B.4 NSQIP Length of Stay Model Summary ... 79
Table B.5 UHCCD Mortality Model Summary ... 81
Table B.6 UHCCD Morbidity Model Summary ... 82
Table B.7 UHCCD Costs Model Summary... 83
List of Figures
Figure 2.1 System Model of Factors Influencing Surgical Outcomes (derived from Iezzoni,
2003, Risk adjustment for measuring healthcare outcomes, HAP.)... 5
Figure 2.2 Data Quality Categories and Dimensions. (Wang & Strong, 1996) ... 10
Figure 2.3 Information Systems Reflect Workgroup Ontologies ... 15
Figure 2.4 A Hospital Claims and Medical Records Ontology ... 16
Figure 2.5 The NSQIP Surgical Risk Adjustment Ontology ... 16
Figure 2.6 The IS Contextual Data Quality Model... 17
Figure 5.1 UHCCD System Architecture ... 28
Figure 5.2 NSQIP System Architecture... 33
Figure 5.3 Overlap of Mortality: Occurrences and Rates Resulting from Differing Definitions ... 37
Figure 5.4 Overlap of Morbidity: Occurrences and Rates Resulting from Differing Definitions ... 38
Figure 5.5 Comparison of UHCCD Total Costs and TSI Total Costs for 1,439 General and Vascular Surgery Patients... 44
Figure 5.6 Scatter Plot of UHCCD and NSQIP Mortality Probability Estimates... 46
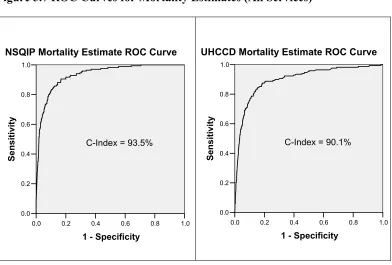
Figure 5.7 ROC Curves for Mortality Estimates (All Services)... 47
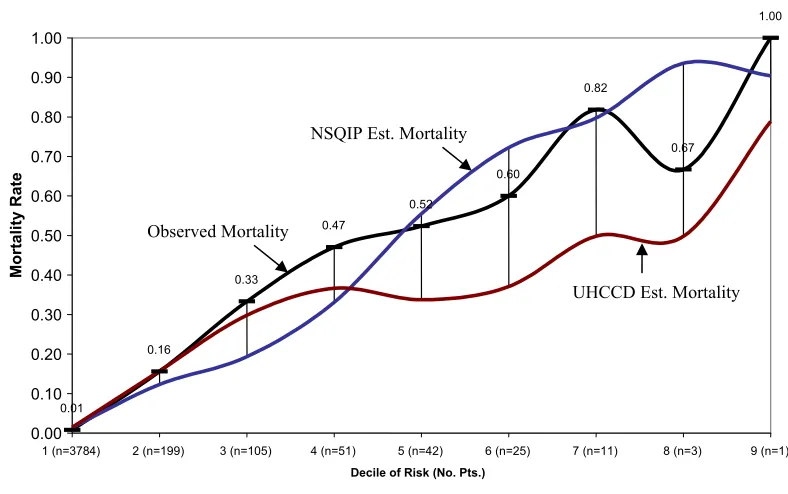
Figure 5.8 Observed Mortality Rates versus NSQIP and UHCCD Estimates by Decile of Risk... 48
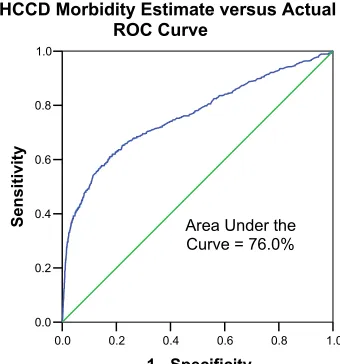
Figure 5.9 ROC Curves for the NSQIP and UHCCD Morbidity Estimates... 49
Chapter 1: Introduction
In 2002, the investigator reviewed five different reports regarding the quality of cardiac surgical care at an academic medical center. These reports were generated from large regional/national information systems that assessed surgical quality in terms of risk-adjusted mortality. Each report produced an assessment of the quality of the hospital’s performance in terms of the number of cardiac patients who died versus an expected death rate based on statistical models in the systems. The assessments varied by a factor of more that two-to-one across the different systems. At the extremes, one report stated that significantly more patients died than would be expected versus another report that stated that slightly fewer patients died than expected (Personal Experience of the Investigator, 2002).
Understanding these report differences is important because: 1) they assess patient death, so the negative results of the worst report cannot be ignored, and 2) one of the reports is in support of a contract with a major payer representing millions of dollars of revenue for the hospital. Which, if any, of the reports accurately depicts the quality of cardiac care at this hospital? Why are the reports so different in their assessments? What should the hospital do regarding these diverse assessments of patient care quality? What should the CEO say to the press if the “bad” report shows up on the front page of the local paper?
This frustrating experience along with the growing national prominence of databases assessing surgical outcomes is one impetus for this research. It compares and contrasts two healthcare quality assessment systems, the National Surgical Quality Improvement Program (NSQIP) and the University HealthSystem Consortium Clinical Database (UHCCD). In doing so, it introduces, explores and elaborates a framework for the evaluation of contextual data quality (CDQ) in information and decision support systems.
are more frequently using the power of networks to take information from legacy systems, once confined to the work community using them, and rapidly distributing it to others outside that community. A review of the data quality literature yields several studies (Koh and Watson, 1998, Ballou and Tayi, 1999, Yoon, Aiken and Guimaraes, 2000, Kumar and Palvia, 2001, Wixom and Watson, 2001, Reed and Catterall, 2005) finding data quality problems related to such systems, with a common theme being issues of context across systems and groups. Given the increasing mobility of data in the current networked age, it is important for decision makers to understand when data from well functioning systems is more or less fit for use for their particular decision.
The two systems studied in this case are well suited for stimulating and elaborating a theory of information system CDQ. There is no evidence that the two healthcare information systems in this case study are not functioning as designed. However, they are managed and used in different contexts. Comparing these two systems yields significant insights into CDQ, the goal of this study.
Chapter 2: Background and Significance
2.1 Healthcare Costs and Quality
Healthcare in the United States is a large business sector and has experienced significant growth in recent years even during the recent recession. Total healthcare expenditures in the United States increased from $1.05 trillion in 1997 to $1.55 trillion in 2002 and per capita expenditures increased from $3,517 to $4,695 (CMS, 2004). As a result, both federal and private payer groups have attempted to reduce costs. Commensurate with the pressures on cost containment has been an increased scrutiny and concern with quality. For example, 160 large insurers and Fortune 500 corporations who purchase and indemnify healthcare have joined together to form the Leapfrog Group whose goal is to “trigger giant leaps forward in the safety, quality and affordability of health care.” (Leapfrog Group, 2004)
2.2 Information Systems that Assess Healthcare Quality
In support of these concerns, numerous systems for measuring the quality of care at hospitals have been, and are being developed. These include, but are not limited to, standards established by the Leapfrog Group mentioned above, accreditation requirements imposed by the national Joint Commission for the Accreditation of Healthcare Organizations (JCAHO, 2004), Center for Medicare and Medicaid Services’ (CMS) standards for premium reimbursement, along with more targeted systems like the University HealthSystem Consortium Clinical Database (UHCCD) and the National Surgical Quality Improvement Program database (NSQIP). These last two are the subjects of this research as they have the same general approach of risk-adjusting outcomes in order to measure quality but derive their data quite differently.
for example, the death and complication rates at the Veteran’s Affairs hospitals performing major surgery have decreased during the last decade while the administration of the NSQIP has occurred. (Fink et al, 2002) As mentioned above, certain standards are mandated by JCAHO for a hospital to stay accredited. (JCAHO, 2004) Recently CMS, the major federal payer for healthcare, has started making premium payments for hospitals that meet certain quality criteria. In addition to financial impact from payers, regulatory compliance, and improved outcomes, the reputation and market viability of providers, both hospitals and clinicians, can be elevated or devastated by positive or negative reports respectively. As an example, early efforts at reporting cardiac surgery outcomes by surgeon in New York State resulted in several surgeons discontinuing their practice in that State. (Harlan, 2001) Given these impacts from quality reporting, a better understanding of the efficacy of information systems that assess quality is critical.
2.3 A Healthcare Quality Assessment Model (The Decision Model)
Quality in healthcare can be assessed in different ways. Three general areas of assessment are those using process, structural, or outcomes variables. (Donabedien, 2003) Process-based quality assessment measures whether a healthcare process known to be effective is implemented or not. An example would be the CMS core quality measure of whether or not patients who are smokers receive smoking cessation counseling while they are in the hospital. The percentage of smokers who do is compared to a national standard. In contrast, structural based assessments use measures such as the number of patients treated for a particular disease at a hospital or whether the ICUs are staffed by full time specialists called intensivists.
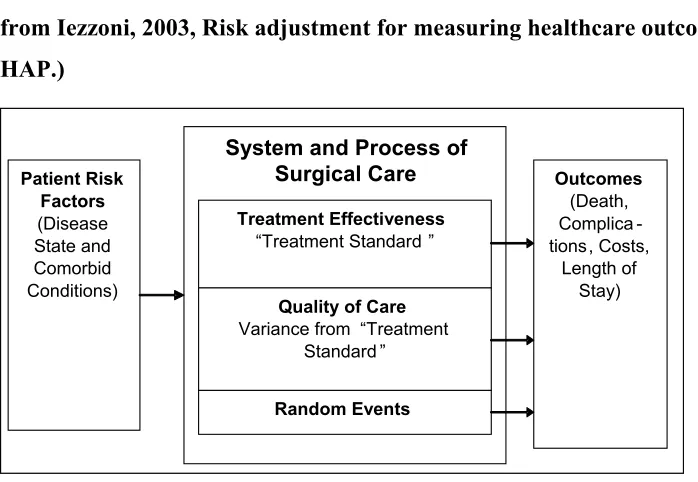
The NSQIP and UHCCD apply the third approach using outcome variables, and are based on Iezzoni’s (Iezzoni, 2003) “algebra of effectiveness.” This formula states that:
Because outcomes depend on patient risk factors, systems that assess quality by measuring outcomes must also adjust for those factors and are called risk-adjustment systems. Figure 2.1 shows a block diagram illustrating the elements of the system model.
Figure 2.1 System Model of Factors Influencing Surgical Outcomes (derived from Iezzoni, 2003, Risk adjustment for measuring healthcare outcomes, HAP.)
Risk adjustment information systems normally apply this model in similar ways. They first identify an outcome of interest from a quality perspective, mortality in surgical patients for example. Next, they examine available patient-related risk factors that have been shown to influence the outcome. Patients with a history of heart disease for example may experience higher rates of complication and death after surgery unrelated to the quality of care provided them. Comparisons in the mortality rates for surgical patients at different hospitals must then control for the occurrence of heart disease in the respective hospitals’ patient populations. Data is obtained for both the risk factors and outcomes across a statistically sufficient sample of patients and hospitals in order to construct regression models with which to compare the outcomes levels.
These models relate the patient risk factors to the outcome of interest. The modeling retains the population mean occurrence of outcomes for a particular
System and Process of Surgical Care Patient Risk Factors (Disease State and Comorbid Conditions) Treatment Effectiveness “Treatment Standard ”
Quality of Care Variance from “Treatment
Standard ” Random Events Outcomes (Death, Complica -tions, Costs, Length of Stay) System and Process of
Surgical Care Patient Risk Factors (Disease State and Comorbid Conditions) Treatment Effectiveness “Treatment Standard ”
Quality of Care Variance from “Treatment
patient risk profile and excludes variation related to individual sites. The resulting model is then used to estimate the risk of death or complication for each patient at a site. For mortality models, the individual patient estimates are summed up to predict the number of patient deaths at a particular site. This predicted number of deaths and complicated patients then becomes the standard for judging quality. It estimates the outcomes related to a “standard of care” as measured by the mean national death rate for a given set of patient risk profiles. A variance from this de facto “standard of care” is then due to one of three factors:
1) Random events,
2) The quality of care which includes variation from the standard process/system of care and error, or,
3) A risk factor unaccounted for in the model.
In order to assess the likelihood of variance in the observed to expected performance being due to random events, the model calculates confidence intervals for the estimates at each site. Observed values outside those intervals have a high confidence of being due to real differences caused by quality differences or other unknown factors rather than random events. The confidence intervals are strongly influenced by sample size and the ability for the model to distinguish random versus real differences is reduced for small samples. This has implications for assessing procedure-specific or surgeon-specific quality under this methodology. The models are also affected by the population from which they are drawn.
In terms of factors for which the model accounts, this becomes the area of interest for this study. Different systems use different types and numbers of factors based on the data they contain. Differences in assessments of the same hospital by different systems are then due to:
2. Differences in the populations from which the statistical models are derived.
3. Differences in the data recorded in the systems ability to estimate particular outcomes.
This latter cause is the primary focus of this study.
2.4 Application of the Case to Broader Information System Contextual Data Quality Issues
There are data quality problems associated with pulling data from systems designed for one purpose and using it for another. Executive Information Systems, Enterprise Resource Planning Systems, Data Warehouses, On-line Analytical Processing Systems, and Web Portals pull information from systems existing in different functional areas, managerial levels and locations, and deliver it to disparate users through a network connection. The ability to pull from diverse systems and deliver to diverse users is a challenge from a data and decision quality perspective. Users who own and regularly work with a particular dataset better understand its deficiencies and utilize that understanding when making decisions based on the data. The increased access to information by non-system owner users is part of the reason for an increased awareness of data quality issues. (Ballou & Tayi, 1999)
of the system are also noted by Reed and Catterall (2005) in regards to CRM implementations.
Kumar & Palvia (2001) surveyed 48 firms regarding global EIS’s. They reported that important issues impacting data management of EIS’s were data integrity in feeder data sources, data security and data standards. They found that “business and IT staff in subsidiaries need to agree on common definitions of data entities and attributes (p. 160).” Inconsistencies in data among subsidiaries were common and a recognized problem.
Yoon and Aiken (2000) found similar data quality issues related to data definitions and proposed a new four-dimensional corporate data quality framework. Their dimensions were three common ones; the data value, the data representation, and the data model to which they added a fourth, the data architecture. Data architecture refers to metadata about data models held throughout the organization. It includes “information on relevant entities and attributes, such as their names, definitions, a purpose statement describing why the organization is maintaining information about this business concept, their sources, logical structures, value encoding, stewardship requirements, business rules, models associations, file designs, data uses, specifications, repositories, etc. (p. 6)” Their development of the data architecture dimension is in response to the “increasingly widespread requirement that users interact with multiple systems, and the need for developers to build more highly integrated system” in order to “coordinate data management activities in cross-functional system development and operations (p. 9).” In other words, the data architecture they propose seeks to build contextual information across the institution’s diverse functional areas thereby improving data quality.
These data quality problems could be considered a system design problem, but a study by Wixom and Watson (2001) concludes differently. Their study of data warehouses surveyed 111 pairs of data warehousing managers (system managers) and data suppliers (analyst users) in order to investigate factors affecting data warehouse success. They separated the two outcomes of users’ perceptions of
system quality and data quality. Their results regarding users’ perceptions of
system quality supported the frequently cited positive impact of management support, a champion, allocated resources, and user participation in design. However, these factors, along with design team skills, source systems and development technology were not found to affect perceived data quality in data warehouses. They concluded, “data quality is best explained by factors not included in our model.” In other words, the system can be functioning well and as designed yet still lead to poor data quality for certain users.
Two current trends confirm the importance of data quality in general to corporate America. The first is the number of articles in the business press on data quality (two recent examples are Redman 2005, and MarketWatch: Global Roundup, 2005). The second is the development of a market, since the start of this study, of IS vendors selling “data quality” software. Sales are estimated at $250 million to $300 million annually and growth is expected at 12% to 15% annually in the near future (Bailor, 2005).
This study posits that CDQ is one of the factors that significantly impacts system quality although it is not included in many system analysis models. In this case study of surgical quality assessment, both databases are nationally recognized with no evidence in the literature that the systems are malfunctioning. There is however criticism of the “fit” of the data from hospital and claims administrative systems for the assessment of clinical quality. (Jollis et al., 1993, Green and Wintfeld, 1993, Hannan et al., 1997, Davenport et al., 2005) This criticism leads to the first two propositions for this case study.
Proposition 2: Differences in the two information systems’ effectiveness in risk-adjusting surgical outcomes are not due to system failure, but to differences in the workgroup context in which the data is derived.
2.5 Fitness for Use and the Contextual Quality of Data
In order to better understand contextual data quality issues that are not related to system failures, a user-centric definition of data quality is necessary. One perspective of data is that it is a "good" that is manufactured and then consumed by the user. (Wang & Strong, 1996) From this perspective high quality data are data that enable the user to effectively and efficiently make a decision or execute a task. In other words, quality data is data that are “fit for use” from the perspective of the objectives of the information consumer.
Wang & Strong’s (1996) study of quality from the user's perspective resulted in 4 categories of 15 data quality sub-dimensions or fifteen different ways in which information can be more or less useful to the consumer. They are shown in Figure 2.2.
Figure 2.2 Data Quality Categories and Dimensions. (Wang & Strong, 1996)
The second of these four categories, contextual data quality, has historically been perceived as relevancy and timeliness (Holsapple & Whinston, 1996), the addition of completeness, value-added, and the amount of information are contributions of
Data Quality “Fitness for Use”
Intrinsic Data Quality Believability Accuracy Objectivity Reputation Contextual Data Quality
Value Added
Relevancy
Timeliness
Completeness
Appropriate Amount of Data
Representational Data Quality
Interpretability
Wang & Strong’s study. Contextual data quality, from their perspective, differs from the other three categories in that it is dependent on the context of the user and therefore is not an information system attribute per se but a fit of the IS attributes to the information consumer's particular need. This category of data quality is of particular importance to systems that pull data from across functional and hierarchical boundaries. For instance, the individual dimensions form a significant portion of the E-Quality framework for web-based information put forth by Kim et al. (2005). We apply Wang and Strong’s contextual data quality dimensions when analyzing this case. Application of this dimension takes the form of Proposition 3.
Proposition 3: Differences in the two information systems’ effectiveness in risk-adjusting surgical outcomes are due to differences in their contextual data quality dimensions of added value, relevancy, timeliness, completeness, and appropriateness of the amount of the data in the systems.
We define contextual data quality based on the above discussion as:
The fitness for a particular use of a dataset based on the context in which it was derived.
2.6 Information System Context: Work Communities
mental and physical components. From this perspective, the common repertoire of a community consists of its mutually developed and held knowledge artifacts used in support of its decisions and actions.
Information systems can be viewed as specific examples of knowledge artifacts with physical and cognitive components developed by a particular community in achieving its common goals. As such, information system context can be analyzed in light of community structure to give some indication of when information from the system may have less fitness for use for those outside the community. The community structure elements include the goals and common repertoire elements of language, routines, sensibilities, etc. mentioned above. The two systems compared in this study are embedded in different work community contexts.
2.6.1 The NSQIP Community
The NSQIP was initiated in 1991 by the National Veterans Administration (VA) as the National Veterans Affairs Surgical Risk Study in response to a congressional mandate to demonstrate the quality of care being delivered to veterans. It was designed from the beginning to measure surgical care quality. In 1994, the success of the program resulted in the Veterans Administration expanding it to include all veterans hospitals and it was renamed the National Surgical Quality Improvement Program. (Khuri et al., 1997) The program is managed by the Chief of Surgery inside the Department of Surgery in the various hospitals and data is collected by clinically trained nurse reviewers who report to the Chief of Surgery.
2.6.2 The UHCCD Community
The University HealthSystem Consortium, (UHC) formed in 1984, is an alliance of academic health centers situated mainly in the United States. Its first major project was collective bargaining for the purchase of medical supplies. Its members are hospitals, and UHC provides its 90 full members and 120 associate members with a variety of resources aimed at improving performance levels in clinical, operational, and financial areas. The mission of the UHC is to advance knowledge, foster collaboration, and promote change to help members succeed in their respective markets (UHC, 2004).
The UHC’s Clinical Database developed from its members’ needs for reporting quality information. It pulls much of its data from the hospital administrative and cost accounting systems. In the hospitals, the data is managed by medical records or quality improvement personnel. Clerks on the various wards or trained medical record coders abstract the data from the written medical record.
In comparing the communities around these two databases there are two immediate differences. Historically one database was designed directly to assess quality while the other evolved in its initial use of primarily administrative data. The NSQIP is managed by surgeons primarily, while the UHCCD data is managed by financial or quality improvement managers. These differences are posited to impact the quality of the data through differences in the respective work community’s context.
2.7 Workgroup Context Influences on IS Processes
Given any real world event, an information system can only capture and portray part of the reality and does so based on the ontology of the workgroup that creates and manages it. In this way workgroup ontology represents a significant portion of how workgroup context influences IS processes.
Data in an information system is extracted and coded from a real life event, frequently through a transaction database (i.e., a patient management database). Which data is captured and its associated meaning (data element definition) is a choice made by the initial system designer based on end-user input and then controlled by the system manager and the functional area manager in which the system is used. Managerial control and user practice may not agree with initial system design and may change over time. The data captured is a focused and limited view of the real life event, as seen through the lens of the ontology and context of the work community. This element of the system then becomes a target for analysis of data quality problems related to contextual data quality and results in propositions four and five.
Proposition 4: The systems have different data elements, definitions, and encoding processes which reflect the context of the workgroup using them and affect contextual data quality.
Proposition 5: Managerial control differs in the two systems and affects contextual data quality.
Proposition 6: The systems have different data transformations which reflect workgroup context and affect contextual data quality.
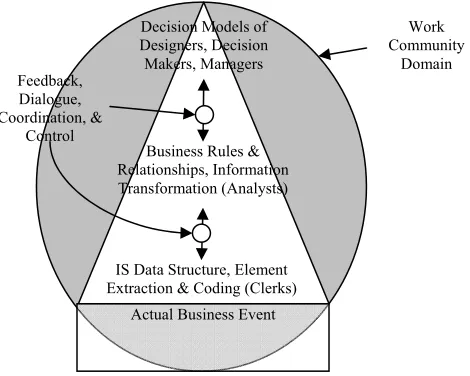
Data extraction, managerial control, and data transformation all result in a particular focused and limited view of a real business event of interest to the system managers and users. This focusing of IS fitness for use, based on the designed and implemented business ontology, is represented by the triangular shape of the IS represented in figure 2.3. In Figure 2.3, the shaded oval represents the business domain of interest to the workgroup. The database structure and the business rules used to transform the data in the IS are the relationships; the data elements are the concepts of the work community’s ontology.
Figure 2.3 Information Systems Reflect Workgroup Ontologies
Users external to the workgroup context with different business ontologies but having an interest in the same real business event will experience a loss of contextual data quality simply due to their differing frame of reference or business context.
In this case study, the UHCCD pulls most of its data from the hospital claims and patient administration databases. The domain of the system is the administrative and financial reporting of the clinical event. The rules and relationships are primarily those of claims accounting with clinical elements. The manager for whom the system is primarily useful is the patient medical records and claims
Actual Business Event IS Data Structure, Element Extraction & Coding (Clerks)
Business Rules & Relationships, Information Transformation (Analysts)
Decision Models of Designers, Decision Makers, Managers
Work Community
Domain Feedback,
Dialogue, Coordination, &
managers who must submit financial claims and provide audit substantiation of those claims to outside regulators. This system ontology is represented in Figure 2.4. Therefore, while the UHCCD contains much clinical data, it is data that was not originally coded and transformed for risk adjusting surgical outcomes.
Figure 2.4 A Hospital Claims and Medical Records Ontology
In contrast, the NSQIP database was designed specifically for the task of measuring factors that may influence surgical outcomes as well as measuring those outcomes. The NSQIP ontology is shown in Figure 2.5.
Figure 2.5 The NSQIP Surgical Risk Adjustment Ontology
Patient Care in the Hospital Medical Record Documentation & Claim
Extraction & Coding (Clerks) Claims Submission and
Patient Management Reporting Medically Supported
Claims
Hospital Medical Records & Patient Management Ontology Feedback, Dialogue, Coordination, & Control
Patient Care in the Hospital Medical Record Documentation & Case
Quality Extraction (Nurses) Patient Care and Outcomes
Modeling Comparative Assessment of Surgical
From an ontology view of information systems, the UHCCD data is expected to have less contextual data quality for the risk adjustment of surgical outcomes compared to the NSQIP.
2.8 Proposition Summary
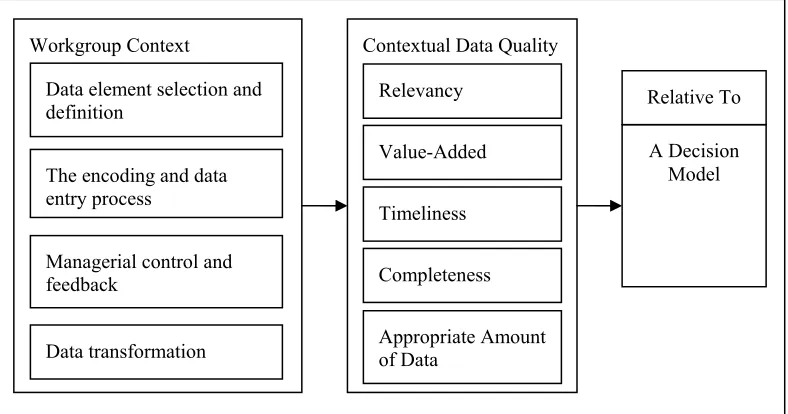
The propositions stated above are summarized in Figure 2.6. Workgroup context influences data selection and definition, the data entry and encoding process, managerial control and feedback, and data transformation. These in turn influence contextual data quality relative to a particular decision model.
Figure 2.6 The IS Contextual Data Quality Model
Proposition 1: The systems are not equally effective in risk-adjusting surgical outcomes.
Proposition 2: Differences in the two information systems effectiveness in risk-adjusting surgical outcomes are not due to system failure, but to differences in the workgroup context in which the data is derived.
Proposition 3: Differences in the two information systems’ effectiveness in risk-adjusting surgical outcomes are due to differences in their contextual data quality
Contextual Data Quality Workgroup Context
Data element selection and definition
Managerial control and feedback
Data transformation
Relevancy
Value-Added
Timeliness
Completeness
Appropriate Amount of Data
A Decision Model Relative To
dimensions of added value, relevancy, timeliness, completeness, and appropriateness of the amount of the data in the systems.
Proposition 4: The systems have different data elements, definitions, and encoding processes which reflect the context of the workgroup using them and affect contextual data quality.
Proposition 5: Managerial control differs in the two systems and affects contextual data quality.
Proposition 6: The systems have different data transformations which reflect workgroup context and affect contextual data quality.
Chapter 3: Methods
3.1 Study Design
This study is a cross-sectional retrospective review of archival quality data gathered on major surgical patients as part of normal activities at the University of Kentucky Hospital. The quality data are numerous variables that measure the preoperative risk of poor outcomes and severity of illness along with the patient outcomes of mortality, complication, length of stay and costs. These data are taken from the National Surgery Quality Improvement Program (NSQIP) database and the University HealthSystem Consortium Clinical Database (UHCCD). The study also includes interviews of the system process owners of the various workgroups involved with a qualitative analysis of their responses.
3.2 Site Selection
The University of Kentucky Hospital (UKH) provides unique characteristics for the study of surgical outcome risk adjustment. It is a pilot site for expansion of the NSQIP from the Veteran’s Administration Hospitals into the private sector starting in 1999-2000. As of 2004, there were about 20 non-VA hospitals nationwide using the NSQIP which has recently been targeted for national expansion by the American College of Surgeons. As an academic medical center, it also participates in the UHCCD and therefore is one of the few sites where a direct comparison of the two databases is possible. For the duration of the data collection, the primary investigator was employed at UKH making this a convenience sample that allows for detailed ongoing access to the systems and background information necessary for an in-depth case study (Yin, 1984/2003).
3.3 Study Population
specific distribution was sought with regard to age, gender, ethnicity, or race. No populations specifically identified as vulnerable were studied, although 17 year-old patients were included because of their inclusion in the NSQIP database. The UHCCD has information on all inpatients. This further limits the comparison sample by excluding patients who had surgery, but were discharged the same day and were not admitted to the hospital.
3.4 Subject Recruitment Methods:
All major surgery patients (in- or outpatient) were eligible for inclusion in the NSQIP database and selection occurred in the following manner according to the NSQIP protocol. Patients were randomly selected from the operating room schedule beginning the first day of an eight-day cycle established by NSQIP. The first consecutive 70 patients per eight-day cycle who met the NSQIP criteria for major surgery – those receiving general, spinal, or epidural anesthesia – were eligible for the program. This sampling methodology has historically resulted in an approximately 33% sample of the procedures on the services tracked. The inpatients were expected to have corresponding data in the UHCCD. Clerical and data entry error in the two systems were expected to create a small percentage of cases that would be unable to be matched. Individuals chosen for interviews were the managers and supervisors directly responsible for the data entry personnel for the two systems.
3.5 Informed Consent Process
Due to the large number of subjects included in this study (approximately 15,000 patients), the difficulties in locating many of them, and the minimal risk presented to the study participants, a waiver of informed consent was requested and granted by the Medical Internal Review Board of the University of Kentucky.
3.6 Interviews for Process Descriptions
reconfirmed with the interviewees. During the course of the analysis, particular questions regarding how purpose or process might impact interpretation of the results were referred back to these managers via phone and email.
Chapter 4: Measurements and Analysis
4.1 Qualitative Assessment of Workgroup Context
The process descriptions from the interviews and available documentation were reviewed for elements that appeared by inspection to derive from the work group context. Consideration was given to those that impacted data definition and selection, the data entry process, managerial feedback and control, and data transformation. These are treated as the precursors to differences in the two systems’ contextual data quality.
4.2 Data Comparison and Contrast
How the two systems included cases into the model was explored through an analysis of the process of linking the records in the database. For instance, the NSQIP excludes patients under 17 years of age. The percentage of surgical patients excluded was calculated for this exclusion criterion and for all the others. Additionally, where variables from the two systems appeared by definition and description to measure the same quantity their levels of agreement across cases were measured and graphically analyzed as Venn diagrams. Where significant disagreement occurred, qualitative elements from the IS process interviews (workgroup context) were explored to explain the differences.
4.3 Data Transformation Analysis
The two systems were analyzed for how they transform the data in modeling quality assessment. Qualitative elements from the IS process interviews along with available literature describing the systems were analyzed to support or reject the proposition that data transformation reflected workgroup context and impacted contextual data quality.
4.4 Measurement of Outcomes
measured in the NSQIP where it is defined as one or more of the specific complications tracked. Potentially preventable complications (PPCs) are listed in the UHCCD but morbidity is not expressly defined. The same definition from the NSQIP, one or more complications, was applied to the UHCCD PPCs to obtain a UHCCD measure of morbidity. Costs are not available in the NSQIP but were available in the UHCCD. In the UHCCD costs are modeled using charges and a cost to charge coefficient. These modeled costs were compared to costs obtained from the hospital cost accounting system and used as the outcome. Finally, length of stay was calculated in the UHCCD but not in the NSQIP, although the NSQIP had admission and discharge dates so the calculation was readily made. Table 4.1 shows the outcomes that are immediately available in the two systems.
Table 4.1 Outcome Model Comparison
Outcome Model NSQIP UHCCD
Mortality Yes Yes
Morbidity Yes No
Costs No Yes
Length of Stay No Yes
4.5 Measurement of Contextual Data Quality Dimensions
The work of Wang and Strong in developing contextual data quality dimensions had not yet been implemented in a targeted study, so no prior measurement methodology is available. Given the quality assessment decision model described above, measurement of the five dimensions of contextual data quality related to the individual data elements was performed as follows and represents a new contribution of this study to the literature on data quality:
4.5.1 Relevancy
nominal and ordinal data Cramer’s V; and for nominal and interval data ANOVA and Eta are performed.
4.5.2 Completeness
Completeness is defined as the strength of regression models of the combined variables from each system in predicting the four outcomes being studied. For the binary outcomes of morbidity and mortality, the c-index (equivalent to the area under the receiver operating characteristic curve, Harrell et al., 1984) is used, for cost and length of stay, adjusted R2 is used. For mortality and morbidity, the receiver operating characteristic (ROC) curve is graphed for each model’s estimates versus actual occurrence. The case estimates for each system are also summed across deciles of risk. The observed mortality rate of the patients within the individual deciles is graphically compared for each system.
The contextual data quality perspective assesses whether there is sufficient information in terms of breadth and depth of the domain coverage necessary for confident decision-making. This implementation of completeness differs from the normal IS usage, which is limited to evaluating the amount of missing data due to system and process failure. A system that is designed to provide information that it does not (due to failure) could lead to the contextual incompleteness, but in the case being studied, is not theorized to do so. This study focuses on the breadth and depth of domain coverage from the perspective of the decision model.
4.5.3 Value Added
4.5.4 Timeliness
Timeliness is defined as the availability of the final transformed data to the decision maker within a quality improvement context. However, there are no direct time elements of the decision model used in this study with which to evaluate timeliness. Therefore timeliness is discussed qualitatively for the two systems but not measured quantitatively or compared.
4.5.5 Appropriate Amount of Data
The appropriate amount of data is measured as the statistical power based on sample size of the resulting models. Increasing the amount of data available for a decision model increases the confidence of the resulting decisions. Linking the records for direct comparison, however, results in exclusion of significant portions of both datasets. This limits the ability to directly compare statistical power and therefore the amount of data is discussed qualitatively, but not measured or compared.
Chapter 5: Results
5.1 UHCCD Data Extraction and Encoding Process
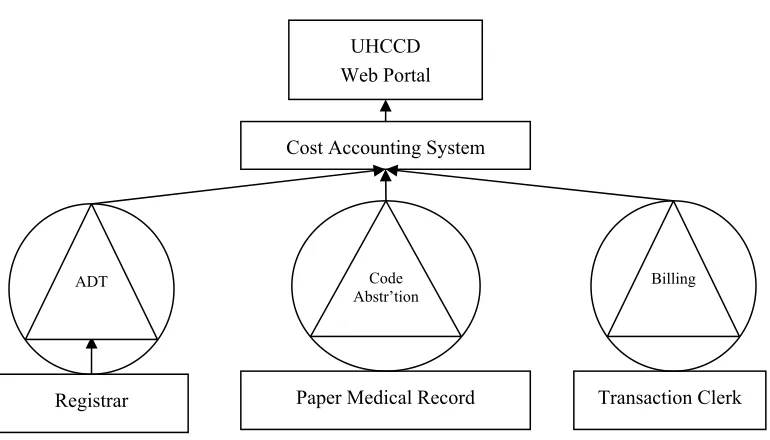
At UKMC, similarly to most hospitals, certified coders who are members of the medical records department review the medical record of virtually every patient after discharge and determine a single primary, and possibly multiple secondary, diagnoses (up to 16 in total are transmitted to the UHCCD). The primary diagnosis coded reflects the reason for admission to the hospital, not necessarily the eventual most acute condition of the patient. For example, a patient who is admitted for treatment of a urinary tract infection but is found to have cancer during the course of his/her stay will have the urinary tract infection listed as the primary diagnosis. A principal and possibly multiple secondary surgical procedures (up to 15 in total are transmitted to the UHCCD) are also coded.
The medical records department then uses a vendor-provided software package (3M Coding and Reimbursement System) that classifies the patient into one of over 500 diagnostic related groups (DRGs). In most cases, the primary diagnosis and procedure determine the DRG. In some cases, secondary diagnoses that are considered comorbid conditions or complications (CCs) of the primary diagnosis and procedure change the DRG. These changes may increase reimbursement. The DRG codes are used by Medicare, Medicaid, and Blue-Cross/Blue-Shield, (together greater than 50% of UKMC’s business by charge dollars) among other payers to calculate reimbursement for services. Thus the DRG-calculating algorithms are designed to maximize reimbursement. Finally, the medical records coders also extract the discharge status of the patient from the medical record. Discharge status is coded as the destination of patient at discharge or if expired. Discharge to a long term care facility like a nursing home can reduce the reimbursement to the hospital from some payers in some DRGs because the reimbursement is shared with the destination facility. Prior to October 1, 2005, twenty of the 500+ DRGs were affected by discharge status. (Interviews with process owners)
Figure 5.1 UHCCD System Architecture
5.2 UHCCD Managerial Control and Feedback
Process owners of the internal systems were interviewed regarding the focus of control efforts and monitoring of the performance of the staff encoding and entering data. In each case, the audits performed on a regular basis indicate what elements and processes of data encoding and entry are reinforced through measurement and feedback to the staff. The registration system is audited regularly with a focus on proper identification of the patient and the amount of accurate insurance information captured in support of billing.
The most significant data come from the coding abstraction system. The principal and secondary diagnoses and procedure codes in the system are audited on a yearly basis by federal auditors. A random sample of patient bills is selected and the medical charts reviewed to determine if sufficient physician medical documentation exists to support the submitted bills. The standard of documentation is based on legal judgments that have historically been applied in resolving fraud claims. The body of these rulings is discussed and applied by the national association for coders. However, no official complete manual of definitions exists regarding documentation sufficiency related to all ICD-9 codes. Given the potential for fraud litigation, coders are under the dual pressures to code
Paper Medical Record
Registrar Transaction Clerk
Cost Accounting System UHCCD Web Portal
ADT Code
sufficiently to maximize billing, but also conservatively in regards to sufficient physician documentation to justify the billing.
5.3 UHCCD Data Transformation Process
The UHCCD calculates three subsets of data based on the primary and secondary diagnoses and procedures coded. These are Comorbid Conditions, Potentially Preventable Complications, and All Patient Refined Diagnosis Related Groups (APR-DRGs). The APR-DRGs also have a secondary variable calculated called the Severity of Illness index. The comorbid conditions are diagnoses that are considered likely to be chronic conditions present in the patient at admission and represent an increase in risk of poorer outcomes or higher severity of illness in the patient. Some secondary diagnoses could be present at admission or develop in the hospital during the course of treatment and represent complications of the care delivered. These diagnoses are not considered for selection as comorbid conditions. The logic for the selection is based on work by Iezzoni et al. (1994 Oct).
Conversely, the potentially preventable complications are the secondary diagnosis codes that are considered unlikely to have been present at admission and more likely to have developed or been caused during the course of treatment. The algorithms making the selection were first developed by Iezzoni et al. (1994 Jul) under funding from the United States Agency for Healthcare Research and Quality. The UHCCD uses these PPCs to screen out patients in the cost and length of stay modeling process whose outcomes may have been caused partially by errors or poor quality care. Patients with PPCs are not included in the population from which the models are derived. The UHCCD does not develop models for risk adjusting morbidity from the PPCs, but does provide them to their sites with designations as complications (UHC, 2005).
each DRG, it then looks at the secondary ICD-9 diagnoses and utilizes an 18 step algorithm separated into three phases to determine a Severity of Illness (SOI). This measure has four possible values which are minor, moderate, major, and extreme (Averill et al., 2003). A second variable, Risk of Mortality, is also calculated by the APR-DRG grouper software but is not used in the UHCCD to model mortality. (UHC, 2005) The APR-DRG SOI algorithm is quite complex, proprietary, and unique for each of the APR-DRGs. In general, specific relationships between the secondary diagnoses/procedures and the primary diagnosis and procedure which indicate more severe illness result in a higher SOI. Interaction between multiple secondary diagnoses, in particular from different organ and disease groups, increases SOI. Additionally, combinations of specific primary and secondary procedures result in a higher SOI.
One of the steps of note in the algorithms is that mechanical ventilation is considered a secondary procedure and prolonged mechanical ventilation increases SOI for some APR-DRGs. It is unclear from the available literature regarding the algorithms how other minor procedures performed in the ICU or at the bedside would impact SOI but may similarly increase the SOI level. Thus SOI may be increased by the presence of particular secondary diagnoses related to the primary diagnosis if it indicates increased severity and by minor procedures such as ventilation. These may be considered complications in the NSQIP dataset and represent a major challenge to the direct comparison of the two datasets in assessing outcomes. If the SOI includes significant information regarding what are considered complications, it will provide positive bias in the estimation of morbidity and in morbidity-related length of stay and costs. This is discussed in greater depth in the discussion section.
not included in this study, additional variables are used in the modeling process. If sufficient data is not available for effective modeling the mean rates of the outcomes by SOI are used rather than the regression model.
5.4 NSQIP Data Extraction and Encoding Process
In the NSQIP at UKMC, Nurse Reviewers who are registered nurses follow an established protocol for selecting and abstracting information regarding surgical patients. The program provides initial standardized training for the nurses and a user manual. The user manual describes the protocol in detail and it also lists detailed clinical definitions of the preoperative, intra-operative, and postoperative variables to be encoded by the nurse reviewer. The nurses randomized patient selection at UKMC by taking the first 70 major surgery patients on six services from the operating room schedule every eight days that matched the inclusion criteria. Using an eight-day cycle ensured a different daily operating room schedule was included as the majority of cases in consecutive cycles which randomized the service representation in the data.
The operating room (O.R.) scheduling information is transmitted electronically every eight days as an attached ASCII report. Included are the patient’s name, gender, date of birth, and registration number, the date of surgery, the type of surgery (elective, urgent, emergent), the primary service performing the surgery, the anesthesia type, a list of up to six surgeon hospital identifiers, a list of up to 15
Current Procedural Terminology (CPT, American Medical Association) procedure codes, and the time the patient entered the operating room. Procedures are normally CPT coded by the Attending Surgeon in the O.R. CPT codes exist for all physician services and are different from the ICD-9CM codes used for hospital coding of procedures. A hard copy of the O.R. log, a form documenting this information signed by the attending surgeon attesting to their presence, is also obtained weekly by the nurses.
automatically excludes patients under 17 years of age and all non-major surgical cases. “Major” surgery is defined by those procedures having general, epidural, or spinal anesthesia along with some monitored anesthetic (MAC) procedures. Additionally, some procedures that are very low risk as determined by the NSQIP are excluded by their CPT code. The primary diagnosis is listed on the O.R. log as well using ICD-9CD codes. At UKMC, patient data are then excluded for services other than General Surgery, Neurosurgery, Orthopaedics, Plastic Surgery, Thoracic Surgery, and Vascular Surgery.
The nurses obtain lists of admissions due to trauma from the trauma office in the hospital. They then exclude any cases performed during those admissions. They examine the various CPT codes to ensure that a case is not excluded when it has an excluded CPT code as the primary procedure but a more extensive included CPT code as a secondary procedure. The NSQIP methodology has been described in detail by Fink et al. (2002).
For each patient, the nurse reviewers examine the entire medical record looking for predefined clinical elements including 60 preoperative risk factors, 18 intraoperative factors, and 29 postoperative complications (including death) for 30 days postoperatively. Information after discharge is obtained through hospital and clinic medical document review as well as follow-up contact by letter and phone. These values are entered onto a paper form while being encoded and then directly into a web portal.
5.5 NSQIP Managerial Control and Feedback
medical record description of a particular patient. The nurses are then required to abstract the preoperative, intra-operative and postoperative variables for that patient. They submit the results back via email and they are scored and discussed on the conference call involving the other nurse coordinators and the national nurse coordinator. The conference calls also address common problems related to application of the definitions to specific patients, general information to the nurse reviewers regarding the program, and modifications to the protocol and variables as they occur. Finally, the annual site visits consist of an auditor encoding information from 20 surgical cases and then comparing it with the information submitted by the nurse reviewer. The auditor reviews the discrepancies with the nurse reviewer and reports the findings to the site program director.
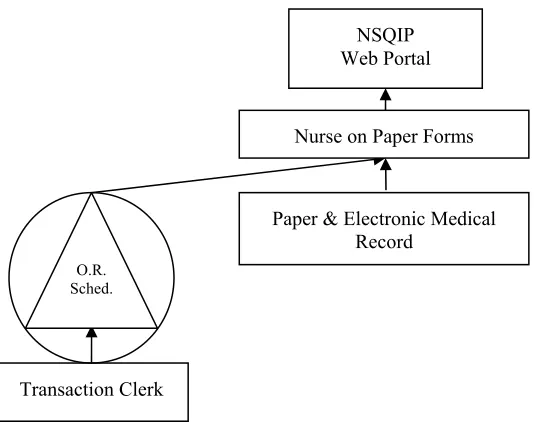
The system diagram for the NSQIP data is shown in Figure 5.2.
Figure 5.2 NSQIP System Architecture
The resulting data variables in the NSQIP are shown in Table A.2 in Appendix A along with their correlations or strengths of association with the four outcomes.
5.6 NSQIP Data Transformation Process
The NSQIP dichotomize many of the lab variables into high or low values for purposes of modeling outcomes. The cutoff points are based on clinically
Paper & Electronic Medical Record
Transaction Clerk
NSQIP Web Portal
O.R. Sched.
accepted values. For each case, the CPT codes are used to calculate the Work Relative Value Units (WRVUs). WRVUs are a measure of the physician work jointly determined by the American Medical Association and the Center for Medicare and Medicaid Services (CMS) used for encoding physician procedural services. They are acquired nationally by the analysis center and are available online from the CMS (http://www.cms.hhs.gov/regulations-/pfs/2004/). They are applied to each of the CPT codes submitted for a particular operation and the maximum value is retained as a measure of the complexity of the operation. The preoperative factors and the WRVUs are then entered into separate regression models for each specialty. The preoperative and perioperative data points along with their association or correlation with each of the four outcomes are shown in Table A.2 in Appendix A.
5.7 Comparison of Patient Population
Surgical patients are identified differently in the two databases. In the UHCCD they are identified as any patient having a surgical DRG or an operating room charge to the patient account. In the NSQIP they are determined by the operating room schedule. Additionally the NSQIP excludes patients under 17 years old, procedures performed during an initial admission related to trauma, transplants, and minor procedures. Major operations are defined as procedures requiring general, epidural, spinal and some monitored anesthetic sedation (MAC) cases. Procedures considered minor are excluded via a list of exclusion Current Procedural Terminology (CPT, American Medical Association) codes.
15,456 surgical admissions or 59% if each admission only had one case. This is not true for patients who return to the operating room during the same admission, but gives an approximation of the coverage in the database.
Table 5.2 A comparison of Counts of Surgical Patients by Service from the Operating Room Log, the NSQIP, and the UHCCD.
Specialty O.R. Log NSQIP UHCCD
Gastroint. Surgery 2,274 a 829
Oncologic Surgery 2,672 a 738
Trauma 2,024 a 3,097
General Surgery Total 6,970 3,329 4,664
Neurosurgery 4,353 1,886 4,138
Orthopaedics 10,024 2,809 3,176
Plastic Surgery 3,008 738 920
General Thoracic 375 396 1,672b
Vascular Surgery 1,592 584 886
All Specialties 26,322 9,742 15,456
a
NSQIP includes Gastrointestinal Surgery, Oncologic Surgery and Trauma Surgery services within General Surgery.
b UHCCD Cardiothoracic Service which includes cardiac cases in addition to General Thoracic
cases.
5.8 Difference in Domain Coverage
The process of linking the two databases by medical record number and date of admission reveals the differences in domain coverage between the two datasets. The linking results in 4,618 operative cases occurring during 4,283 patient admissions. 397 cases were within 30 days of a prior case so are excluded to avoid ambiguity in assignment of outcomes. These deleted cases include 62 patient admissions where the case is secondary to a prior admission’s case resulting in 4,221 unique case/admissions. The incongruence between the two databases and the total cases from the O.R. log results from:
b) the exclusion of minor and some low-risk procedures by the NSQIP, (15.1%)
c) the exclusion of Trauma cases by the NSQIP, (17.5%)
d) the exclusion of Minors (<17 yrs old) by the NSQIP, (6.8%)
e) the exclusion of secondary cases within 30 days by the NSQIP, (0.8%)
f) the exclusion of outpatient procedures by the UHCCD. (Estimated per NSQIP database at 54.8%)
Total exclusions from NSQIP are 63.3% resulting in a 36.7% sampling rate of all cases performed on these services; exclusions from the UHCCD are estimated at 54.8% resulting in a 45.2% sampling. If the NSQIP and the UHCCD inclusion criteria were completely independent we would expect to have had 16.6% (36.7% x 45.2%) overlapping inclusion of the O.R. log cases. The data linked for 4,618 out of 26,322 (17.5%) of the O.R. log cases; 0.9% more than expected from independent exclusions. Because the exclusion of minor cases by the NSQIP would have correlated with more outpatient procedures, the exclusions are not completely independent and the slightly higher than predicted number of matches is reasonable.
5.9 Outcome Variable Definitions
5.9.1 Definition of Death in the Two Databases
to the definitional differences above. There is disagreement between death rates depending on whether death is defined narrowly as meeting both criteria (2.9% mortality rate), or broadly meeting either criteria (4.0% mortality rate). For the purposes of analysis, death in either database will be used.
Figure 5.3 Overlap of Mortality: Occurrences and Rates Resulting from Differing Definitions
5.9.2 Definition of Morbidity in the Two Databases
Morbidity is defined in this study as a patient having one or more identified complications. The two systems differ in the number and types of complications identified. Unlike mortality, where the differences are relatively small in percentage and readily justifiable by the differing time periods, the differences in morbidity in the two databases are much greater and less justifiable. The differences in identified groups of morbid patients are shown in Figure 5.4.
BOTH 121 (2.9%)
UHCCD Only
10 (0.2%)
NSQIP Only
38 (0.9%)
UHCCD 131 (3.1%) NSQIP
159 (3.8%)
Figure 5.4 Overlap of Morbidity: Occurrences and Rates Resulting from Differing Definitions
The two systems disagree, more than agree, on the labeling of patients who experienced complications. The UHCCD includes almost twice as many patients in this category as the NSQIP. Of the patients with complications listed only in the UHCCD, 346 out of 571 (61%) are in the non-specific categories of
Miscellaneous Complications, or Other Complications of Procedures. The number of complications experienced by a patient recorded by the two system had a Pearson’s correlation of 0.481 (P <0.001). Because of the number of different possible complications in both databases, a comparison by individual complications is shown in Table 5.3.
BOTH 328 (7.8%)
UHCCD Only 571 (13.5%)
NSQIP Only
233 (5.5%)
UHCCD 899 (21.3%) NSQIP
561 (13.3%)
39
Table 5.3 Complication Comparisons
NSQIP Complication Description NSQIP
Only N (%)
Both N (%) [% Agreement]
UHCCD Only N (%)
UHCCD Potentially Preventable Complication Description
Any Complication 233 (5.5) 328 (7.8) [28.9] 571 (13.5) Any Complication Cardiac
Cardiac Arrest 32 (0.8) 3 (0.1) [5.0] 24 (0.6) Shock / Cardiorespiratory Arrest Acute Myocardial Infarction 20 (0.5) 4 (0.1) [11.4] 11 (0.3) PO Acute Myocardial Infarction
4 (0.1) PO Cardiac Abnormality Except AMI Central Nervous System
Stroke / CVA 19 (0.5) 0 (0.0) [0.0] 2 (0.0) PO Stroke
Coma > 24 Hrs. 4 (0.1) 0 (0.0) [0.0] 3 (0.1) PO Coma or Stupor Peripheral Nerve Injury 1 (0.0)
7 (0.2) Central or Peripheral Nervous System Respiratory
Pneumonia 138 (3.3) 26 (0.6) [13.4] 30 (0.7) PO Pneumonia
Pulmonary Embolism 9 (0.2) 9 (0.2) [9.9] 73 (1.7) Venous Thrombosis/ Pulm. Embol. Unplanned Intubation 43 (1.0) 53 (1.3) [19.5] 176 (4.2) PO Pulmonary Compromise On Ventilator > 48 Hrs. 55 (1.3) 102 (2.4) [35.9] 127 (3.0) PO Pulmonary Compromise Unpl. Intub. Or On Vent. > 48 Hrs. 89 (2.1) 126 (3.0) [39.6] 103 (2.4) PO Pulmonary Compromise
40
Table 5.3 Complication Comparisons - Continued
NSQIP Complication Description NSQIP
Only N (%)
Both N (%) [% Agreement]
UHCCD Only N (%)
UHCCD Potentially Preventable Complication Description
Urinary Tract Progressive Renal Insufficiency 11 (0.3)
Acute Renal Failure 23 (0.5)
Urinary Tract Infection 121 (2.9) 0 (0.0) [0.0] 7 (0.2) PO Urinary Tract Complication Wound
Superficial Surgical Site Infection 99 (2.3) 17 (0.4) [9.6] 79 (1.9) Wound Infections Deep Surgical Site Infection 19 (0.5) 4 (0.1) [3.6] 92 (2.2) Wound Infections Organ / Space SSI 13 (0.3) 2 (0.0) [1.9] 94 (2.2) Wound Infections Wound Dehiscence 85 (2.0) 17 (0.4) [10.4] 79 (1.9) Wound Infections Either of Four Wound Infections 146 (3.5) 29 (0.7) [11.9] 67 (1.6) Wound Infections
33 (0.8) Cellulitis / Decubitus Ulcer Other
Graft/ Prosthesis/ Flap Failure 9 (0.2) 8 (0.2) [5.1] 139 (3.3) Mech. Compl. Due to Device / Implant DVT/ Thrombophlebitis 17 (0.4) 6 (0.1) [6.0] 76 (1.8) Venous Thrombosis/ Pulm. Embol.
Systemic Sepsis 63 (1.5) 2 (0.0) [2.7] 9 (0.2) Septicemia
Septic Shock