R E S E A R C H
Open Access
Integrating fMRI and SNP data for biomarker
identification for schizophrenia with a sparse
representation based variable selection method
Hongbao Cao
1, Junbo Duan
2,3, Dongdong Lin
2, Vince Calhoun
4,5, Yu-Ping Wang
2,3*From
IEEE International Conference on Bioinformatics and Biomedicine 2012
Philadelphia, PA, USA. 4-7 October 2012
Abstract
Background:In recent years, both single-nucleotide polymorphism (SNP) array and functional magnetic resonance imaging (fMRI) have been widely used for the study of schizophrenia (SCZ). In addition, a few studies have been reported integrating both SNPs data and fMRI data for comprehensive analysis.
Methods:In this study, a novel sparse representation based variable selection (SRVS) method has been proposed and tested on a simulation data set to demonstrate its multi-resolution properties. Then the SRVS method was applied to an integrative analysis of two different SCZ data sets, a Single-nucleotide polymorphism (SNP) data set and a functional resonance imaging (fMRI) data set, including 92 cases and 116 controls. Biomarkers for the disease were identified and validated with a multivariate classification approach followed by a leave one out (LOO) cross-validation. Then we compared the results with that of a previously reported sparse representation based feature selection method.
Results:Results showed that biomarkers from our proposed SRVS method gave significantly higher classification accuracy in discriminating SCZ patients from healthy controls than that of the previous reported sparse
representation method. Furthermore, using biomarkers from both data sets led to better classification accuracy than using single type of biomarkers, which suggests the advantage of integrative analysis of different types of data.
Conclusions:The proposed SRVS algorithm is effective in identifying significant biomarkers for complicated disease as SCZ. Integrating different types of data (e.g. SNP and fMRI data) may identify complementary biomarkers benefitting the diagnosis accuracy of the disease.
Background
Schizophrenia (SCZ) is one of the most disabling and emotionally devastating illnesses. The global median life-time morbid risk for schizophrenia is 7.2/1,000 persons [1]. Genetic factors play an important role in the develop-ment of schizophrenia. To date, over 1000 genes have been reported to associate with SCZ (http://www.szgene. org/default.asp) and many SNPs have been identified as
biomarkers for the disease [2-4]. For example, Kordi-Tamandani et al. showed that that promoter methylation of the CTLA4 gene can increase the risk of SCZ disease [2]. Shayevitz et al. confirmed the gene NOTCH4 as a candi-date gene for schizophrenia with genome-wide association studies (GWAS) [3]. Chen et al. stated that three SNPs spanning the MYO5B gene are significantly associated with SCZ: rs4939921, rs1557355 and rs4939924 [4]. Besides genomic data, fMRI is another widely used data modality in SCZ studies [5][6]. To date, many methods have been pro-posed to integrate multi-types of data in SCZ disease study * Correspondence: [email protected]
2
Department of Biomedical Engineering, Tulane University, New Orleans, LA, USA
Full list of author information is available at the end of the article
[7-11]. For example, Chen et al. proposed parallel indepen-dent component analysis (paraICA) to iindepen-dentify genomic risk components associated with brain function abnormal-ities and detected significant biomarkers from both fMRI data and SNP data that are strongly correlated [7]. Parallel ICA is an effective method for the joint analysis of multiple modalities including interconnections between them [8]. Utilizing this method, Meda et al. detected three fMRI components significantly correlated with two distinct gene components in SCZ study [11]. In this study, a novel sparse representation based variable selection (SRVS) method was proposed and applied to an integrative analysis of two types of data: fMRI and SNP, aiming to obtain comprehensive analysis.
Sparse representation including compressive sensing has been widely used in signal/image processing and computa-tional mathematics [12-18]. Candes et al. showed that stable signal can be approximately recovered from incom-plete and inaccurate measurements [14]. Wright et al. pro-posed a sparse representation based clustering (SRC) for face recognition, demonstrating high classification accu-racy [15]. In our recent works [16-18], we developed novel classification and feature selection algorithms based on sparse representation theory. We applied those methods to gene expression data analysis [16], to chromosome image classification [18], and to joint analysis of different data modalities (e.g. SNP data and gene expression data) [17], and achieved improved classification accuracies as well as better feature selections.
In applications of sparse representation, The availability of a limited number of samples is an important issue (e.g., fea-ture selection and signal recovery) [19][20][21]. According to compressive sensing theory (e.g., the restricted isometry property (RIP) condition [23][24] for signal recovery), the number of available samples should not be less than the number of signals to be selected/recovered. However, the number of features/variables in genomic data (e.g. SNP data) or medical imaging data (e.g. fMRI data) are usually significantly big than the number of samples. In those cases, the traditional methods for compressive sampling cannot effectively analyse the data.
In a recent work, Li et al. [21] developed a voxel selection algorithm for fMRI data analysis. The method was based on sparse representation and is designed to get a sparse solution when sufficient samples exist. However, it may not handle the small sample problem described above.
In this study, a novel sparse representation based vari-able selection (SRVS) algorithm was proposed to select relevant biomarkers from big data sets having small sam-ple sizes. The analysis was obtained by using a window based approach, whose size determines the resolution of the variable selection. We first tested the SRVS algorithm on a simulated data set (size of 100 × 1e6, with 50 cases and 50 controls), demonstrating the multi-resolution
characteristic of the method. Then the algorithm was applied to an integrative analysis of two real data sets: a SNP data set (size of 208 × 759075) and a fMRI data set (size of 208 × 153594). Using the proposed SRVS algo-rithm, biomarkers for SCZ were identified and validated.
Methods
fMRI and SNP data collection
A total of 208 subjects, after signing informed consent, were recruited in the study, including 96 SCZ cases (age: 34 ± 11, 74 males) and 112 healthy controls (age: 32 ± 11, 68 males). Both SNP and fMRI data were collected from each of those 208 subjects. The healthy controls have no history of psychiatric disorders and were free of any medi-cal. SCZ cases met the DSM-IV diagnostic criteria for schizophrenia. After pre-processing, 153594 fMRI voxels and 759075 SNP loci were obtained for the following biomarker selections. Please refer to [22] for detailed description of data collection and pre-processing.
Generalized sparse model
To combine different data sets for integrative analysis, we consider the following model:
y= [α1X1,α2X2]
δ1 δ2
+ε=Xδ+ε (1)
wherey∈Rn×1is the phenotype vector of the subjects; matrix X1∈Rn×p1and X2∈Rn×p2represent data sets of different modalities having normalized column vectors (e.g., || ∗ ||2= 1); X= [α1X1,α2X2]∈Rn×p; α1+α2= 1, and α1,α2>0 are the weight factors for X1and X2 respectively. The measurement errorε∈Rn×1. We aim to
reconstruct the unknown sparse vectorδ=
δ1 δ2
∈Rp×1
based onyand
X
, whereδ
1∈
R
p1×1,δ
2∈
R
p2×1, and p1+p2=p.It can be proven that when p>35n, the matrix X∈Rn×phas the difficulty to satisfy the restricted isome-try property (RIP) condition [24] for signal recovery. In this work,p= 759075 + 153594 = 912669andn= 208. Thus p35n= 7280. To overcome this problem, we propose the SRVS algorithm described as follows.
SRVS algorithm
To best approximateywith the model given by Eq. (1), we consider the followingLpminimization problem:
min||δ||psubject to||y−Xδ||2≤ε (2)
Spare representation base variable selection (SRVS) algorithm (http://hongbaocao.weebly.com/software-for-download.html)
1. Initializeδ(0)= 0;
2. For thelth step, randomly select Xl∈Rn×kfrom
X={x1, . . . ,xp} ∈Rn×p; Mark the indexes of the columns inXlasIl∈R1×k;
3. Solve Eq. (3) to getδl∈Rk×1:
min||δl||p s.t. ||y−Xlδl||2≤ε (3)
4. Update
δ
(l)∈
R
p×1withδ
l:δ
(l)(
I
l
) =
δ
(l−1)(
I
l) +
δ
l;whereδ(l)(I
l)andδ(l−1)(Il)denote theIlth entries inδ(l) andδ(l−1)respectively;
5. If||δ(l)/l−δ(l−1)/(l−1)||
2> α, updatel=l+ 1; go to Step 2.
6. Setδ=δ(l)/l. The non-zero entries inδcorrespond to the columns in Xto be selected.
In Step 3, we sought to solve aL0minimization pro-blem using the OMP algorithm [19]. The OMP has been widely used for signal recovery and approximation [18], [26-30].
It can be proven that, by using the SRVS algorithm, one can identify the significant variables with high prob-abilities. In addition, the SRVS algorithm can be shown convergent for any givenkandε, generating an effective solution for the sparse model specified by Eq. (2). In the following section, we discuss the sparsity control issue to determine the number of variables to be selected.
Sparsity control usingk
In Step 2 of the SRVS Algorithm, we exploit Fisher-Yates Shuffling algorithm [31] with a window of length kto select Xl∈Rn×kfrom X∈Rn×p. The lengthk deter-mines the resolution of the SRVS algorithm. When k=p, the number of variables selected will be generally equal to the sample numbern[23]. The smaller thek, the more the variables selected, and those variables gen-erally include the variables selected with biggerk, as shown in Figure 1. This multi-resolution property enables us to select different number of variables at dif-ferent significance levels.
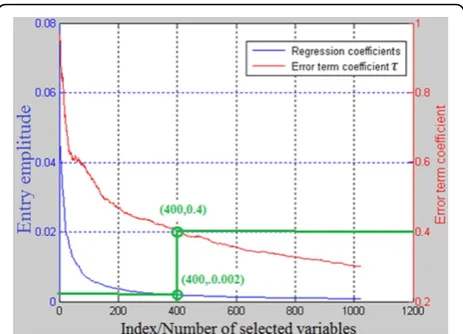
Further sparsity control usingε
The parameterεgiven in Eq. (2) can be used for further sparsity control. The magnitudes of entries ofδreflect the significance of the corresponding columns ofX[21]. Thus, a threshold can be selected forδusing cross-valida-tion [32]. Another way to determine a threshold is using the error termε(as shown in Figure 2), which reflects the residual of||y−Xδ||[20]. Whenε= 0, noises may be involved in the columns selected [20]. In this study, we setε=τ||y||2. From Figure 2, we show that if the first 400 variables with amplitudes larger than 0.002 are
selected (i.e. points (400, 0.002) on‘Regression coeffi-cients’curve), it corresponds to the point (400, 0.4) on the‘Error term coefficient’curve; it indicates that with these 400 variables, the error termε= 0.4||y||2.
Validation
To validate the variable selected using our proposed SRVS algorithm, we compared our selected SNPs and fMRI voxels with that of previous studies. In addition, we used the selected SNPs and fMRI voxels to identify SCZ patients from healthy controls with the sparse represen-tation based classifier (SRC) [15][18]. Then a leave one out (LOO) cross-validation approach was carried out to evaluate the identification accuracy. We compared the classification results with that of Li et al.’s method [21].
Figure 1 Diagram for the sparsity control usingkin SRVS
method.pis the total number of columns/variables. The results
were generated with white noise simulation data set (size 100 × 1e6; 50 cases, 50 controls and 1e6variables).
Furthermore, we compared the results of using variables selected from one type of data and that of both types of data. We also studied the influences of selecting different number of variables.
Result
We applied our SRVS method with the sparse model given by Eq. (1) to an integrative analysis of SNP and fMRI data sets. The results were compared with that of Li et al.’s method under different weighting factors. We also dis-cussed the sparsity control issues usingkandε.
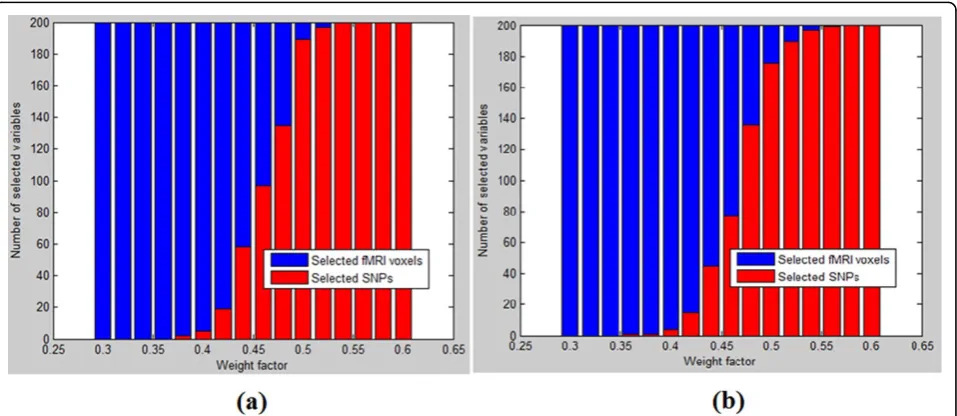
Variable selection with different weight factors
Sparse model given by Eq. (1) with different weight fac-tors were solved by our proposed SRVS method and by Li et al.’s method, respectively, as shown in Figure 3. It can be seen that at the two ends (α1= 0.3 or 0.6), the variables were selected form one type of data.
In each of the 16 trials given by Figure 3, we selected the top 200 biomarkers by our proposed SRVS method and by Li et al.’s method [21]. As shown in Figure 3, the weight factor has similar effects on the variable selection of the two methods. It was interesting to see that even though the number of SNPs was much larger than that of fMRI voxels (759075 vs. 153594), similar number of variables were selected from both data sets when weight factorα1 for SNP data set was around 0.5 (0.46 for SRVS method withL0norms, and 0.47 for Li et al.’s method). This sug-gests that the two data sets may contain similar informa-tion for the SCZ case/control study.
Comparison with Li et al.’s method
We selected 200 variables (SNPs and fMRI voxels) in each trial by our proposed SRVS method and by Li’s et al.’s
method respectively, as shown in Figure 3. However, further study showed that the variables selected by the two methods were significantly different (overlap <10%) (see Figure 4). Thus it was necessary to validate and compare those different groups of variables selected. We first com-pared the selected SNPs and the corresponding genes with the publicly reported SCZ genes for both methods. Then we compared the brain regions identified using those two methods. In addition, we compared the classification accuracies using the variables selected by our proposed SRVS method and Li et al.’s method.
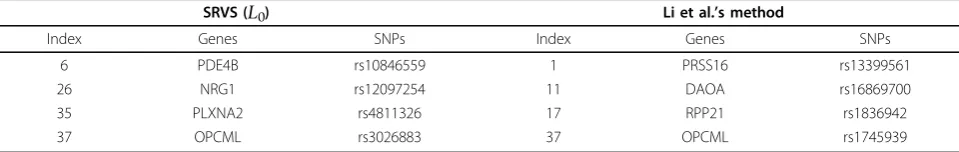
When compared with the top genes reported (see‘Top 45 SCZ genes’in the Additional file 1). For the 16 trials with the top 200 variables selected in each trial, our pro-posed SRVS method and Li et al.’s method identified 4 dif-ferent reported genes, as shown in Table 1. It should be noted that even though both methods can identify gene ‘OPCML’, they recognized the gene through different SNPs (SRVS is by‘rs3026883’and Li et al.’s method is by ‘rs1745939’).
To further compare the two methods at different sparsity level, we studied more top variables in each of the 16 trials. To reach this purpose, we setε= 0.3y2andk= 0.05 for SRVS method. For Li’s method [21], the number of subjects selected in each run was one tenth of total num-ber of subjects; and we set the thresholdθ= 0.01(please refer to [21] for the meaning ofθ). As a consequence, 500 to 800 variables (SNPs and fMRI voxels) were selected in each trial. In this case, our proposed method selected 20 reported genes. For Li et al.’s method, 14 reported genes were located, and 11 of the top 45 genes were iden-tified by both methods [22]. However, the genes ideniden-tified by the two methods have <10% overlaps. For the top 50 genes selected by the two methods, there was only one
gene,CSMD1, was identified by both methods. We listed the top 50 genes and the corresponding SNPs chosen by the two methods in Additional file 2.
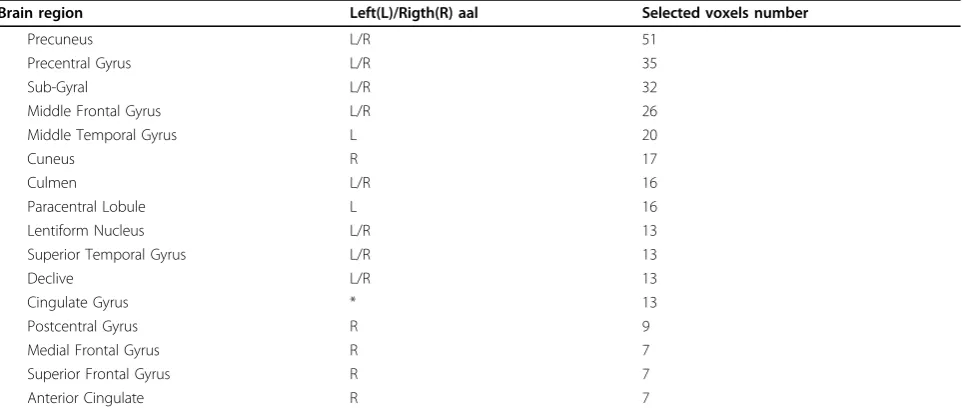
When comparing the fMRI voxels selected (follow the approach shown in Figure 3), we showed that the SRVS method were capable of selecting fMRI voxels that were clustered in specific regions, as shown in Figure 5 (a). Those voxels located within a same region will have high correlations with each other. Therefore the results indicate the capability of our proposed SRVS method in selecting significant biomarkers that are highly correlated. Further study showed that the brains regions selected by our pro-posed SRVS method were mostly reported being asso-ciated with SCZ [33-35], including temporal lobe, lateral frontal lobe, occipital lobe, and motor cortex (see Table 2). However, Li et al.’s method tended to select voxels that were scattered over different brain regions (see Figure 5 (b)). Besides, the brain regions selected by those two meth-ods were largely different from each other. Thus we used multivariate classification approach to evaluate the effec-tiveness of the variables selected by two methods.
Multivariate classification
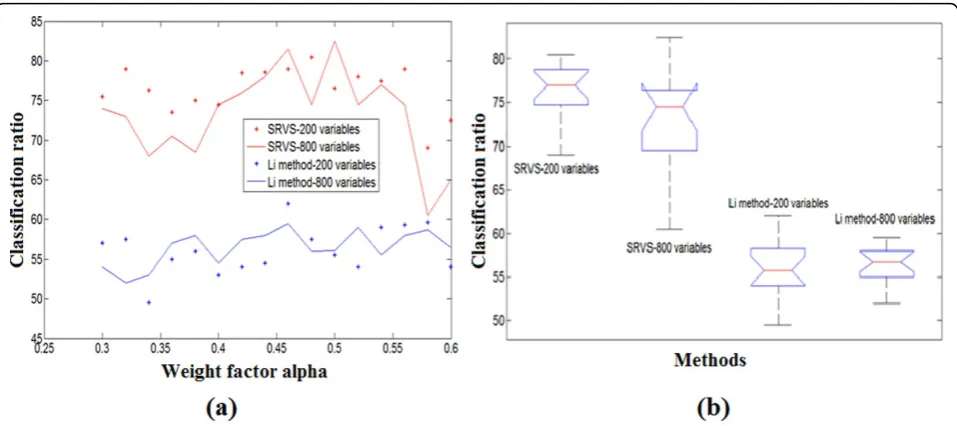
In this study, a LOO cross validation was carried out to evaluate the classification accuracy. In each run of the
LOO validation, one sample was used for testing while the rest ones were used for variable selection. Results were pre-sented in Figure 6. We showed that our proposed SRVS algorithm provided significantly higher classification ratios (CRs) (p−value <1e−11) for both the 200-selected-vari-able case and the 800-selected-vari200-selected-vari-able case. However, using different number of top selected variables showed no significant differences for neither of the two methods (p-value > 0.1).
From Figure 6 (a) we showed that the highest classi-fication accuracy was achieved at the weight factor α1= 0.5, where around equal sized SNPs and fMRI vox-els were selected by the SRVS method. At the two ends (α1= 0.3 or 0.6), the classification accuracies were rela-tively lower. This suggests that using biomarkers from both types of data may lead to better identification accuracy.
Discussion
In this study, we introduced a novel sparse representation based variable selection (SRVS) method, and applied it to an integrative analysis of SNP data and fMRI data. In the case of medical imaging data (e.g. fMRI data) or genomic data (e.g. SNP data), the number of samples tend to be much less than the number of variables (e.g. fMRI voxles; SNP loci). As a consequence, many of those variables are correlated and cannot be identified by traditional sparse signal recovery methods. The proposed SRVS method can identify significant variables with high probability, regardless of the coherence conditions required for exact signal recovery in compressive sensing. For example, significant fMRI voxels functionally correlated (within neighbour brain regions) were identified simultaneously by using our proposed SRVS algorithms (see Figure 5 (a)). This manifests the capability of out proposed SRVS method in handling big data set with small sample sizes.
In addition, the proposed SRVS method can be gener-alized to integrate multiple data modalities for joint ana-lysis and achieve comprehensive diagnosis. As can be seen from Figure 6 (a), the highest classification accuracy was achieved using approximately equal sized variables from both data sets, suggesting that using biomarkers
Figure 4 Comparison of the variables (fMRI voxels/SNPs)
selected in the 16 trails by two different methods.
Table 1 The comparison with the reported first 45 SCZ genes (http://www.szgene.org/default.asp). The Index is the order of the specific gene in the top 45 reported genes list.
SRVS (L0) Li et al.’s method
Index Genes SNPs Index Genes SNPs
6 PDE4B rs10846559 1 PRSS16 rs13399561
26 NRG1 rs12097254 11 DAOA rs16869700
35 PLXNA2 rs4811326 17 RPP21 rs1836942
37 OPCML rs3026883 37 OPCML rs1745939
from both types of data may lead to higher diagnosis accuracy.
Another advantage of the SRVS method is its multiple detection resolutions. By choosing different values of widow lengthkone can select different number of vari-ables at different significance level. Furthermore, the error termεcan be used for further sparsity control of the solu-tionδ, selecting the most important variables. This
multi-resolution characteristic of SRVS provides a flexible vari-able selection approach for big data sets.
When compared to the previous SCZ studies, our method effectively identified more reported SCZ genes than Li et al.’s method. Furthermore, most of the brain regions identified using our proposed SRVS method are previously reported as SCZ associated brain regions. When using the selected variable to identify SCZ patients
Figure 5A comparison of the fMRI voxels selected by using the two different methods. (a) Voxels selected using SRVS method (b) Voxels selected using Li et al.’s method
Table 2 Main brain regions of selected voxels using SRVS method
Brain region Left(L)/Rigth(R) aal Selected voxels number
Precuneus L/R 51
Precentral Gyrus L/R 35
Sub-Gyral L/R 32
Middle Frontal Gyrus L/R 26
Middle Temporal Gyrus L 20
Cuneus R 17
Culmen L/R 16
Paracentral Lobule L 16
Lentiform Nucleus L/R 13
Superior Temporal Gyrus L/R 13
Declive L/R 13
Cingulate Gyrus * 13
Postcentral Gyrus R 9
Medial Frontal Gyrus R 7
Superior Frontal Gyrus R 7
Anterior Cingulate R 7
from controls, our method generated significantly higher classification ratio than Li et al.’s method (Figure 5 (b), p−value <1e−11). Those results demonstrated the effec-tiveness of our method.
Conclusions
Our proposed SRVS is effective in variable selection for complex disease as SCZ. The biomarkers selected generate better identification accuracy than that of Li et al.’s method. When combining information from fMRI data and SNP data for integrative analysis, higher identification accuracy can be achieved, demonstrating the advantage of the combined analysis.
Additional material
Additional file 1: The top 45 schizophrenia genes reported.
Additional file 2: The top 50 genes and the corresponding SNPs
chosen by the two methods proposed SRVS method and Li et al.’s
method.
Competing interests
The authors declare that they have no competing interests.
Authors’contributions
HC and YPW designed research. HC designed the algorithm. HC, JD, DL and VC performed data analysis. All authors read and approved the final manuscript.
Acknowledgements
This work is partially supported by the NIH and NSF.
This work is based on“Bio marker identification for diagnosis of
schizophrenia with integrated analysis of fMRI and SNPs“, by Hongbao Cao
which appeared in Bioinformatics and Biomedicine (BIBM), 2012 IEEE International Conference on.©2012 IEEE [22].
Declarations
The publication costs for this article were funded by the corresponding author.
This article has been published as part ofBMC Medical GenomicsVolume 6 Supplement 3, 2013: Selected articles from the IEEE International Conference on Bioinformatics and Biomedicine 2012: Medical Genomics. The full contents of the supplement are available online at http://www. biomedcentral.com/bmcmedgenomics/supplements/6/S3.
Authors’details
1Unit on Statistical Genomics, NIMH/NIH, Bethesda, MD, USA.2Department of
Biomedical Engineering, Tulane University, New Orleans, LA, USA.
3Department of Biostatistics & Bioinformatics, Tulane University, New Orleans,
LA, USA.4The Mind Research Network, Albuquerque, NM, USA.5Department of Electrical and Computer Engineering at the University of New Mexico, both in Albuquerque, NM, USA.
Published: 11 November 2013
References
1. McGrath J, Saha S, Chant D, Welham J:Schizophrenia: a concise overview of incidence, prevalence, and mortality.Epidemiol Rev2008,30:67-76. 2. Kordi-Tamandani DM, Vaziri S, Dahmardeh N, Torkamanzehi A:Evaluation
of polymorphism, hypermethylation and expression pattern of CTLA4 gene in a sample of Iranian patients with schizophrenia.Mol Biol Rep 2013,40:5123-5128.
3. Shayevitz C, Cohen OS, Faraone SV, Glatt SJ:A re-review of the association between the NOTCH4 locus and schizophrenia.Am J Med Genet B Neuropsychiatr Genet2012,159B(5):477-83.
4. Chen Y, Tian L, Zhang F, Liu C, Lu T, Ruan Y, Wang L, Yan H, Yan J, Liu Q, Zhang H, Ma W, Yang J, Li K, Lv L, Zhang D, Yue W:Myosin Vb gene is associated with schizophrenia in Chinese Han population.Psychiatry Res 2013,207:13-8.
5. Meda SA, Bhattarai M, Morris NA, Astur RS, Calhoun VD, Mathalon DH, Kiehl KA, Pearlson GD:An fMRI study of working memory in first-degree unaffected relatives of schizophrenia patients.Schizophr Res2008,104:85-95. 6. Szycik GR, Münte TF, Dillo W, Mohammadi B, Samii A, Emrich HM,
Dietrich DE:Audiovisual integration of speech is disturbed in schizophrenia: an fMRI study.Schizophr Res2009,110:111-118.
7. Chen J, Calhoun VD, Pearlson GD, Ehrlich S, Turner JA, Ho BC, Wassink TH, Michael AM, Liu J:Multifaceted genomic risk for brain function in schizophrenia.NeuroImage2012,61:866-875.
8. Liu J, Ghassemi MM, Michael AM, Boutte D, Wells W, Perrone-Bizzozero N, Macciardi F, Mathalon DH, Ford JM, Potkin SG, Turner JA, Calhoun VD:An ICA with reference approach in identification of genetic variation and associated brain networks.Frontiers in Human Neuroscience2012,6:1-10. 9. Yang H, Liu J, Sui J, Pearlson G, Calhoun VD:A Hybrid Machine Learning Method for Fusing fMRI and Genetic Data to Classify Schizophrenia. Frontiers in Human Neuroscience2010,4:1-9.
10. Meda SA, Jagannathan K, Gelernter J, Calhoun VD, Liu J, Stevens MC, Pearlson GD:A pilot multivariate parallel ICA study to investigate differential linkage between neural networks and genetic profiles in schizophrenia.NeuroImage2010,53:1007-1015.
11. Liu J, Pearlson G, Windemuth A, Ruano G, Perrone-Bizzozero NI, Calhoun V: Combining fMRI and SNP data to investigate connections between brain function and genetics using parallel ICA.Hum Brain Mapp2009, 30:241-255.
12. Gribonval R, Nielsen M:Sparse decompositions in unions of bases.IEEE Trans Inf Theory2003,49:3320-3325.
13. Tropp JA, Gilbert AC, Muthukrishnan S, Strauss MJ:Improved sparse approximation over quasi-incoherent dictionaries.Proc 2003 IEEE Int Conf Image Process, Barcelona, Spain2003,1:137-140.
14. Candes E, Romberg J, Tao T:Stable signal recovery from incomplete and inaccurate measurements.Comm On Pure and Applied Math2006, 59:1207-1223.
15. Wright J, Yang AY, Ganesh A, Sastry SS, Ma Y:Robust face recognition via sparse representation.IEEE Trans Pattern Anal Mach2009,31:210-227. 16. Tang W, Cao H, Duan J, Wang YP:A compressed sensing based approach
for subtyping of leukemia from gene expression data.J Bioinform Comput Biol2011,9:631-645.
17. Cao H, Duan J, Lin D, Wang YP:Sparse Representation Based Clustering for Integrated Analysis of Gene Copy Number Variation and Gene Expression Data.IJCA2012,19:131-138.
18. Cao H, Deng HW, Li M, Wang YP:Classification of multicolor fluorescence in situ hybridization (M-FISH) images with sparse representation.IEEE Trans Nanobioscience2012,11:111-118.
19. Donoho DL, Elad M, Temlyakov VN:Stable recovery of sparse
overcomplete representations in the presence of noise.IEEE Transactions on Information Theory2006,52:6-18.
20. Cai T, Wang L:Orthogonal Matching Pursuit for Sparse Signal Recovery. IEEE Trans on Inf Theory2011,57:1-26.
21. Li Y, Namburi P, Yu Z, Guan C, Feng J, Gu Z:Voxel selection in FMRI data analysis based on sparse representation.IEEE Trans Biomed Eng2009, 56:2439-2451.
22. Cao H, Duan J, Lin D, Calhoun V, Wang YP:Bio marker identification for diagnosis of schizophrenia with integrated analysis of fMRI and SNPs. Bioinformatics and Biomedicine (BIBM), 2012 IEEE International Conference on: 4-7 October 20122012, 1-6.
23. Li YQ, Cichocki A, Amari S:Analysis of sparse representation and blind source separation.Neural Comput2004,16:1193-1234.
24. Davenport M, Duarte M, Hegde C, Baraniuk R:Introduction to compressive sensing.Connexions Web site2011 [http://cnx.org/content/m37172/1.7/], Apr 10.
25. Donoho DL, Tsaig Y:Fast Solution of L1-Norm Minimization Problems When the Solution May Be Sparse.IEEE Trans on Information Theory2008, 54:4789-4812.
26. Davis G, Mallat S, Avellaneda M:Greedy adaptive approximation.J Constr Approx1997,13:57-98.
27. Tropp JA:Greed is good: Algorithmic results for sparse approximation. IEEE Trans Inf Theory2004,50:2231-2242.
28. Tropp JA:Just relax: Convex programming methods for identifying sparse signals.IEEE Trans Inf Theory2006,51:1030-1051.
29. Barron A, Cohen A, Dahmen W, DeVore R:Approximation and learning by greedy algorithms.Ann Statist2008,36:64-94.
30. Duan J, Soussen C, Brie D, Idier J, Wang YP:On LARS/homotopy equivalence conditions for over-determined LASSO.IEEE Signal Processing Letters2012,19:894-897.
31. Fisher RA, Yates F:Statistical tables for biological, agricultural and medical research.OCLC 14222135London: Oliver & Boyd;, 3 1948, 26-27.
32. Lee H, Lee DS, Kang H, Kim BN, Chung MK:Sparse brain network recovery under compressed sensing.IEEE TMI2011,30:1154-1165.
33. Pascual-Leone A, Manoach DS, Birnbaum R:Goff DC Motor cortical excitability in schizophrenia.Biol Psychiatry2002,52:24-31.
34. Kumari V, Gray JA, Honey GD, Soni W, Bullmore ET, Williams SC, Ng VW, Vythelingum GN, Simmons A, Suckling J, Corr PJ, Sharma T:Procedural learning in schizophrenia: a functional magnetic resonance imaging investigation.Schizophrenia Research2002,57:97-107.
35. Onitsuka T, Shenton ME, Salisbury DF, Dickey CC, Kasai K, Toner SK, Frumin M, Kikinis R, Jolesz FA, McCarley RW:Middle and inferior temporal gyrus gray matter volume abnormalities in chronic schizophrenia: an MRI study.Am J Psychiatry2004,161:1603-11.
doi:10.1186/1755-8794-6-S3-S2
Cite this article as:Caoet al.:Integrating fMRI and SNP data for biomarker identification for schizophrenia with a sparse representation based variable selection method.BMC Medical Genomics20136(Suppl 3): S2.
Submit your next manuscript to BioMed Central and take full advantage of:
• Convenient online submission
• Thorough peer review
• No space constraints or color figure charges
• Immediate publication on acceptance
• Inclusion in PubMed, CAS, Scopus and Google Scholar
• Research which is freely available for redistribution