http://www.sciencepublishinggroup.com/j/ogce doi: 10.11648/j.ogce.20190701.11
ISSN: 2376-7669 (Print); ISSN: 2376-7677(Online)
The Attribute Optimization Method Based on the Probability
Kernel Principal Component Analysis and Its Application
Jingjing Zheng
*, Yun Wang, Chunying Yang
China University of Geosciences, School of Geophysics and Information Technology, Beijing, China
Email address:
*Corresponding author
To cite this article:
Jingjing Zheng, Yun Wang, Chunying Yang. The Attribute Optimization Method Based on the Probability Kernel Principal Component Analysis and Its Application. International Journal of Oil, Gas and Coal Engineering. Vol. 7, No. 1, 2019, pp. 1-6.
doi: 10.11648/j.ogce.20190701.11
Received: November 8, 2018; Accepted: December 6, 2018; Published: January 21, 2019
Abstract:
The principal component analysis (PCA) is the most common attribute optimization analysis techniques, but it is a linear method and exists the problem of lack of probability model and the absence of higher-order statistics information. It has poor comprehensive ability to complex non-linear attributes. Therefore, in order to overcome two shortcomings of the principal component analysis (PCA) and improve the effect of attribute optimization, this paper studies the probability kernel principal component analysis (PKPCA) method which is based on Bayesian theory and kernel principal component analysis (KPCA). First, the sample data are mapped to the high dimensional feature space, then define probability model of the data in high-dimensional space, and finally, expectation maximization (EM) estimated is used to get the best results. This method has both the advantage of probability analysis and kernel principal component analysis (KPCA). It is able to effectively adapt to more complex reservoir conditions and can realize the non-linear probability analysis. The probability kernel principal component analysis (PKPCA) method is applied to reservoir prediction of the Southern oil fields in China. The predicted results show that the method can improve the precision of the attribute optimization, while improving the accuracy of the forecasts of reservoir.Keywords:
Kernel Principal Component Analysis, The Probability Analysis, Kernel Function, Attribute Optimization Analysis, Reservoir Prediction1. Introduction
In recent years, seismic attribute analysis has become an important mean for people to understand and monitor oil and gas reservoirs, mainly because it can effectively reflect the lithology and physical properties (such as porosity, permeability, shale content, oil saturation, etc.) information contained in seismic data. The sensitivity of different seismic attributes to different lithologic reservoir parameters is different, and the role of different seismic attributes in describing different objects is also different. In the process of seismic reservoir prediction, various seismic attributes related to reservoir prediction are usually introduced, but the infinite increase of attribute types will also bring adverse effects on reservoir prediction [1-2]. Therefore, it is necessary to select the least number of seismic attributes or their combinations which are most sensitive (or most effective and representative)
to solve specific problems, enhance the prediction accuracy of seismic reservoirs, and improve the effect of processing and interpretation methods related to seismic attributes, which is called "seismic attribute optimization".
Among many attribute optimization methods, principal component analysis (PCA) is the most widely used statistical analysis technology, such as data compression, feature extraction and pattern recognition. However, PCA has two drawbacks [3, 4]: (1) lack of probabilistic model structure, which is often very important for many research objects, such as hybrid simulation and Bayesian decision, (2) linear nature, discarding the information of higher-order statistics.
parameter probability learning stage to the model, which overcomes its first shortcoming. Subsequently, Schölkopf [6] proposed the kernel principal component analysis (KPCA) method to overcome its second shortcomings. The key idea of KPCA is to use kernel function to avoid calculating inner product in high-dimensional feature space directly. Although it uses implicit form to do nonlinear mapping, it can capture high-order statistical information [7].
For the two shortcomings of PCA, this paper focuses on the method of probability kernel principal component analysis (PKPCA), which captures the statistical features of nonlinear high-dimensional feature space by the Bayesian probability model. And it combines the advantages of PPCA and KPCA. Based on this theory, the attribute feature optimization analysis of actual data is carried out. The results fully prove the superiority and practicability of PKPCA method.
2. The Basic Principle of Probabilistic
Kernel Principal Component Analysis
(PKPCA) Method
2.1. Kernel Principal Component Analysis (KPCA)
The basic idea of kernel principal component analysis (KPCA) is to project each sample vector xk in the input space RN into the
high-dimensional feature space F by introducing a nonlinear function φ, and then Principal Component Analysis is performed in high dimensional space [8-10]. Duo to the high dimensional characteristics of the feature space, the nonlinear mapping and the decomposition of characteristic variables become very difficult, but the nonlinear mapping can be avoided by introducing the kernel technique [11-13], and the point product of the original space variables is only needed to be calculated [6]. Setting up {x1,…, xN} is a spatial sample of Rd.
Nonlinear mapping is Rd→Rf, The spatial sample Rf is as follows: Фf×N=[φ1,…, φN], φn=φ(xn)∈Rf. The mean of
samples is defined as φ0 =Фe,
e
N×1=
N
−1l
. Then the covariance matrix of the high-dimensional space data φ1,…,φN can be expressed as:
Σ=ΦJJTΦT=ΨΨT (1)
Where,
N
1 / 2(
Ne
T)
−
=
−
J
I
1
;ψ
=
ΦJ
; The firstprincipal eigenvector of Σ can be expressed as matrix form:
1/ 2 1 2
[ ,
,
,
]
q
u u
u
q q q −=
⋯
=
U
ΦJV Λ
(2)Where,
V
q=
[ ,
v
1ν
2,
⋯
,
v
q]
,1
diag( ,
,
)
q
=
λ
⋯
λ
qΛ
,And
{(
,
)}
q 1n
v
n nλ
= is the first q eigenvector and eigenvalueof matrix
K
=
J KJ
T .K=Φ ΦT .2.2. Probabilistic Kernel Principal Component Analysis
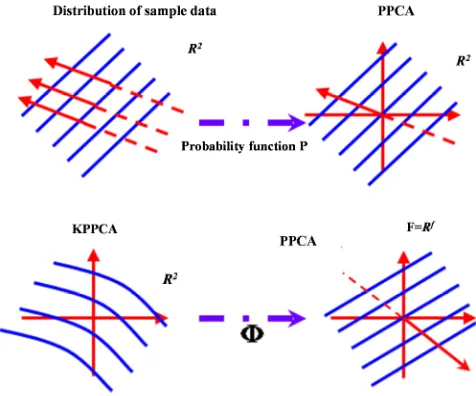
Probabilistic principal component analysis (PPCA) is an extension of traditional principal component analysis (PCA).
It defines an appropriate probability model for data (Figure 1), which effectively overcomes the shortcoming that the PCA transform assumes that the data satisfy ellipsoidal distribution. With the constraint of probability model, PPCA can find the direction of principal component more effectively from high-dimensional data or a large number of data points. Then the optimal probabilistic model (optimal solution) is obtained by estimating the model parameters with the maximum likelihood function or expectation maximization (EM) algorithm. PCA or PPCA is still an effective optimization method to deal with linear relation data, but it is not effective to deal with nonlinear relation variable data. Probabilistic Kernel Principal Component Analysis (PKPCA) defines the PPCA model in the high-dimensional feature space by nonlinear mapping (Figure 1 below), which is the extension of PPCA in the kernel space [14]. It effectively overcomes the lack of probability model and high-order statistics information in PCA. Therefore, PKPCA analysis can effectively deal with data variables with nonlinear relationship.
Figure 1. Basic thinking of PKPCA.
In probability analysis, it is assumed that the data
φ
( )
x
in the high dimensional feature space conform to a special factor analysis model [15], which makes the relationship between the f-dimensional data and the implied q-dimensional variable z be expressed as:( )
x
z
φ
=
W
+ +
µ ε
(3)Where:
z
∼
N
(0,
I
q)
,ε
∼
N
(0,
ρ
I
f)
, W is af
×
r
dimensional load matrix. Then the random probability distribution of high dimensional feature space data
φ
( )
x
varying with implied variable Z can be obtained by factor analysis model.
2 2 / 2
2
1 ( ( ) | ) (2π ) exp ( )
2
f
Pφ x z σ φ x z µ
σ
−
= − − −
W (4)
/ 2 1 T
(z) (2π) exp
2 q
P = − − z z
(5)
The random probability distribution of data
φ
( )
x
is1/ 2
2 / 2 T 1
( ( )) ( ( ) | ) ( )
1
(2π ) exp ( ( ) ) ( ( ) ) 2
f P x P x z P z
x x
φ φ
σ − − φ µ − φ µ
=
= − − −
∫
S S (6)
Here S is the covariance matrix of the model.
T
f ρ
= +
S WW I
Then the maximum likelihood function of data
φ
( )
x
is{
}
{
}
1
1
ln
[ ( )]
ln(2π)
ln
tr(
)
2
Nn
L
p
x
N
f
φ
= −=
= −
+
+
∑
S
S K
(7)
Here, K is the sampling covariance matrix of data
φ
( )
x
. Estimated values ofµ
、W andρ
are obtained frommaximum likelihood estimation.
0
1/ 2
1
ˆ
ˆ
(
ˆ
)
ˆ
(
) [tr( ) tr(
)]
q q q
q
f
q
µ φ
ρ
ρ
−=
=
−
=
−
−
W
U
Λ
I
R
S
Λ
(8)
R is an arbitrary orthogonal matrix
q q
×
Because the dimension
f
of kernel space is usually unknown, theρ
ˆ
value is difficult to obtain accurately. Ingeneral, the
f
value is very large and the valueρ
ˆ
is very small, so it can be given a small fixed value according to experience[16].Substituting the
U
q expression (formula 2) into Wˆ :ˆ
=
W
ΦJQ
(9)Where,
Q V I
=
q(
q−
ρ
ˆ
Λ
q−1 1/ 2)
R
Because
Q
links the load matrix with the empirical data, it is called the empirical load matrix. Finally, the EM iterative algorithm is applied to get the estimated valuesQ
andρ
.T
1 T
2 ( ) ( ) ( ) 1 ( ) ( ) 1
( ) ( ) ( ) ( )
(
)
1
tr(
)
j i j j j j
q
j i j j j i
f
ρ
ρ
− + − − + +=
+
=
−
Q
KQ
I
M Q
K Q
K
KQ
M
Q
K
(10)Where, M=ρˆIq+W WˆT ˆ , Substituting the expression of
ˆ
W to get M:
T q
=
M
R Λ R
Similar to KPCA expression, the following formula can be applied in PKPCA to obtain the eigenvector
z
ˆ
of thehigh-dimensional space.
1
ˆ
Tˆ
−( ( )
φ
x
−
µ
)
z = M W
(11)The eigenvector of the observed sample
φ
(
x
)
can berepresented by a posteriori mean corresponding to the
z
variable. Then substituting
M W
,
ˆ
andµ
ˆ
, the formula can be got as following:T 1 Τ
ˆ
q(
) (
t)
−
−
z = R L R JQ
K
Ke
(12)Where the
i
th
element of tK is
φ
( )
x
i Tφ
( )
x
=
k x x
( , )
i(
i
=
1, 2,
⋯
,
N
)
. The dimensionq
of the eigenvectorz
ˆ
can be smaller thanN
, so that the low-dimensional vector can be used to represent the high-dimensional original eigenvector, thereby achieving the purpose of data dimensionality reduction.2.3. PKPCA Algorithm Implementation
The implementation of the PKPCA algorithm has the main steps as following:
(1) Standardized preprocessing of data: To overcome the differences in dimension and magnitude between various seismic attributes, the original seismic data is standardized and preprocessed to ensure the objectivity and accuracy of the optimization results. There are many methods for standardizing data. Here, standard deviation methods are used to preprocess seismic attribute parameters.
(2) Selecting kernel function: The choice of kernel function in practical applications is very important. The success of the kernel function selection directly affects the prediction results of the KPCA and PKPCA methods. In this paper, a polynomial kernel function and a Gaussian radial basis kernel function are used. In addition, the choice of the kernel function parameters is also very important, and sometimes the choice of kernel function parameters is even more important than the choice of the type of the kernel function itself.
(3) High dimensional space covariance matrix and its decomposition: Under the action of the selected kernel function, a covariance matrix is obtained by applying formula
T
=
K
J KJ
. And then he feature value1
diag( ,
,
)
q
=
λ
⋯
λ
qΛ
and the feature vector1 2
[ ,
,
,
]
q
=
v
ν
⋯
v
qV
is obtained by eigenvaluedecomposition.
(4) Estimating
Q
andρ
: The MLE algorithm can be used to calculate the initial value by using the formula (8), and then the eigenvalue and the feature vector obtained in step (3) are substituted into the iterative formula (10) of the EM algorithm. At last, the estimated values of A and B can be calculated quickly and accurately. Or directly apply the EM algorithm, that is, first give the initial value, and then gradually iterate to obtain the exact sum and estimate.(5) Feature extraction: Apply (12) to extract the feature vector
ˆ
these new attributes, the comprehensive geological interpretation analysis of the target reservoir is carried out.
3. Case Study
The above method is applied to real data to verify the advantages of PKPCA algorithm. The actual data is from Southern oil fields in China. Reservoirs in this block are poor or tight reservoirs, but they have good porosity and permeability in local areas (such as grain chips, oolitic and so on) and become favorable reservoir areas. Well logging data of J1 well in this area (Figure 3 black spots) is available. The lithology of the selected interval is grey dolomite with lime-bearing silty sand cuttings, which is comprehensively interpreted as gas reservoir by logging. In case, the amplitude kurtosis, amplitude torsion, amplitude arc length, effective bandwidth and average instantaneous frequency are extracted along the target layer of the block (Figure 2). PCA, KPCA and PKPCA are used to optimize the attributes, and the final comparison is shown in Figure 3. Where, the two kernel functions used in the PKPCA optimization method are:
Kernel function 1
(
)
2
1
, exp
50
k
× −
= −
x y
x y ,
Kernel function 2 k
(
x y,)
=(
0.5× ⋅ +(
x y)
4)
2(a)
(b)
(c)
(d)
(e)
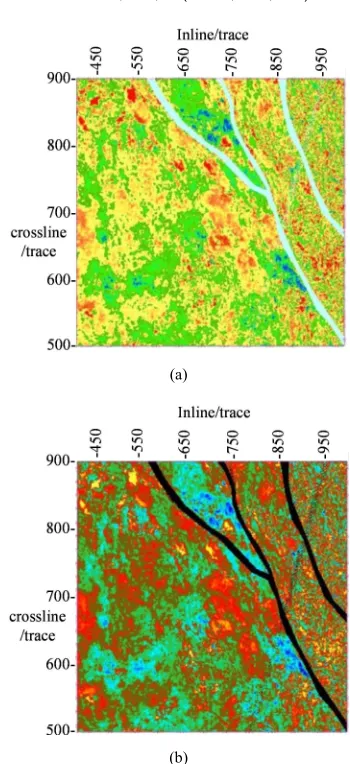
Figure 2. Original seismic attribute (a) Amplitude Kurtosis, (b) amplitude torsion, (c) amplitude arc length, (d) effective bandwidth, (e) average instantaneous frequency.
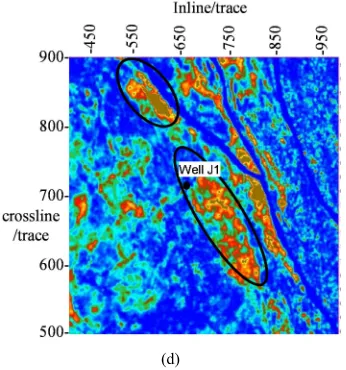
KPCA algorithm based on radial basis function (Figure 3b) can extract the approximate range of reservoir, but it is not accurate enough. The PKPCA algorithm (Figure. 3C and Figure. 3d) gets the best probability solution by adding probability model and introducing kernel function, and using the discarded principal component as noise variance estimation to constrain factor load matrix W. It can delineate accurately the reservoir range and coincide with the result of J1 logging interpretation, thus achieving the effective attribute optimization.
(a)
(b)
(c)
(d)
Figure 3. Comparison of attribute optimization results by different methods (a)PCA, (b)KPCA(RBF kernel), (c)PKPCA(RBF kernel), (d)PKPCA (Polynomial basis——kernel function 2).
It can be seen from case study that the optimization results of the polynomial kernel function and the radial basis function are similar, which can describe the reservoir range well. But the optimization results of polynomial kernel function describe the range more accurately, and the calculation efficiency is higher than that of radial basis function. Therefore, the kernel function selection of PKPCA algorithm is very important. If not properly selected, it will not only waste time, but also seriously affect the accuracy of reservoir prediction.
4. Conclusions
(1) As an extension of PPCA in high dimensional space, PKPCA defines PPCA probability model in high dimensional feature space by nonlinear mapping. It not only overcomes the shortcoming of lacking probability statistics for PCA linear algorithm, but also captures the high-order statistical information of attributes, which effectively improves the ability of non-linear simulation of attributes and the accuracy of attribute optimization. Its additional probability structure also provides an effective classification method.
(2) PKPCA method is applied to optimize and analyze a southern oilfield data. Under the same parameters, its processing result is better than PCA and KPCA algorithm, which is more sensitive to oil and gas reservoirs, can describe the favorable distribution range of reservoirs more precisely, and is consistent with logging interpretation results, and has high accuracy of reservoir prediction. This provides a new idea and approach for multi-attribute optimization and complex geological reservoir prediction.
target area in order to save time and effort and achieve the desired results.
Acknowledgements
We greatly appreciate the support of the Natural Science Foundation of China (Grant No. 41804132), the Open Project Program of Sinopec Key Laboratory of Multi-Component Seismic Technology (“Numerical Simulation and Analysis of Multi-Wave Seismic Data in Thin Reservoirs”), and The 13th
Five-Year Plan Project Program “Seismic Wave
Characteristics and Inversion of Thin Layer
(2016ZX05002-005-003-002).”
References
[1] X. Y. Yin, J. Y. Zhou. Review of seismic attribute optimization methods, OGP, 2005, vol.4, pp. 258-262.
[2] S. Chopra and K. J. Marfurt. Seismic facies classification using some unsupervised machine-learning methods, SEG Technical Program Expanded Abstracts 2018: pp. 2056-2060.
[3] L. F Liu, S. Z. D. Sun, H. Y. Wang, and H. J. Yang, J. F. Han, and B. Jing. 3D Seismic attribute optimization technology and application for dissolution caved carbonate reservoir prediction, SEG Technical Program Expanded Abstracts 2011: pp. 1968-1972.
[4] S. K. Zhou, R. Chellappa, W. Zhao. Unconstrained face recognition. Springer-Verlag, New York Inc, 2006.
[5] M. E. Tipping, C. M. Bishop, Probabilistic principal component analysis. Journal of the Royal Statistical Society, Series B (Statistical Methodology), 1999, vol.61, pp.611-622. [6] B. Schölkopf, A. Smola, K. R. Müller. Nonlinear component
analysis as a kernel eigenvalue problem, Neural computation, 1998, vol.10, pp.1299-1319.
[7] S. S. Dehsoukhteh. Compare and Evaluate the Performance of
Gaussian Spatial Regression Models and Skew Gaussian Spatial Regression Based on Kernel Averaged Predictors, American Journal of Theoretical and Applied Statistics, 2015, Vol. 4, pp. 368-372.
[8] P. Dejtrakulwong, T. Mukerji, and G. Mavko. Using kernel principal component analysis to interpret seismic signatures of thin shaly-sand reservoirs, SEG Technical Program Expanded Abstracts 2012: pp. 1-5.
[9] Z. N. Liu, C. Y. Song, H. P Cai, X. M Yao, and G. M. Hu. ”Enhanced coherence using principal component analysis.” Interpretation, 2017, vol.5, pp. T351-T359.
[10] G. Phelps, C. Scheidt, and J. Caers . Exploring viable geologic interpretations of gravity models using distance-based global sensitivity analysis and kernel methods, GEOPHYSICS, 2018, vol.83, pp. G79-G92
[11] P. Dejtrakulwong, T. Mukerji, and G. Mavko. Using kernel principal component analysis to interpret seismic signatures of thin shaly-sand reservoirs, SEG Technical Program Expanded Abstracts 2012: pp. 1-5.
[12] G. Li, H. F. Li , L. Zhang. Novel Model Using Kernel Function and Local Intensity Information for Noise Image Segmentation, Tsinghua Science and Technology, 2018, vol 23, pp. 303-314. [13] Guangzhi Zhang, Guoying Kong, and Jingjing Zheng (2009)
Seismic attribute optimization based on kernel principal component analysis. Beijing 2009 International Geophysical Conference and Exposition, Beijing, China, 24–27 April 2009: pp. 57-57.
[14] A. Pradhan and T. Mukerji. Seismic estimation of reservoir properties with Bayesian evidential analysis. SEG Technical Program Expanded Abstracts 2018: pp. 3166-3170.
[15] T. Li, R. Wang, Z. Z. Wang, M. Y. Zhao, and L. Li (2018). Prediction of fracture density using genetic algorithm support vector machine based on acoustic logging data, GEOPHYSICS, 2018, vol 83, pp. D49-D60.