P.Bharathi et al, International Journal of Computer Science and Mobile Applications, Vol.5 Issue. 8, August- 2017, pg. 9-19 ISSN: 2321-8363 Impact Factor: 4.123
USER RATING PREDICTION USING
DATA MINING TECHNIQUES IN
ONLINE PURCHASE
P.Bharathi
1, Dr. B. Umadevi
21
Research Scholar, P.G. & Research Department of Computer Science, Raja Doraisingam Govt. Arts College, Sivaganga, Tamil Nadu, India
2
Assistant Professor & Head, P.G. & Research Department of Computer Science, Raja Doraisingam Govt. Arts College, Sivaganga, Tamil Nadu, India
Abstract
The growth of internet gives more opportunities for the buyers in selecting their products. They have an open forum through which they can make their purchase by comparing the like products by various organizations. The e-commerce platform allows the user to make the business with pos tags by the various types of visitors. The Collaborative and SVM algorithm are applied for predicting user rating behaviour. The author collects the data from the websites of the different organizations. The product of the different organizations is being posted as the likings and disliking as values of stars. The significance of the product may be tagged as the comments posted by the different product users. So many people will contribute same results or feedback. The data mining techniques classifies the similarities and dissimilarities among the tags. It predicts the repeated items and transforms it into text and their density values are calculated for each product. Using the clustering algorithm the product features are validated. The existing Collaborative filtering algorithm is applied to filters the user rating behavior. But it does not give significant result. So we propose the SVM algorithm for predicting the behavior for making the better performance from the available data set.
Keywords: CFA, SVM, Part Of Speech, Data mining.
1. Introduction
The E-commerce plays vital role in the global economy as a strong instrument for the economic development. The operational costs of large enterprises operational costs are cut downed by the usage of internet and web based applications. The Data mining (DM) helps many companies from the available sources of information for good as well as weighted decision making [1]. An organization needs to invest only on the group of products which are frequently purchased by its customers as well as price them appropriately in order to attain maximum customer satisfaction.
P.Bharathi et al, International Journal of Computer Science and Mobile Applications, Vol.5 Issue. 8, August- 2017, pg. 9-19 ISSN: 2321-8363 Impact Factor: 4.123
The most of the information are shared among various people by the recommendations of others. Social networks gather and distribute volumes of information contributed by the users around the world. This information is more resourceful. The information collected from the internet is text, logos, pictures etc [4]. So it is essential to recommend the users’ favorite services from crowd sourced contributed information [5].
2. Related Works
A moment ago, Qian Feng, Zhao, Mei introduced personalized recommendation combining social network information’s like personal interest, interpersonal interest similarity and personal influence. The personal interest will always denotes their individuality and it may also lead to improve the accuracy and personal recommendations.
Recently, another author Yang steck infered the rating by socila trus t circles data avilable in the social network . The author salakhutdinov and A.Mninh proposoed the Probablistic matrix Factorization approach (PMF). His model is able to generalize better for users with cery few ratings.
Subsequently, the another author Jiang, Cui, Liu , Yang , Wang , Zhu analysed CARS impelemnts different applications and facotors which improve the performance ecommendations. Java analysed large social network in the new form of social media called social blogging .It studies about the close aquainatnces among users.
Previously, the another author Grazyna Suchacka, Magdalena Skolimowska-Kulig and Aneta Potempa recast online purchase predictions as a classification problem. They used historical data from an online bookstore. The SVM classification model was proposed and they divided the user sessions into two classes: browsing sessions and buying sessions. The SVM classifier was used to prove the effectiveness of prediction model.
In recent times, author Xiaoyuan Su and Taghi M. Khoshgoftaar presented three main categories of CF techniques such as memory-based, model-based, and hybrid CF algorithms (that combine CF with other recommendation techniques). They analyzed the performance of the predictive algorithm for each category and also addressed its challenges.
3.
Methodology
3.1. Evaluating the Recommender Model
The evaluation of the accuracy of the recommender model is an important step in the recommender system design process. It helps designers to choose models and check the accuracy of the model before applying into [5] practice. The evaluation will be conducted in two steps:
(a) Preparing the data to evaluate the models
In order to evaluate the quality of a predictive model. The experimental datasets have divided into two parts: one for modeling and the rest for testing [6][7]. Therefore, the first step is to prepare the data; in this step the experimental dataset is divided into two subsets: training dataset and testing dataset. Currently, many methods are being used to split datasets for evaluating recommender models such as:
Splitting: It is the initial method to build a training set and test set by cutting experimental dataset into 2 parts. For
P.Bharathi et al, International Journal of Computer Science and Mobile Applications, Vol.5 Issue. 8, August- 2017, pg. 9-19 ISSN: 2321-8363 Impact Factor: 4.123
Bootstrap sampling: It is a method used to build a training set and test set by cutting the experimental dataset into 2
parts. However, this approach is done randomly and repeatedly in order that a user may be a member of the training set in this cutting time [10] but is a member of test set in the next cutting time. This can overcome the disadvantages of heterogeneity of the experimental dataset and increase optimization for small-sized dataset.
K-fold cross-validation: It is a method used to build a training set and test set by cutting the experimental dataset
into k subsets with the same size (called k-fold). After that, the model is evaluated k times. Every evaluation uses one subset for the test set and the k-1 subsets are used as the training set. The evaluation results of this method are average value of k evaluations [11]. This approach ensures that all users have appeared at least one time in the test set. Therefore, it is the most accurate of the three methods. However, it is costly for the calculation compared with the remaining two methods.
(b) Evaluate recommender model
There are two methods for evaluating recommender model: evaluation based on the ratings and recommendations. The first method evaluates the ratings generated by the model. The remaining method evaluates directly on the recommendations of the model [12].
Evaluation based on the ratings: a method evaluates the accuracy of the model by comparing the predicted rating
value with the real value. More precisely, this method is to find out the average error value based on three indicators RMSE, MSE and MAE. A model is evaluated good if these indicators show low value.
Evaluation based on the recommendations: a method evaluates the accuracy of the model by comparing the
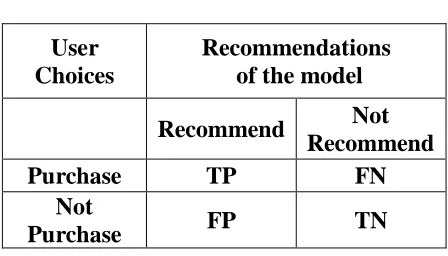
model's recommendations to purchase choice of the users. This approach uses confusion matrix which is given in the Table 1 to calculate the value of five indicators: Precision, Sensitivity or Recall, Specificity, F-measure and error rate. The model is evaluated good if these indices gain high value.
Table 1: Confusion Matrix
User
Choices
Recommendations
of the model
Recommend
Not
Recommend
Purchase
TP
FN
Not
Purchase
FP
TN
3.2. Predicting User Rating Behaviour
The goal of this study is to improve the effectiveness of the proposed methodology to predict the user rating behaviour. The existing and proposed algorithm in predicting the rating performance will be described in the next section.
3.2.1. Collaborative Filtering Algorithm
P.Bharathi et al, International Journal of Computer Science and Mobile Applications, Vol.5 Issue. 8, August- 2017, pg. 9-19 ISSN: 2321-8363 Impact Factor: 4.123
automatic predictions (filtering) about the interests of a user by collecting preferences or taste information from many users (collaborating). The underlying assumption of the collaborative filtering approach is that if a person A has the same opinion as a person B on an issue, A is more likely to have B's opinion on a different issue than that of a randomly chosen person [13].
In the more general sense, collaborative filtering is the process of filtering for information or patterns using techniques involving collaboration among multiple agents, viewpoints, data sources, etc. Applications of collaborative filtering typically involve very large data sets. Collaborative filtering methods have been applied to many different kinds of data including: sensing and monitoring data, such as in mineral exploration, environmental sensing over large areas or multiple sensors; financial data, such as financial service institutions that integrate many financial sources; or in electronic commerce and web applications where the focus is on user data.
3.2.2. Support Vector Machine
Support vector machines (SVM) is a supervised learning models with associated learning algorithms that analyze data used for classification and regression analysis. The set of training examples each marked as belonging to one or the other of two categories. The SVM training algorithm builds a model that assigns new examples to one category or the other, making it a non-probabilistic binary linear classifier, while methods such as Platt scaling exist to use SVM in a probabilistic classification setting. The SVM model is a representation of the examples as points in space, mapped so that the examples of the separate categories are divided by a clear gap that is as wide as possible [14][15]. New examples are then mapped into that same space and predicted to belong to a category based on which side of the gap they fall.
In addition to performing linear classification, SVMs can efficiently perform a non-linear classification using the kernel trick, implicitly mapping their inputs into high-dimensional feature spaces.
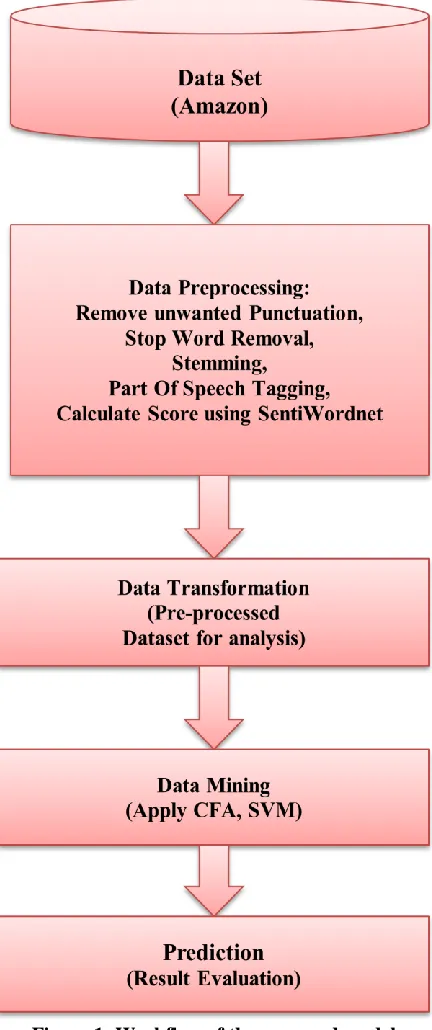
The Figure 1 explains the workflow of the proposed model. In this model there are five main stages. The stages are Data collection, Data Preprocessing, Data Transformation, Data Mining and Prediction. The Data collection is gathering from AMAZON web site. During pre-processing stage, removal of unwanted words, stop word removal, stemming, Part of Speech Tagging (POS) and also calculate score using sentiword net. Eventually, attributes selection, dimensionality reduction, and data partitioning are applied to get better prediction and is transformed for analysis. Whereas, Data Mining algorithms are used for the classification of data. Normally, at these stage algorithms is executed with different variables and compared to select algorithm which produce best results. Finally, in interpretation stage models obtained from previous stage are analyzed to predict user rating behaviour analysis. The steps of the algorithm are shown below:
Algorithm Steps:
Step 1: Input : Review the Dataset
Step 2: Preprocess the data by the following steps. (a) Remove unwanted punctuation
(b) Stopword removal (c) Stemming
(d) Part Of Speech Tagging(POS) (e) Calculate Score using Sentiwordnet. Step 3: Apply Classification Algorithms
P.Bharathi et al, International Journal of Computer Science and Mobile Applications, Vol.5 Issue. 8, August- 2017, pg. 9-19 ISSN: 2321-8363 Impact Factor: 4.123
P.Bharathi et al, International Journal of Computer Science and Mobile Applications, Vol.5 Issue. 8, August- 2017, pg. 9-19 ISSN: 2321-8363 Impact Factor: 4.123
4. Experiment results
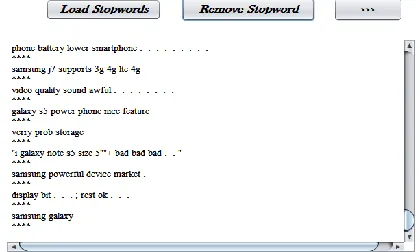
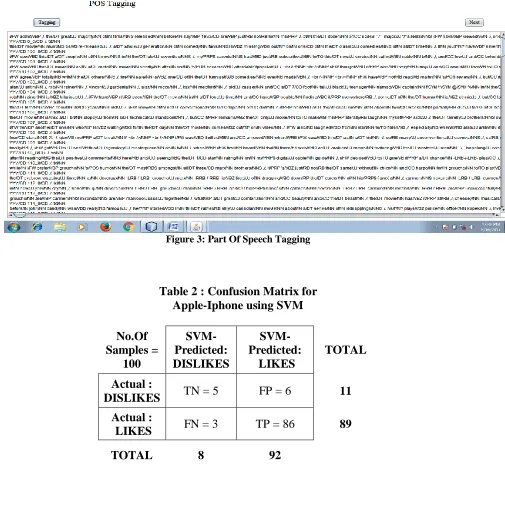
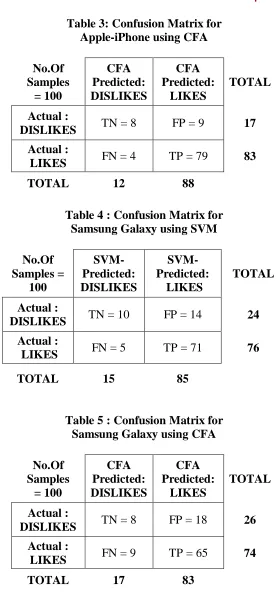
The dataset has been collected from the Amazon for the two items such Apple Iphone and Samsung Galaxy. The items from the various user rating and comments are recorded as a text file and are randomly selected. The data is preprocessed and the features are extracted for the analysis. During the preprocess the stop word removal and Part of Speech Tagging (POS) in shown in Figure 2 and Figure 3. The Collaborative filtering Algorithm (CFA) and Support Vector Machine (SVM) algorithms are employed for the dataset. The K-Fold Cross-Validation Matrix (k=10) is evaluated for the above said two algorithms for the 100 test samples 100 and 10 k fold value to identify the positive and negative ratings of the users comment.
The results of the two algorithms are compared by the statistical measurement metrics such as Precision, Sensitivity or Recall, Specificity, F-measure and error rate for the two items. The outcomes of Apple Iphone data for SVM and CFA is given in Table 2, Table 3. The comparison between the two algorithms for AppleiPhone is given in Figure 4. Similarly, the results of Samsung Galaxy is shown in Table 4 and Table 5. And the results of comparison is shown in Figure 5. The overall accuracy of the CFA and SVM is also analysed and is shown in Table 6 and Figure 6. The research results which clearly express very much better accuracy by Support Vector Algorithm (SVM) rather than Collaborative Filtering Algorithm (CFA).
P.Bharathi et al, International Journal of Computer Science and Mobile Applications, Vol.5 Issue. 8, August- 2017, pg. 9-19 ISSN: 2321-8363 Impact Factor: 4.123
Figure 3: Part Of Speech Tagging
Table 2 : Confusion Matrix for
Apple-Iphone using SVM
No.Of
Samples =
100
SVM-
Predicted:
DISLIKES
SVM-Predicted:
LIKES
TOTAL
Actual :
DISLIKES
TN = 5
FP = 6
11
Actual :
LIKES
FN = 3
TP = 86
89
P.Bharathi et al, International Journal of Computer Science and Mobile Applications, Vol.5 Issue. 8, August- 2017, pg. 9-19 ISSN: 2321-8363 Impact Factor: 4.123
Table 3: Confusion Matrix for
Apple-iPhone using CFA
No.Of
Samples
= 100
CFA
Predicted:
DISLIKES
CFA
Predicted:
LIKES
TOTAL
Actual :
DISLIKES
TN = 8
FP = 9
17
Actual :
LIKES
FN = 4
TP = 79
83
TOTAL
12
88
Table 4 : Confusion Matrix for
Samsung Galaxy using SVM
No.Of
Samples =
100
SVM-
Predicted:
DISLIKES
SVM-Predicted:
LIKES
TOTAL
Actual :
DISLIKES
TN = 10
FP = 14
24
Actual :
LIKES
FN = 5
TP = 71
76
TOTAL
15
85
Table 5 : Confusion Matrix for
Samsung Galaxy using CFA
No.Of
Samples
= 100
CFA
Predicted:
DISLIKES
CFA
Predicted:
LIKES
TOTAL
Actual :
DISLIKES
TN = 8
FP = 18
26
Actual :
LIKES
FN = 9
TP = 65
74
P.Bharathi et al, International Journal of Computer Science and Mobile Applications, Vol.5 Issue. 8, August- 2017, pg. 9-19 ISSN: 2321-8363 Impact Factor: 4.123
Figure 4: Comparison of CFA Vs SVM – Apple iPhone
Figure 5: Comparison of CFA Vs SVM – Samsung Galaxy
0.00%20.00% 40.00% 60.00% 80.00% 100.00% 120.00%
Accuracy F-Measure Error rate
P
e
r
c
e
n
tage
Performance Metrics
Apple iPhone
CFA
SVM
0.00% 20.00% 40.00% 60.00% 80.00% 100.00% 120.00%
Accuracy F-Measure Error rate
P
e
r
c
e
n
tage
Performance metrics
Samsung Galaxy
CFA
P.Bharathi et al, International Journal of Computer Science and Mobile Applications, Vol.5 Issue. 8, August- 2017, pg. 9-19 ISSN: 2321-8363 Impact Factor: 4.123
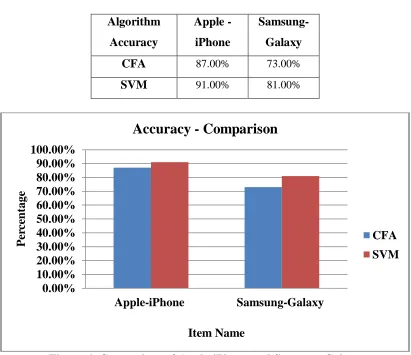
Table 6: Comparison of Apple-iPhone and Samsung-Galaxy
Algorithm
Accuracy
Apple -
iPhone
Samsung-
Galaxy
CFA
87.00% 73.00%SVM
91.00% 81.00%Figure 6: Comparison of Apple-iPhone and Samsung-Galaxy
5. Conclusion
The commercial or business promoters need lot of in formations for promoting their products. The promotions are based upon the satisfaction from the customer. But the business sectors wants details about level of expectation and the product ratings. Our Research highlights the likings of the user rating. The data mining algorithm is applied over through the two data set for the products Apple-iPhone and Samsung-Galaxy. The algorithm went through well with parameters for predicting the interest shown by the customer towards both products. The SVM gives better result in accuracy by 91% and CFA by 87% for Apple-iPhone and similarly for Samsung-Galaxy 81% for SVM and 73% for CFA. The overall research results produce best liking for Apple-iPhone rather than for Samsung-Galaxy. This makes a better understanding for the promoters to enhance their product to bring buyers into the competitive market.
0.00%
10.00%
20.00%
30.00%
40.00%
50.00%
60.00%
70.00%
80.00%
90.00%
100.00%
Apple-iPhone
Samsung-Galaxy
P
er
ce
n
tage
Item Name
Accuracy - Comparison
P.Bharathi et al, International Journal of Computer Science and Mobile Applications, Vol.5 Issue. 8, August- 2017, pg. 9-19 ISSN: 2321-8363 Impact Factor: 4.123
References
[1] Rongrt Pan and Martin Schulz, 2009, “Mind the gaps: Weighting the unknown I large-scale one-class collaborative filtering”, In 15th ACM SIGKDD Conference on Knowledge Discovery and Data Mining (KDD).
[2] Bills us D and Pizza M, 1998, “Social network Learning collaborative information filters”, Proceedings of the Fifteenth International Conference on Machine Learning, 54.
[3] Burges C.J.C, 1998, “Social Media ,A tutorial on support vector machines for pattern recognition”, Data Mining and Knowledge Discovery, 2, 121–167.
[4] Cao B, Sheen D, Sun J.T, Yang Q and Chen Z, 1998, “Feature selection in a kernel space”, In: Proc. Int. Conf. Machine Learning, A tutorial on support vector machines for pattern recognition, Data Mining and Knowledge Discovery 2, 121–167 [5] Domingos P and Richardson M, 2003. “Mining the network value of customers”, In Proceedings of the 7th International Conference on Knowledge Discovery and Data Mining, ACM, New York, 57–66.
[6] Goldberg D, Nichols D, Oki B M and Terry D, 1992, “Using collaborative filtering to weave an information tapestry Common”, ACM 35, 61–70.
[7] Breese J, Heckerman D and Katie C, 1998, “Empirical analysis of predictive algorithms for collaborative”, Proceedings of the Fourteenth Conference on Uncertainty in Artificial Intelligence, 461.
[8] Buczak A, Zimmerman J and Kurapati K, Personalization: 2003, “Improving Ease-of-Use, Trust and Accuracy of a TV Show Recommender”, Proceedings of the AH’2002 Workshop on Personalization in Future TV, D. Chickening, D. Geiger, and D. Heckerman. Learning Bayesian networks is NP-hard.
[10] Despond M and Carpus G, 2007, “Item-based top-N recommendation algorithms”, ACM Transactions on Information Systems (TOIS), 22(1):143–177.
[11] Bills us D and Pizza M, 1998, “Learning collaborative information filters”, Proceedings of the Fifteenth International Conference on Machine Learning, 54.
[12] Bishop C, 2006, “Pattern recognition and machine learning”, Springer, 61.
[13] Breese J, Heckerman D and Katie C, 1998, “Empirical analysis of predictive algorithms for collaborative filtering”, Proceedings of the Fourteenth Conference on Uncertainty in Artificial Intelligence, 461.
[14] Buczak A, Zimmerman J and Kurapati K, 1999, “Personalization: Improving Ease-of-Use, Trust and Accuracy”, 66. [15] Deshpande M and Karypis G, 2004, “Item-based top-N recommendation algorithms”, ACM Transactions on Information Systems (TOIS), 22(1):143–177.
Biography
P. BHARATHI is an M.Phil Research Scholar in PG & Research Department Of Computer Science, Raja Doraisingam Government Arts College, Sivaganga, Tamilnadu, India. Her research interest includes in Data mining and its applications. She published paper in international journal during her research.