_____________________________________________________________________________________________________
*Corresponding author: Email: [email protected];
Simplified Compression Arch Action Model for R/C
Beam-column Assemblages
Fouad B. A. Beshara
1, Ahmed A. Mahmoud
1,2, Osama O. El-Mahdy
1and Ahmed N. Khater
1*1Department of Civil Engineering, Faculty of Engineering, Shoubra, Benha University, Egypt. 2
Higher Institute of Engineering, 15 May, Egypt.
Authors’ contributions
This work was carried out in collaboration among all authors. All authors made equal contributions in conceptualization, formal analysis, validation, visualization, reviewing and editing. All authors supervised the manuscript. All authors carried out the model calibration and applications and wrote the original draft. All authors read and approved the final manuscript.
Article Information
DOI: 10.9734/JERR/2019/v7i316969 Editor(s): (1) Dr. Guang Yih Sheu, Associate Professor, Chang-Jung Christian University, Taiwan. Reviewers: (1) J. Dario Aristizabal-Ochoa, Universidad Nacional de Colombia, Colombia. (2) Junlong Zhou, Dalian University of Technology, China. Complete Peer review History:https://sdiarticle4.com/review-history/51799
Received 14 July 2019 Accepted 22 September 2019 Published 01 October 2019
ABSTRACT
A set of analytical equations are developed for calculating the beam-column assemblage flexure action capacity and compression arching action capacity under a middle column removal scenario. The suggested equations covered most of the main parameters affecting the assemblage behavior including seismic detailing, longitudinal reinforcement ratios, concrete confinement, and the contribution of concrete flanged slabs. The proposed analytical model for predicting the flexural and compression arching action capacities is validated with a large number of experimental results. The model provides a good estimation for 79 beam-column assemblages with several geometrical, reinforcement configurations, and material parameters. The mean values of the experimental to the theoretical ratio for calculating flexure and compression arching capacities are 1.15 and 1.16, respectively. The predictions of previous compression arch action models are found to be more conservative. Finally, the proposed model is utilized in parametric studies including all key parameters that affected resistance of the beam-column assemblages against progressive collapse.
Keywords: Reinforced concrete; beam-column assemblage; progressive collapse; flexure capacity; compression arch action.
1. INTRODUCTION
Progressive collapse is defined as a failure in one element of the building and extended to other elements, which could result in the collapse of the entire building [1,2]. In recent decades, several numbers of theoretical and laboratory research have been carried out regarding the progressive collapse. However, laboratory research on the behavior of beam-column assemblages under mid-column loss scenarios is considered to be relatively limited [3]. In-Situ tests are the best way to model the behavior of concrete frames to cope with successive collapses, but these tests have a very high cost. Previous research and experiments have shown that the multi-story concrete frames can be simplified in a single-story structure with good representation of boundary conditions [4]. In order to obtain the behavior of the beam-column assemblage under the scenarios of the loss of the interior column, a number of samples containing different variables were collected and studied [3-18]. After analyzing the laboratory results related to the behavior of the beam-column assemblages, it was found that the compressive arch action capacity (CAA) is one of the most important resistance mechanisms to the progressive collapse under the influence of losing interior columns. CAA is generally achieved in reinforced concrete beams at few displacements and leads to 30–150% improvement in the structural resistance as reported in [11].
Subsequently, the focus was on the calculation of the arch action capacities but with limited consideration of the assemblage slabs contributions and the detailing of both longitudinal and horizontal reinforcements. By considering these supplementary issues, a
theoretical model to expect the beam-column assemblage behavior under column loss scenarios is introduced in the present study. Concentration has been placed on the development of an easy and simplified model for calculations of the desired capacities. A widespread assessment survey is done in order to investigate the credibility and sensitivity of the proposed model [18]. The literature results including many sources were utilized and compared to the theoretical calculations. The assessment signifies that the proposed model could offer a valid estimation of arching capacities.
2. FORMULATION OF THE PROPOSED MODEL
2.1 Assumptions
Prior to removing the interior column, concrete cracking occurred at the connection between the beam and the removed column. The vertical load from the above structure that was carried by the removed interior column is then converted to a concentrated load on the two-bay beam-column assemblage. The assemblage resistance to the progressive collapse is granted mainly by the flexural capacity of the beams at the initial loading phases. Subsequently, the beam elongates under the increment of the applied loads, however, the restraint by other members leads to the occurrence of compression arch action in the beam-column assemblage. The arching action in addition to the beam axial forces are shown in Fig.1 [19], where the interior column consumes its bearing capability. Compression arch action mechanism in the beam-column assemblages is associated with axial compression forces.
In parallel with the clarifications above, the following simplified assumptions are presented for the proposed model in evaluation of the assemblage flexural capacity and compression arch action:
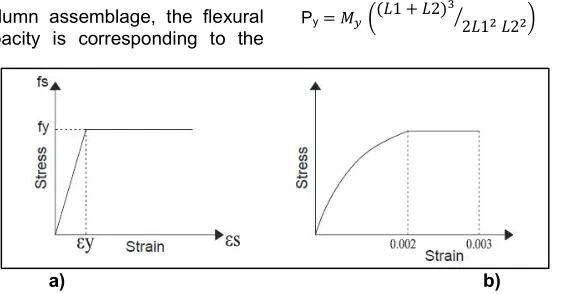
a) For the reinforcing steel bars in tension and compression, a bilinear curve is adopted for the stress-strain correlation as shown in Fig.2;
b) The assumed concrete stress-strain curve is a parabolic and followed by a horizontal plateau including an ultimate strain of 0.003 anticipated with concrete crushing. When the ultimate strain is reached, an equivalent idealized rectangular stress block is used for concrete in compression as shown in Fig.2;
c) A perfect adhering bond is supposed between the reinforcing steel bars and the concrete, which in turn leads to equal strain values for both steel bars and concrete at the same point along the assemblage span;
d) Plane sections stick around plane prior and afterward bending, and consequently the strain distribution along beam depth is linear.
e) The ultimate beam moment anticipated with the arching capacity is achieved after yielding of the main reinforcing steel bars; f) The assemblage flexural deformations are
not considered at the stages of large displacements that reached as a result of progressive collapse;
g) The assemblage failure modes and cracking patterns are assumed to be identical at the two beam sides of the eliminating middle column.
2.2 Derivation of Flexural Beam Action Capacity
For the beam-column assemblage, the flexural beam action capacity is corresponding to the
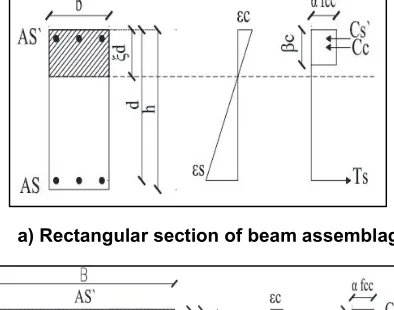
initial yielding of tension steel bars. Prior to the removing of the interior column, there are bending moments at the upper beam sections, which located in both sides of the middle column. However, the extreme bending moments occur in the lower beam sections at the middle joint after the eliminating of the interior column. Therefore, the initial yielding of reinforcing steel longitudinal bars takes place at the regions of the center column stub. The geometry of the assemblage section with and without flanges is shown in Fig. 3. The depth of the neutral axis (Z) can be calculated as follows:
Z = ξ d (1.a)
ξ= ( + ′) + 2 + ′ ′ / −
+ ′ (1.b)
Where b is the width of the section, d is the effective depth, ρ = As / (bd), As is the tension
longitudinal reinforcement. ρ` = As` / (bd), As` is
the compression longitudinal reinforcement. n = Es / Ec is the ratio of steel and concrete elasticity
modulus.
By equilibrating the beam internal forces with Eq. (1), the yielding moment can be obtained as per Eq. (2). In case of unsymmetrical beam-column assemblage reinforcement at both sides of the interior column, only the least yielding moment is considered.
My= fy
( ) b 1 − + `
( ) As` −
′ (2)
By equilibrating the beam external forces with the resisting moment as given by Eq. (2), the corresponding yield load applied at the center column stub is calculated as follows;
Py= ( 1 + 2) 2 1 2 (3)
a) b)
a) Rectangular section of beam assemblage
b) Flanged t section of beam assemblage
Fig. 3. Strain and stress distribution diagrams for middle section of assemblage
Where L1 and L2 are the beam spans between
columns. Based on the assumption that was concluded by Jian et al. [20], the anticipating curvatures with the initial yield load of the longitudinal reinforcement can be calculated based on Eq. (4) as follows;
φy= ( ) (4)
In the case of unsymmetrical longitudinal reinforcement configurations at both sides of the interior column, only the least yielding curvatures are considered as stated by Paulay and Priestley [21]. By using the assumption of Yu and Tan, [22] in which a linear curvature distribution could be employed in the calculation of yielding displacement, the displacement at the point of the removed column is assessed as per Eq. (5).
Δy= φy 3 (5)
2.3 Derivation of Compression Arch Action Capacity
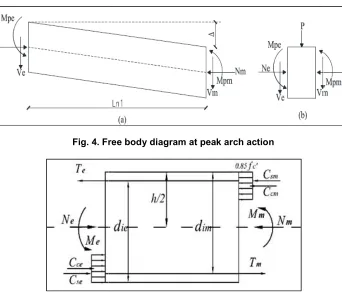
The beam-column assemblage structural system is shown in Fig.4, where the interior column collapses and drops its load sustaining ability. Subsequently, the load converted to a concentrated load P on the beam-column assemblage middle joint. The
connection between the beam and the end columns is simplified to be a fixed connection in order to give an easy calculation of the compression arch action capacity. The simplification of the boundary conditions leads to facilitate the proposed equations, also allowing for a feasible solution to the design engineers. The assemblage resistance to successive collapse is guaranteed by the end flexural abilities of the beams (i.e. Me1 and Me2) as shown in Fig. 5. Under
compression arch action stage, the beam displacement increases as shown in Fig. 4. Using the Park’s model [23], which is based on internal force equilibrium under the effect of concentrated loads, the ultimate resistance capacity (Pu) at CAA stage can be concluded through the following equations:
Assemblage Axial Force N= Ne= Nm (6)
Assemblage Shear Load V= Ve= Vm (7)
Vertical Load, P=2V (8) Talking moment at the assemblage end fixed connection;
=2( + − ) (10)
Where: Mpe1 and Mpm1 are the assemblage first
span plastic moments. The following sections present the derivation of assemble axial forces and plastic moments. Based on Lu,X et al. [6], the maximum displacement Δu can be obtained as
follows:
= 0.0005
ℎ (11)
For slab-beam-column sub-assemblage, the maximum displacement is given by:
= 0.000276 0.0023 (
b+ 0.9875 + 0.50 b (12)
3. EVALUATION OF GOVERNING
PARAMETERS OF PROPOSED MODEL
3.1 Confined Compressive Strength of Concrete
The experimental results done by the researches in this field show that reinforcement configuration has a noticeable effect on the beam-column assemblage arch action capacity. Subsequently, the contribution of seismic and non-seismic detailing is assessed through an increasing factor in the concrete compressive strength. Mander et al., [24] stated that the confinement of concrete sections by appropriate stirrups layout leads to an increase in both ductility and strength of the concrete member. Utilizing Mander [24] findings, results in the following enhancement in the considered concrete compressive strength.
= −1.254 + 2.254 1 + 7.94
fc − 2 fc (13)
Where fc and fcc are the unconfined concrete and
confined concrete compressive strength respectively. fl is the concrete effective lateral
stress and given through Eq. (14).
= 0.50
(14)
Where fyst is the stirrups yield stress. ρst is the ratio
of transverse reinforcement to the confined concrete core. Ke is the confinement effectiveness
coefficient and equal to the ratio of effectively confined concrete to the full concrete section.
3.2 Calculation of Assemblage Axial Force
Referring to Figs. 3, 4, and 5, by equilibrating the beam internal forces, the assemblage axial forces can be calculated as follows:
= + − (15)
Where: Cc, Cs are the total compressive forces in
concrete and steel respectively, and Ts is the
tension force in reinforcing steel bars. The compressive forces Cc, Cs and steel tension force
Ts can be calculated as follows:
= fcc β (16)
`= ε′ ′
( if ε′ < ε ) f ′ ( if ε′ ≥ ε )
(17)
= fy As (18)
ε = (1 − d`/ ) ε (19)
The factor α is the stress reduction factor with a value of 0.67 for ECP-203-2017 [25] and 0.85 for ACI-318-14 [26]. The factor β is the equivalent compression block depth with a value of 0.80 for ECP-203-2017 [25] and 0.85 for ACI-318-14 [26].
3.3 Determination of Plastic Moments
By equilibrating the beam internal forces in accordance with neglecting the contributions of the beam axial force, and reinforcement configurations Usefi et al., [27] evaluated the peak flexural load. Noting that the subscripts e and m describe the assemblage end and middle points correspondingly. The contribution of assemblage peak flexural capacity PBf can be calculated
separately in Eq. (20) as follows;
PBf= + (20)
Where:
Mpe2 and Mpm2 are the plastic moments relating to
the second span of the assemblage.
Regarding the middle point, the area of compression reinforcing steel bars is larger compared with the area of tension reinforcement. Consequently, the compression zone depth is roughly equivalent to 2 d` Jian et al. [20]. The plastic moment at the middle section is given as:
Fig. 4. Free body diagram at peak arch action
Fig. 5. Moments and forces at the middle and end sections of the beam
Concerning the end section, the area of tension reinforcement is larger than the area of reinforcing steel bars. Therefore, the compression zone depth (c) and the plastic moment at the end section are calculated as follows:
=( As − As`) fcc b ≰ 2 `
= fy As` ( − `) +
fcc b ( − /2)
In view of the published laboratory results related to the samples containing flanged sections, these samples provide extra resistance to the progressive collapse compared with rectangular specimens. Due to the existence of the concrete flange in the middle section, the concrete crushes before the yielding of upper reinforcement. In the other hand, regarding beam end section, the upper reinforcement yields and the lower compression steels did not yield at the peak loads. In other words, the end plastic mome is increased by adding the effect of concrete flange reinforcement. The interconnection between assemblage beam and slabs increase the compression arch action capacities.
Fig. 4. Free body diagram at peak arch action
Moments and forces at the middle and end sections of the beam
Concerning the end section, the area of tension reinforcement is larger than the area of reinforcing steel bars. Therefore, the compression zone tic moment at the end
(22)
(23)
In view of the published laboratory results related to the samples containing flanged sections, these samples provide extra resistance to the progressive collapse compared with rectangular specimens. Due to the existence of the concrete e section, the concrete crushes before the yielding of upper reinforcement. In the other hand, regarding beam end section, the upper reinforcement yields and the lower compression steels did not yield at the peak loads. In other words, the end plastic moment Mpe
is increased by adding the effect of concrete flange reinforcement. The interconnection between assemblage beam and slabs increase the compression arch action capacities.
4. VALIDATION, COMPARAT PARAMETRIC STUDIES
4.1 Validation Studies with Experimental Results
With the aim of validating the proposed CAA model, seventy-nine beam-column assemblages were collected from the published researches and evaluated. The samples selected for the verification process were mentioned in [
The selected specimens had shear span to depth ratio (L/h) varying from 3.60 to 11.72 and the measured concrete strength ranged from 12.57 to 67.1 MPa. The longitudinal reinforcing steel yield strength ranged from 340 to 558 MPa. The specimen’s longitudinal reinforcement ratios varied from 0.33% to 2.78%. Generally, the proposed model provides good estimations for most of the collected beam
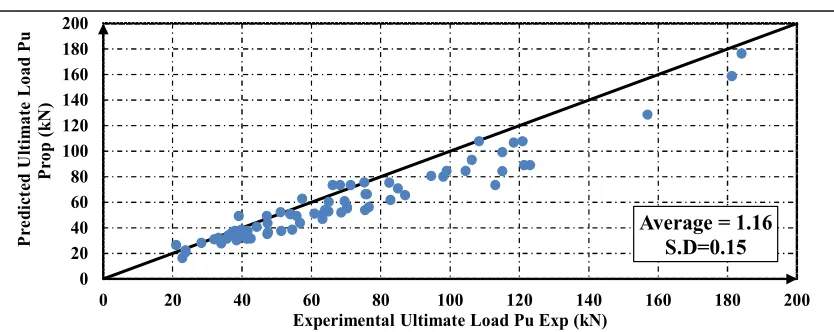
assemblages. The predicted results in comparison with experimental ones are displayed in a graphical presentation as shown Figs. 6 and 7. The experimental flexure and compression arch action capacities in addition to the anticipated predicted capacities are presented in the figures. The mean values of the
Moments and forces at the middle and end sections of the beam
VALIDATION, COMPARATIVE, AND
with Experimental
experimental to the theoretical ratio for calculating flexure and compression arching capacities (Py and Pu CAA) are 1.15 and 1.16,
respectively. The standard deviation (STDV) are about 0.23 and 0.15 for predicting flexure and compression arching capacities respectively. Regarding the average and standard deviation values, the proposed model presents acceptable estimations to both flexure and arching capacities. Concerning the comparisons made, it can be said that the proposed model is on the prudent side and well-judged to the behavior of the beam-column assemblage.
4.2 Comparative Studies with Some
Existing Models
To ensure further verification of the proposed model, the pre-described assemblages were evaluated using some existing models. Therefore, the peak compression arch action
capacity of seventy-nine beam-column assemblages has been re-evaluated by Park [23] and Usefi [27] models. Figs. 8 and 9 outline the calculated ratios of the experimental arching capacity Pu-expand theoretical arching capacity Pu-model for all models. The average ratio of the laboratory and the model's predictions are 1.21 and 1.20 for Park [23] and Usefi [27], respectively. The standard deviation for both models is about 0.26. By comparing the two existing models with the proposed one, the average is higher by 4.50%. This difference can be explained by the fact that the proposed model includes the effect of the reinforcement configurations of the samples in addition to the effect of the flanged sections and their reinforcing bars in the calculation of peak arching capacities. In summary, the suggested model has the ability to calculate arching action capacities with the most influential variables to the beam-column assemblages.
Fig. 6. Load capacity predictions by the proposed model
Fig. 7. Predicted ultimate loads using the proposed model 0
20 40 60 80 100 120 140
0 20 40 60 80 100 120 140
P
re
d
ic
te
d
F
le
x
u
r
a
l
C
a
p
a
ci
ty
P
y
P
ro
p
(
k
N
)
Experimental Flexural Capacity Py Exp (kN)
Average = 1.15 S.D=0.23
0 20 40 60 80 100 120 140 160 180 200
0 20 40 60 80 100 120 140 160 180 200
P
re
di
ct
ed
U
lt
ima
te
L
o
a
d
P
u
P
ro
p
(
k
N
)
Experimental Ultimate Load Pu Exp (kN)
Fig. 8. Predicted ultimate loads using Park’s model [23]
Fig. 9. Predicted ultimate loads using Usefi’s model [27]
4.3 Parametric Studies
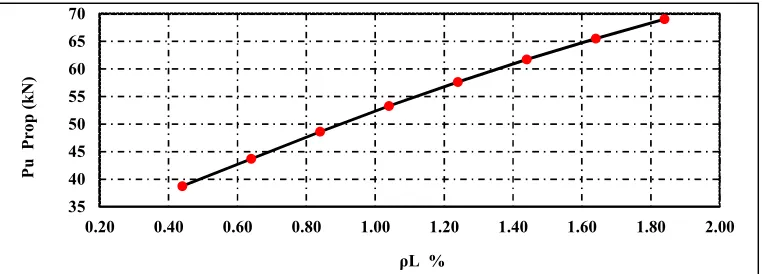
Typical beam-column assemblage was chosen in order to determine the effect of different parameters on the proposed peak arching action capacities. Figs. 10 and 11 show the variations of the predicted arching action with material parameters which include concrete compressive strength, and assemblage longitudinal reinforcing bars ratios. The arching capacity increases with the increase of material parameters. The arching capacity enhancement
ratio due to the increase in concrete strengths is limited compared to the change in other material parameters. By increasing concrete strength
from 25 MPa to 30 MPa (20% increment), the increase factor of arching capacity is about
4% which is a limited value. The increase of
longitudinal reinforcement parameters has the same trend in increasing arching capacities.
The increasing ratio of arching actions is more than 20% relating to 35% increase in the bottom and top longitudinal reinforcement ratios.
Fig. 10. Effects of concrete strength on the proposed peak arch action capacity
0 50 100 150 200
0 20 40 60 80 100 120 140 160 180 200
P
re
d
ic
te
d
U
lt
im
a
te
L
o
a
d
P
u
P
a
r
k
(
k
N
)
Experimental Ultimate Load Pu Exp (kN)
Average = 1.21 S.D=0.26
0 50 100 150 200
0 20 40 60 80 100 120 140 160 180 200
P
re
d
ic
te
d
U
lt
im
a
te
L
o
a
d
P
u
U
se
fi
(k
N
)
Experimental Ultimate Load Pu Exp (kN)
Average = 1.20 S.D=0.26
35 40 45 50 55 60 65 70
20 25 30 35 40 45 50 55 60 65
P
u
P
r
o
p
(
kN
)
Fig. 11. Effects of longitudinal steel ratios on the proposed peak arch action capacity
Figs. 12 and 13 show the differences of the proposed arching action with assemblage geometrical parameters that include the assemblage effective slab width in addition to the shear span to depth ratio. The increase of the slab effective width leads to an increase in the arching capacity while the increase in the beam-column assemblage spans leads to a decrease in the peak arching capacities. By increasing the
slab effective width from 900 mm to 1200 mm (33% increment), the increase factor of arching capacity is about 12%. The decreasing ratio of arching actions is more than 22% relating to 25% increase in the shear span to depth ratios. It is obvious that the geometrical parameters in terms of assemblage span, depth, and effective slab width have a significant effect on the arching actions capacities.
Fig. 12. Effects of slab effective width on the proposed peak arch action capacity
Fig. 13. Effects of span-depth ratios on the proposed peak arch action capacity
35 40 45 50 55 60 65 70
0.20 0.40 0.60 0.80 1.00 1.20 1.40 1.60 1.80 2.00
P
u Pro
p (k
N
)
ρL %
60 65 70 75 80 85 90 95
0 150 300 450 600 750 900 1050 1200 1350
Pu P
rop
(k
N)
Slab Width B (mm)
40 60 80 100 120 140 160 180
3 4 5 6 7 8 9 10 11 12
Pu
Pro
p
(k
N
)
5. CONCLUSION
From the validation, comparative and parametric studies for the proposed model of RC beam-column assemblage under a middle beam-column removal scenario, the following conclusions are made:
1. The validation study for seventy-nine tested assemblages, indicates that the proposed analytical model for predicting the flexural action and compression arch action capacities, provides a good estimation for beam-column assemblages with several geometrical, reinforcement configurations, and material parameters. The mean values of the experimental to the theoretical ratio for calculating flexure and compression arching capacities (Py
and Pu CAA) are 1.15 and 1.16,
respectively. The standard deviations (STDV) are about 0.23 and 0.15 for predicting flexure and compression arching capacities.
2. For Park and Usefi’s models, the average ratio of experimental peak compression arch action capacity of seventy-nine assemblages and the model's predictions are 1.21 and 1.20 for Park and Usefi’s, respectively. By comparing the two existing models to the proposed one, the average is higher by 4.50%. This difference can be explained by the fact that the proposed model includes the effect of the reinforcement configurations of the samples in addition to the effect of the flanged sections and their reinforcing bars. 3. The parametric study showed that the
compression arch action capacity, significantly increases with increase of the flexural steel ratios. Also, it decreases with the increase of assemblage shear span to depth ratios. The existence of concrete flange leads to great enhancement in the arching action capacities, on the other hand, the concrete compressive strength had a limited effect of the arching capacity.
COMPETING INTERESTS
Authors have declared that no competing interests exist.
REFERENCES
1. Department of Defense (DoD). Design of structures to resist progressive collapse.
Unified facility criteria, UFC 4-023-03, Washington, DC; 2016.
2. General Services Administration (GSA). Alternate path analysis and design guidelines for progressive collapse resistance. Washington, DC; 2016.
3. Farhang V, N Valipour, H Samali, B Foster S. Development of arching action in longitudinally-restrained reinforced concrete beams. Construction and Building Materials, Elsevier BV. 2013;47:7–19. 4. Marjanishvili, SM. Progressive analysis
procedure for progressive collapse. Journal of Performance of Constructed Facilities. 2004;18(2):79-85.
5. Qian K, Li B. Slab effects on response of reinforced concrete substructures after loss of corner column. ACI Struct J. 2012; 109(6):845–55.
6. Lu X, Lin K, Li C, Li Y. New analytical calculation models for compressive arch action in reinforced concrete structures. Engineering Structures, Elsevier BV. 2018; 168:721–735.
7. Pour HV, Vessali N, Foster SJ, Samali B. Influence of concrete compressive strength on the arching behavior of reinforced concrete beam assemblages. Advances in Structural Engineering, Sage Publications. 2015;18(8):1199–1214.
8. Su Y, P Tian, Y Song, XS. Progressive collapse resistance of axially-restrained frame beams. ACI Structural Journal. 2009;106(5):600-607.
9. Yu J, Tan KH. Special detailing techniques to improve structural resistance against progressive collapse. Journal of Structural Engineering, American Society of Civil Engineers (ASCE). 2014;140(3):4013077. 10. Tsai MH, Huang TC. Collapse-resistant
performance of rc beam–column sub-assemblages with varied section depth and stirrup spacing. The Structural Design of Tall and Special Buildings. 2015;24(8): 555–570.
11. Chanh TH, Jongyul P, Jinkoo K. Progressive collapse-resisting capacity of rc beam–column sub-assemblage. Magazine of Concrete Research. 2011; 63(4):297-310.
12. Elsayed WM, Abdel Moaty, MAN, Issa M E. Effect of reinforcing steel debonding on rc frame performance in resisting progressive collapse. HBRC Journal, Informa UK Limited. 2016;12(3):242–254. 13. Ren P, Li Y, Lu X, Guan H, Zhou Y.
collapse resistance of one-way reinforced concrete beam–slab substructures under a middle-column-removal scenario. Engineering Structures, Elsevier BV. 2016; 118:28–40.
14. Lu X, Lin K, Li Y, Guan H, Ren P, Zhou Y. Experimental investigation of rc beam-slab substructures against progressive collapse subject to an edge-column-removal scenario. Engineering Structures, Elsevier BV. 2017;149:91–103.
15. Bao Y, Lew HS, Kunnath SK. Modeling of reinforced concrete assemblies under column-removal scenario. Journal of Structural Engineering, American Society of Civil Engineers (ASCE). 2014;140(1): 4013026.
16. KangS-B, Tan KH. Behavior of precast concrete beam–column sub-assemblages subject to column removal. Engineering Structures, Elsevier BV. 2015;93:85–96. 17. Alogla K, Weekes L, Nelson L. A new
mitigation scheme to resist progressive collapse of rc structures. Construction and Building Materials, Elsevier BV. 2016;125: 533–545.
18. Ahmed N Khater. Progressive collapse assessment of reinforced concrete beam-column assemblages. PhD Thesis, Faculty of Engineering, Benha University, Cairo Egypt; 2016.
19. Abbasnia R, Nav FM. A theoretical method for calculating the compressive arch capacity of rc beams against progressive collapse. Structural Concrete, Wiley. 2016; 17(1):21–31.
20. Jian H, Zheng Y. Simplified models of progressive collapse response and progressive collapse-resisting capacity curve of rc beam-column substructures. Journal of Performance of Constructed Facilities, American Society of Civil Engineers (ASCE). 2014;28(4):4014008. 21. Paula T, Priestley MJN. Seismic design of
reinforced concrete and masonry buildings. John Wiley & Sons, Inc; 1992.
22. Yu J, Tan KH. Analytical model for the capacity of compressive arch action of reinforced concrete sub-assemblages. Magazine of Concrete Research, Thomas Telford Ltd. 2014;66(3):109–126.
23. Park R, Gamble WL. Reinforced concrete slabs. John Wiley & Sons; 2000.
24. Mander JB, Priestley MJN, Park R. Observed stress-strain behavior of confined concrete. Structure Engineering. ASCE. 1988;114(8):1827-1849.
25. Egyptian Code of Practice: ECP 203. Design and Construction for Reinforced Concrete Structures, Ministry of Building Construction, Research Center for Housing, Building and Physical Planning, Cairo, Egypt; 2017.
26. ACI American Concrete Institute. ACI 318-14: building code requirements for structural concrete. Farmington Hills, Michigan, USA;2014.
27. Usefi N, Mohajeri NF, Abbasnia R. Analytical investigation of reinforced concrete frames under middle column removal scenario. Advances in Structural Engineering, Sage Publications. 2017; 21(9):1388–1401.
© 2019 Beshara et al.; This is an Open Access article distributed under the terms of the Creative Commons Attribution License (http://creativecommons.org/licenses/by/4.0), which permits unrestricted use, distribution, and reproduction in any medium, provided the original work is properly cited.
Peer-review history:
![Fig. 1. Compression arch action capacity in beam-column assemblage [19]](https://thumb-us.123doks.com/thumbv2/123dok_us/9830684.1969203/2.612.179.435.580.690/fig-compression-arch-action-capacity-beam-column-assemblage.webp)
![Fig. 9. Predicted ultimate loads using Usefi’s model [27]](https://thumb-us.123doks.com/thumbv2/123dok_us/9830684.1969203/8.612.145.467.96.425/fig-predicted-ultimate-loads-using-usefi-s-model.webp)