Available Online at www.ijpret.com 15
INTERNATIONAL JOURNAL OF PURE AND
APPLIED RESEARCH IN ENGINEERING AND
TECHNOLOGY
A PATH FOR HORIZING YOUR INNOVATIVE WORKMULTI RESPONSE OPTIMIZATION OF MACHINING PARAMETERS IN ELECTRO
DISCHARGE MACHINING OF AISI 304 USING DESIRABILITY WITH GREY
RELATIONAL ANALYSIS
MUNMUN BHAUMIK1, KALI PADAMAITY2
1. PhD. Scholar, Department of Mechanical Engineering, NIT Rourkela, Rourkela, INDIA. 2. Professor, Department of Mechanical Engineering, NIT Rourkela, Rourkela, INDIA.
Accepted Date: 05/03/2015; Published Date: 01/05/2015
\
Abstract: With the increasing demands of high surface finish and machining of complex shape geometries, conventional machining process are now replaced by non-traditional machining processes.EDM is one of them and used for hard and difficult-to-machine materials.In this study an effort has been taken to optimize the output responses , i.e. Material removal Rate(MRR) and Surface Roughness(Ra) by using the hybrid optimization technique namely Desirability Function (DF)
couple with Grey Relational Analysis(GRA) when machining of Stainless Steel (AISI 304). The optimal parameter setting for getting the maximum MRR and minimum Ra is obtained by this technique.
Tungsten Carbide (WC) is used as electrode material. Taguchi L27orthogonal array (OA) has been
applied for designing the experiments. Process parameter considered are peak current (Ip), pulse on time (Ton), gap voltage (Vg), duty cycle (t). Significance of each input parameter is obtained by statistical analysis of variance (ANOVA). The optimal EDM parameter settings were found to be Ip = 2 A, Vg = 65V, Ton = 150 µs, t = 55%.
Keywords: Electro Discharge Machining; Grey relational analysis; AISI 304; Taguchi methodology; Tungsten carbide.
Corresponding Author: MR. MUNMUN BHAUMIK
Access Online On:
www.ijpret.com
How to Cite This Article:
Available Online at www.ijpret.com 16
INTRODUCTION
Electro discharge machining is most popular non-conventional electro thermal machining process where electrical energy is used to generate spark and thermal energy used to remove material from work piece. S. Dewangan and C. K. Biswas [1] found out the optimization process of multiple responses for improving MRR and lowering the TWR. AISI P20 tool steel used as
work material and cylindrical copper is used as tool material. Here Taguchi L27 OA used to
design the experiment. By using grey relational analysis they found that Ip = 8 A, Ton = 500 μs, Tup = 0.0 s, Tw = 1 s, and IEG = 170 μm is the optimal condition for maximum MRR and minimum TWR simultaneously. S. R. Ramanujam et al. [2] found out the optimal parameter for
end milling operation for Inconel 718 super alloy. The study was carried out by using Taguchi L9
orthogonal array method analyzed by desirability method. The analysis of variance (ANOVA) applied to investigate the effect of influential parameter. G. Nandi et al. [3] had made an
attempt to search optimal process parameter for submerged arc weld for mild steel. Taguchi L25
OA used for designing the experiment. Here two hybrid method has been applied for analyze the experiment. One is Taguchi method coupled with grey relational analysis and other is Taguchi method combined with Desirability function (DF).S. D.Lahane et al. [4] used weighted principle component (WPC) method to optimize the machining parameter on High Speed Steel (HSS) workpiece in wire electrical discharge machining. H.S. Lu et al. [5] investigated the optimization design of cutting parameters for rough cutting processes in high-speed end milling on SKD61 tool steel. Grey relational analysis coupled with principle component analysis applied for determine the optimal value.
So from the above literature survey it isclear that few research papers related to hybrid optimization technique on machining parameter of electro discharge machining are present. The objective of this study is to determine the optimum parameter level by applying the hybrid method (desirability coupled with grey relational analysis) on AISI 304 material.
MATERIALS AND METHOD
EDM operation of AISI 304 has been carried out using WC Electrode. Experiment has been
conducted as per L27OA.
The machine is used for this investigations is ELECTRONICA- ELECTRAPLUS PS 50 ZNC.EDM oil is used as dielectric fluid.
Input parameters select for the experiments are: (i) Peak Current(Ip), (ii) pulse-on-time (Ton), (iii)
Available Online at www.ijpret.com 17
Output functions are: (i) Material Removal Rate (mm3min-1), (ii) Surface Roughness
(µm).Experimental details are tabulated in Table 1.
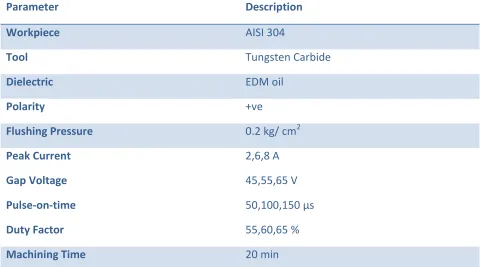
Table 1. Experimental Details
Parameter Description
Workpiece AISI 304
Tool Tungsten Carbide
Dielectric EDM oil
Polarity +ve
Flushing Pressure 0.2 kg/ cm2
Peak Current
Gap Voltage
Pulse-on-time
Duty Factor
2,6,8 A
45,55,65 V
50,100,150 µs
55,60,65 %
Machining Time 20 min
Experiment was performed randomly according to the design matrix. Material removed from the work piece was obtained using the weight loss method and converted to volumetric material loss. Surface roughness was measured by using Talysurf (TAYLOR HOBSON, SURTRONIC 3+).
MRR=
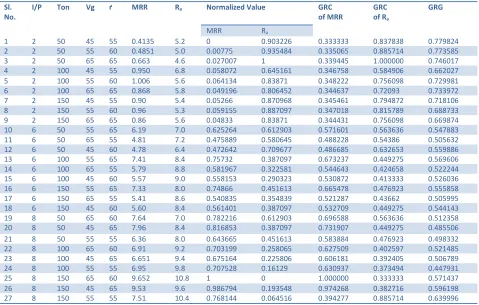
Experimental layout, result and GRG value are tabulated in Table 2.
RESULT AND DISCUSSION
Optimization using desirability with grey relational analysis (GRA)
Available Online at www.ijpret.com 18 Here the steps involved in the optimization process are detailed below.
Step 1. The first step is the calculation of desirability index (di) for each output response. Higher
the better is considered for material removal rate and lower the better is considered for surface roughness. Hence the desirability index value for material removal rate and surface roughness are calculated by equation (b) and equation (e) respectively.
Desirability for Higher-the-better (HB)
If ymin, di = 0 (a)
If ymin ymax, di=
r
(b)
If ymax ,di = 1 (c)
Desirability for Lower-the-better (LB)
If ymin, di = 1 (d)
If ymin ymax, di =
r
(e)
If ymax ,di = 0 (f)
Where, ymin denotes the lower tolerance limit of ,ymax denotes the higher tolerance limit of
,didenotes the desirability value, r represents the desirability function index, which is
considered as 1 for this study.
Step 2. Calculation of grey relational coefficient (GRC)
GRC {ζi(k)} is calculated using the following equation:
ζi (k) =
(g)
Where, Δminand Δmaxare the global minimum and maximum values in different data series,
respectively of the kthresponse. Δi(k) is the kth value in Δi different data series. ζ is the
distinguishing factor whose value lies in between 0 to 1. Its purpose is to expand or compress the range of grey relation coefficient. In this experiment the distinguishing factor considered is 0.5.
Available Online at www.ijpret.com 19 Performance of the multi response is evaluated by GRG. It is the weighted summation of all the GRC’s and is calculated using the following expression:
γ = (k) (h)
Step 4. Performing statistical analysis of variance (ANOVA) for the input parameter with the GRG to find out the parameter significantly affecting the process.
Step 5. Determine the optimal levels for process parameters.
Table 2. Experimental table and GRG value
Sl. No.
I/P Ton Vg ґ MRR Ra Normalized Value GRC
of MRR
GRC of Ra
GRG
MRR Ra
1 2 50 45 55 0.4135 5.2 0 0.903226 0.333333 0.837838 0.779824 2 2 50 55 60 0.4851 5.0 0.00775 0.935484 0.335065 0.885714 0.773585 3 2 50 65 65 0.663 4.6 0.027007 1 0.339445 1.000000 0.746017 4 2 100 45 55 0.950 6.8 0.058072 0.645161 0.346758 0.584906 0.662027 5 2 100 55 60 1.006 5.6 0.064134 0.83871 0.348222 0.756098 0.729981 6 2 100 65 65 0.868 5.8 0.049196 0.806452 0.344637 0.72093 0.733972 7 2 150 45 55 0.90 5.4 0.05266 0.870968 0.345461 0.794872 0.718106 8 2 150 55 60 0.96 5.3 0.059155 0.887097 0.347018 0.815789 0.688733 9 2 150 65 65 0.86 5.6 0.04833 0.83871 0.344431 0.756098 0.669874 10 6 50 55 65 6.19 7.0 0.625264 0.612903 0.571601 0.563636 0.547883 11 6 50 65 55 4.81 7.2 0.475889 0.580645 0.488228 0.54386 0.505632 12 6 50 45 60 4.78 6.4 0.472642 0.709677 0.486685 0.632653 0.559886 13 6 100 55 65 7.41 8.4 0.75732 0.387097 0.673237 0.449275 0.569606 14 6 100 65 55 5.79 8.8 0.581967 0.322581 0.544643 0.424658 0.522244 15 6 100 45 60 5.57 9.0 0.558153 0.290323 0.530872 0.413333 0.526036 16 6 150 55 65 7.33 8.0 0.74866 0.451613 0.665478 0.476923 0.555858 17 6 150 65 55 5.41 8.6 0.540835 0.354839 0.521287 0.43662 0.505995 18 6 150 45 60 5.60 8.4 0.561401 0.387097 0.532709 0.449275 0.544143 19 8 50 65 60 7.64 7.0 0.782216 0.612903 0.696588 0.563636 0.512358 20 8 50 45 65 7.96 8.4 0.816853 0.387097 0.731907 0.449275 0.485506 21 8 50 55 55 6.36 8.0 0.643665 0.451613 0.583884 0.476923 0.498332 22 8 100 65 60 6.91 9.2 0.703199 0.258065 0.627509 0.402597 0.521485 23 8 100 45 65 6.651 9.4 0.675164 0.225806 0.606181 0.392405 0.506789 24 8 100 55 55 6.95 9.8 0.707528 0.16129 0.630937 0.373494 0.447931 25 8 150 65 60 9.652 10.8 1 0 1.000000 0.333333 0.571437 26 8 150 45 65 9.53 9.6 0.986794 0.193548 0.974268 0.382716 0.596198 27 8 150 55 55 7.51 10.4 0.768144 0.064516 0.394277 0.885714 0.639996
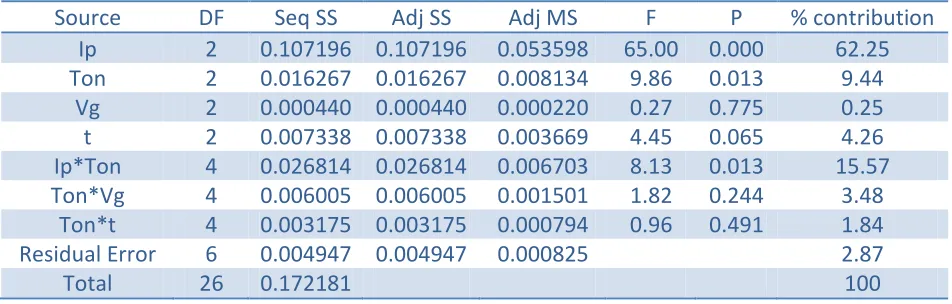
ANALYSIS OF VARIANCE (ANOVA)
Available Online at www.ijpret.com 20 machining parameter on GRG. From ANOVA table it is seen that only peak current significantly affect the multi response. And it has 62.55% contribution on GRG.
Table 2. ANOVA table for GRG
Source DF Seq SS Adj SS Adj MS F P % contribution
Ip 2 0.107196 0.107196 0.053598 65.00 0.000 62.25
Ton 2 0.016267 0.016267 0.008134 9.86 0.013 9.44
Vg 2 0.000440 0.000440 0.000220 0.27 0.775 0.25
t 2 0.007338 0.007338 0.003669 4.45 0.065 4.26
Ip*Ton 4 0.026814 0.026814 0.006703 8.13 0.013 15.57
Ton*Vg 4 0.006005 0.006005 0.001501 1.82 0.244 3.48
Ton*t 4 0.003175 0.003175 0.000794 0.96 0.491 1.84
Residual Error 6 0.004947 0.004947 0.000825 2.87
Total 26 0.172181 100
Fig. 1 graphically represents the main effect plot for GRG. GRG always considered for “Higher-the-better”. This graph exposes the optimal EDM parameters I/P= 2 A, Ton= 150 µs, Vg= 65 V and г= 55 %.
CONFIRMATION TEST
The confirmation experiment is the ultimate stage to calculate and confirm the progress of the quality characteristics using the optimum level of the design parameter. The confirmation experiment was carrying out by setting the process parameters at optimum level. The estimated or predicted GRG γ ) at the optimum level of the machining parameter can be calculated by
γ = γm + ∑_ i=1)^q▒〖( 〗 γ_i ) – γm) i)
Available Online at www.ijpret.com 21
Fig. 1 Main effect plot for GRG
Table 3. Results of machining performance using initial and optimal machining parameters
Initial machining
parameters
Optimum machining
parameter
Prediction Experiments
Settings level Ip2Ton2Vg3t1 Ip1 Ton3Vg3t1 Ip1 Ton3Vg3t1
Grey Relational Grade 0.534982 0.583211 0.641778
S/N Ratio for GRG -5.43321 -4.68348 -3.85230
Improvement GRG 0.106796
Note: Improvement in GRG =16.64%
CONCLUSION
The present study investigates the desirability with grey relational analysis was adopted to
optimize the EDM process with multiple performance characteristics, MRR and Ra.
The optimal EDM parameter settings were found to be I/P = 2 A, Vg = 65V, Ton = 150 µs, t=
55%.
Peak current is the only significant factor for all four output parameters.
1. Improvement of GRG for optimum level is 16.64%.
8 6
2 0.65
0.60
0.55
0.50
150 100
50
65 55
45 0.65
0.60
0.55
0.50
65 60
55 I/P
M
ea
n
of
M
ea
ns
T on
Vg t
Available Online at www.ijpret.com 22
REFERENCE:
1. Jeyapaul P. Shahabudeen, K. Krishnaiah, Simultaneous optimization of multi-response
problemsin the Taguchi method using genetic algorithm, Int J Adv Manuf Technol. 2006; 30: 870–878.
2. S. Dewangan, C. K. Biswas, Optimization of machining parameters using grey relation analysis
for EDM with impulse flushing, Int. J. Mechatronics and Manufacturing Systems,2013; 6(2): 144-158.
3. R. Ramanujam, L.M. Maiyar, K. Venkatesanans M. Vasan, Multi Response Optimization Using
ANOVA And Desirability Function Analysis: A Case Study In End Milling Of Inconel Alloy, ARPN Journal of Engineering and Applied Sciences, 2014; 9(3): 457-463.
4. G. Nandi, S. Datta, A. Bandyopadhyay, P.K. Pal, Analyses of hybrid Taguchi methods for
optimization of submerged arc weld, Joining Processes: Challenges for Quality, Design and Development, March 5-6, 2010 ;1-21: National Institute of Technology, Agartala, Tripura.
5. S. D. Lahane, M. K. Rodg, S.B. Sharma, Multi-response optimization of Wire-EDM process
using principal component analysis, IOSR Journal of Engineering (IOSRJEN) , 2012; 2(8): 38-47.
6. S. Choudhary, K. Kant and P. Saini, Analysis of MRR and SR with Different Electrode for SS
316 on Die-Sinking EDM using Taguchi Technique, Global Journal of Researches in Engineering Mechanical and Mechanics Engineering, 2013; 13(3): 14-21.
7. M. Durairaj, D. Sudharsun, N. Swamynathan, Analysis of Process Parameters in Wire EDM
with Stainless Steel using Single Objective Taguchi Method and Multi Objective Grey Relational
Grade, Procedia Engineering, 2013; 64:868 – 877.
8. K. Sampark and Kwang-Jae Kim, Optimizing multi-response surface problems: How to