DEMOGRAPHIC RESEARCH
VOLUME 31, ARTICLE 12, PAGES 319
−
336
PUBLISHED 31 JULY 2014
http://www.demographic-research.org/Volumes/Vol31/12/ DOI: 10.4054/DemRes.2014.31.12
Descriptive Finding
Fertility and education in Poland during state
socialism
Zuzanna Brzozowska
© 2014 Zuzanna Brzozowska.
This open-access work is published under the terms of the Creative Commons Attribution NonCommercial License 2.0 Germany, which permits use, reproduction & distribution in any medium for non-commercial purposes, provided the original author(s) and source are given credit.
1 Introduction 320
2 Data and methods 320
2.1 Data 320
2.2 Methods 322
3 Results 324
3.1 Educational differences in completed fertility 324 3.2 Decomposition of the fertility changes 325
4 Discussion and conclusions 327
5 Acknowledgments 329
References 330
Fertility and education in Poland during state socialism
Zuzanna Brzozowska1
Abstract
BACKGROUND
Studies on fertility in Poland focus on the turbulent transition period and its consequences. However, during state socialism significant societal and demographic changes took place.
OBJECTIVE
This article studies the macro-level relationship between education and completed fertility of Polish women born between 1930 and 1959, and tries to assess how changes in women’s educational structure affected fertility.
METHODS
Using data from the large-scale Fertility Survey 2002 that accompanied the Polish population census, I first look into fertility trends by education and five-year cohorts. Then, by applying Cho’s and Retherford’s decomposition analysis and direct standardisation, I assess the role of women’s educational expansion in fertility changes.
RESULTS
Despite profound structural changes and the ruling egalitarian ideology, the educational gradient in completed fertility remained strongly negative in all analysed cohorts. The observed decline in completed fertility from 2.51 in the 1930–34 cohort to 2.22 in the 1955–59 cohort can be explained by the expansion of female education. Had the educational structure not changed, the completed fertility of the youngest cohort would have been slightly higher than that of the oldest cohort.
CONCLUSIONS
Under state socialism in Poland, better-educated women had on average fewer children than the less educated. The expansion of female education played an important role in fertility decline.
1. Introduction
Studies on fertility in Poland mostly focus on the transition and post-transition period (Kotowska et al. 2008; Okólski 2006, 2007), contrasting the dynamic reality of the market economy with the predictability and stability of state socialism. It was, however, the People’s Republic of Poland that experienced an educational revolution and shifted millions of people up to the basic vocational and secondary educational levels. It was also under state socialism that the average number of children a woman gave birth to (i.e., the completed fertility rate, CFR) declined substantially, from 2.8 to 2.2 in the 1930 and 1960 cohorts, respectively (Council of Europe 2005).
The likely strength of the relationship between education and fertility in communist Poland is difficult to assess, as there have been few studies on this topic. As, officially, the political system strove for equality in every aspect of life, one would expect small differences in fertility by the level of education. In practice, however, daily life was marked by social inequalities, which together with a means-tested family policy would speak for considerable educational differences in fertility, on a par with those in the Czech Republic, Russia, or Slovakia (Potančoková et al. 2008; Sobotka et al. 2008; Zakharov 2008).
This paper examines the relationship between education and cohort-completed fertility under state socialism in Poland. It describes fertility trends by education and quantifies the effect of female educational expansion on cohort fertility. In the last section it also discusses the meaning of education in Polish society during state socialism.
2. Data and methods
2.1 Data
The data come from the Fertility Survey that accompanied the 2002 Polish population census. From a representative sample of 264,845 women born between 1896 and 1986 I chose 116,969 females born between 1930 and 1959 (i.e., aged 43 to 72 at the time of the interview). After deleting cases with missing information on the number of children and on education, the final sample analysed in this paper covers 116,116 women (see Table A1 in Appendix for the distribution by cohort and education). The observations were weighted with post-stratification weights calculated from the Population Census 2002 by the Central Statistical Office.
Education (ISCED)2: primary and lower (up to 7-8 years of schooling, ISCED 0, 1, and 2); basic vocational (9‒11 years of schooling, ISCED 3C); secondary (11‒14 years of schooling, ISCED 3AB and 4); and tertiary (16 and more years of schooling, ISCED 5 and 6). Basic vocational education leads to skilled-worker jobs such as hairdresser, cook, or car mechanic. The category “secondary education” includes comprehensive and vocational secondary school, lasting for 4 and 5 years, respectively, and 1 to 2 years of post-secondary non-tertiary education.3 Comprehensive secondary school was usually chosen by people who were either planning to attend university afterwards or to acquire non-tertiary education, e.g., qualifications for jobs like nurse, secretary, or technician. Vocational secondary school graduates either decided on tertiary education or directly entered the labour market, working as technicians or highly skilled workers. Due to its very small numbers, the post-tertiary education (ISCED 6) category was merged with the tertiary level (ISCED 5). A university diploma provided eligibility for professions such as teacher, physician, lawyer, or other specialist; technical occupations like engineer were relatively seldom chosen by women.
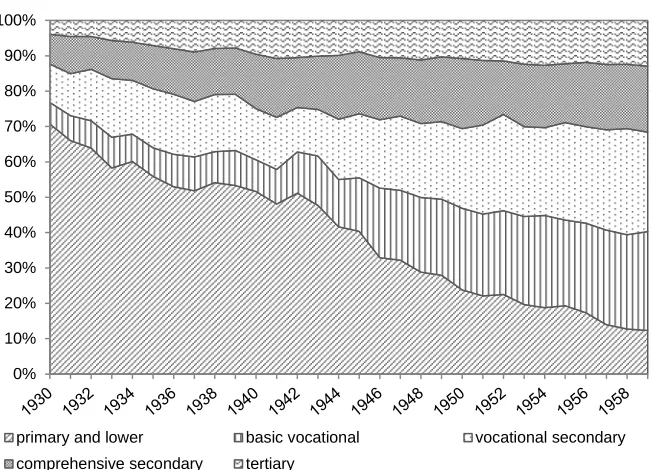
The distribution by cohort and education of the cleaned and weighted sample is presented in the graph below (Figure 1).
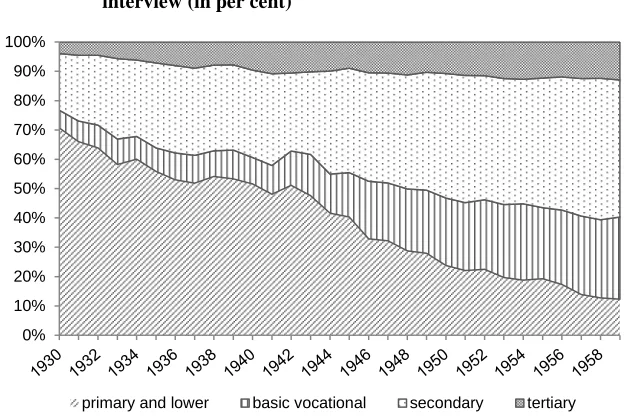
In the sample there are considerably fewer women born before and during the Second World War than afterwards (see Table A1 in Appendix), which raises doubts about the representativeness of the cohorts born before 1946. Including respondents at high ages in the analysis adds a potential source of bias, but there are good reasons for doing so, nonetheless. First, as seen in Figure 1, the cumulative distribution of educational attainment does not show any irregularities for cohorts born before 1946. There are some ups and downs among women with primary and basic vocational education born between 1932 and 1945, but the trend is very consistent: with time, the proportion of the least educated declines drastically, the proportion of women with basic vocational and secondary education increases sharply, and the proportion of those with tertiary education gradually goes up. Second, retrospective analyses conducted on women aged up to 70 and more are not uncommon in contemporary demography (cf. Neels and De Wachter 2010). Third, the completed fertility of female cohorts born 1930 and after published by the Council of Europe (2005) differs little from the completed
2 I use the 1997 ISCED version. For details, please visit http://www.uis.unesco.org/Education/Pages/ international-standard-classification-of-education.aspx.
fertility calculated here: the difference amounts to 5% and 6% for the 1935 and 1940 cohorts, respectively (for details see Table A2 in Appendix).
Figure 1: Cumulative distribution by cohort and education at the time of the interview (in per cent)
Source: Author’s own calculations based on Fertility Survey 2002
For the sake of comparability over cohorts, I assumed that women’s reproductive careers end at age 43 (as the youngest analysed cohort was 43 years old at the time of the interview). This common practice of ignoring a very minor portion of fertility at very high childbearing ages (Cohen et al. 2011; Kravdal and Rindfuss 2008) allowed me to include as many as 30 cohorts in the analysis with a loss of not more than 0.5% of the cohort completed fertility (see Table A2 in the Appendix for a comparison of the truncated and completed fertility with the completed fertility given by the Council of Europe).
2.2 Methods
First, I analyse the completed fertility trends by education. Then I conduct a two-component decomposition, drawing on Cho’s and Retherford’s work (Canudas Romo 2003; Cho and Retherford 1973), which is a simple extension of the Kitagawa
0% 10% 20% 30% 40% 50% 60% 70% 80% 90% 100%
decomposition called “components of a difference between two rates” (Kitagawa 1955). Applying her decomposition framework, the difference between the CFR of cohorts born in year t and year t+h can be split into a change (1a) in the educational structure (compositional component) and (1b) in the specific (standardised) completed fertility rates (direct component):
∆𝐶𝐹𝑅(𝑡) =∑[𝐶𝐹𝑅(𝑡+ℎ)𝑖+𝐶𝐹𝑅(𝑡)𝑖
2
𝑖 ∗(𝜔(𝑡+ℎ)𝑖− 𝜔(𝑡)𝑖)] (1a)
+∑[𝜔(𝑡+ℎ)𝑖+𝜔(𝑡)𝑖
2
𝑖 ∗(𝐶𝐹𝑅(𝑡+ℎ)𝑖− 𝐶𝐹𝑅(𝑡)𝑖)] (1b)
where:𝜔(𝑡)𝑖=𝑛(𝑡)𝑖
𝑛(𝑡) and 𝜔(𝑡+ℎ)𝑖= 𝑛(𝑡+ℎ)𝑖
𝑛(𝑡+ℎ) , and denote the proportion of educational
group i in the cohorts t and t+h, respectively.
In order to relate the fertility changes to period, I further decompose expression (1b) into the standardised age-specific fertility rates (ASFRs). For simplicity and clarity, let us call it the difference in the standardised fertility component (and denote it as ΔSFC). As the CFR is calculated as the sum of ASFRs, i.e.,
𝐶𝐹𝑅=∑ 𝐴𝑆𝐹𝑅𝑗 𝑗 , (2)
the decomposition can be written as:
∆𝑆𝐹𝐶(𝑡) =�[𝜔(𝑡+ℎ)2𝑖+𝜔(𝑡)𝑖∗
𝑖 � 𝐴𝑆𝐹𝑅(𝑡+ℎ)𝑖𝑗− 𝐴𝑆𝐹𝑅(𝑡)𝑖𝑗] 𝑗 =
∑ ∑
[
𝜔(𝑡+ℎ)𝑖+𝜔(𝑡)𝑖 2 𝑖 ∗𝑗 (𝐴𝑆𝐹𝑅
(
𝑡+ℎ)
𝑖𝑗− 𝐴𝑆𝐹𝑅(
𝑡)
𝑖𝑗)] (3)Each j component of ΔSFC represents the change in fertility in one of five age groups (under 20, 20‒24, 25‒29, 30–34, and over 34, which means here 35–43 and is further denoted as “35 and more”). The final decomposition equation can be written as follows: 𝐶𝐹𝑅(𝑡+ℎ)− 𝐶𝐹𝑅(𝑡) =∑[𝐶𝐹𝑅(𝑡+ℎ)𝑖+𝐶𝐹𝑅(𝑡)𝑖 2 𝑖 ∗(𝜔(𝑡+ℎ)𝑖− 𝜔(𝑡)𝑖)] +∑ ∑ 𝜔(𝑡+ℎ)𝑖+𝜔(𝑡)𝑖 2 𝑖 ∗
𝑗 (𝐴𝑆𝐹𝑅(𝑡+ℎ)𝑖𝑗− 𝐴𝑆𝐹𝑅(𝑡)𝑖𝑗) (4)
cohorts. Additionally, I employ direct standardisation to show how the CFR would have changed if the educational structure had remained stable.
3. Results
3.1 Educational differences in completed fertility
Despite the extensive changes in female educational structure, the educational differences in completed fertility remained sharp throughout the analysed cohorts: on the whole, the better educated a woman was the fewer children she had (Figure 2).
The completed fertility of women born between 1930–34 and 1940–44 declined linearly from 2.51 to 2.22, and then it levelled off. Within the educational groups, however, it was on the increase for most of the cohorts. Comparing the oldest and the youngest cohorts, fertility went up among women with basic vocational education (from 2.29 to 2.45), and with secondary (from 1.91 to 2.04) and tertiary (from 1.53 to 1.67) education, whereas the fertility of the least educated remained almost at the same level (2.84 and 2.82, respectively). Their fertility seems to have been most distinctive: on average, they had 0.45 and 1.2 children more than women with basic vocational and tertiary education, respectively.
Figure 2: Completed fertility rate (CFR) at age 43, by cohort and education
Source: Author’s own calculations based on the Fertility Survey,2002
1.0 1.2 1.4 1.6 1.8 2.0 2.2 2.4 2.6 2.8 3.0
1930-34 1935-39 1940-44 1945-49 1950-54 1955-59
CF
R
cohort
3.2 Decomposition of the fertility changes
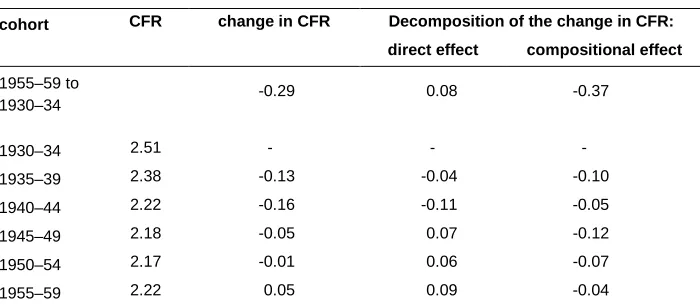
The decomposition results for the oldest and the youngest five-year cohorts suggest that the fertility decline of 0.29 children per woman can be explained by changes in educational structure and that fertility net of educational changes actually increased by almost 0.1 (see the upper panel of Table 1). It looks as if the compositional effect played a much more important role than the direct one. However, the decomposition of fertility changes in the subsequent five-year cohorts (Table 1) shows that this impression is misleading. The educational structure was changing in one direction (the least educated group was shrinking while all the others were growing), while fertility net of educational changes went down in the two older cohorts (1935–39 and 1940–44) and then increased in the three younger cohorts. Consequently, the CFR declined sharply between the 1930–34 and 1935–39 cohorts (-0.13) and between the 1935–39 and 1940–44 cohorts (-0.16). In the case of cohorts born after 1944, the negative structural effect was counterbalanced by the positive direct effect. This made the CFR decline more modest: in the last cohort the CFR actually increased by 0.05 compared to the previous cohort (1950–54).
Table 1: CFR and its change over five-year cohorts
cohort CFR change in CFR Decomposition of the change in CFR:
direct effect compositional effect
1955–59 to
1930–34 -0.29 0.08 -0.37
1930–34 2.51 - - -
1935–39 2.38 -0.13 -0.04 -0.10
1940–44 2.22 -0.16 -0.11 -0.05
1945–49 2.18 -0.05 0.07 -0.12
1950–54 2.17 -0.01 0.06 -0.07
1955–59 2.22 0.05 0.09 -0.04
Source: Author’s own calculations based on Fertility Survey 2002. Note: Computations based on equation (1ab).
structure of one-year cohorts). In the 1935–39 cohort the most substantial increases were found in the share of women with secondary and tertiary education, and in the 1945–49 cohort it was the group with secondary and basic vocational education that grew most.
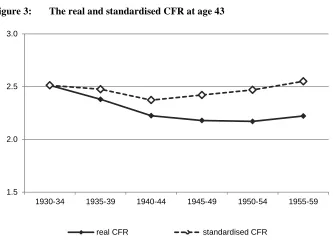
The graph below (Figure 3) clearly shows the role that changes in female educational structure played in the fertility decline. It compares the observed CFR with a directly standardised one, i.e., the CFR that would have been observed if the educational structure had not changed.
Figure 3: The real and standardised CFR at age 43
Source: Author’s own calculations based on Fertility Survey 2002.
Note: Computations based on direct standardisation of the CFR (the educational structure of the 1930-34 cohort is the standard one).
Not surprisingly, the gap between the real and the standardised CFR is getting wider with time. In the last five-year cohort it reaches 0.33 children per woman (2.22 vs. 2.55). Thus, had the educational structure remained constant, the completed fertility of the youngest five-year cohort would have not declined. On the contrary, it would have been 0.04 higher than that of the oldest one.
1.5 2.0 2.5 3.0
1930-34 1935-39 1940-44 1945-49 1950-54 1955-59
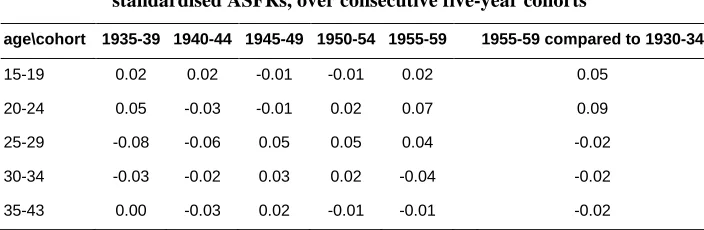
Further decomposition of the direct effect (i.e., computing the standardised fertility component: see equation (3)) suggests that the cohort changes in fertility (net of educational changes) at the most fertile ages were time-clustered (Figure 4).
Figure 4: The calendar time of decreases and increases in the standardised ASFRs over five-year cohorts
Note: Dark (red) and light (green) colours represent the decreases and increases, respectively. Only changes of (-)0.02 and above are coloured; the biggest changes, between (-)0.05 and (-)0.07, are shaded.
Most of the decreases took place in the 1960s, whereas the increases occurred in two waves: in the 1950s and between the 1970s and the mid-1980s. The former increases referred to fertility of teenagers and women between 20 and 24 years old; the latter ones included fertility of teenagers (cohort 1955–59), women in their 20s (cohorts 1945–49, 1950–54 and 1955–59) and 30s (cohort 1945–49).
4. Discussion and conclusions
those with tertiary education amounted to 1.16 (1.3 and 1.15 in the oldest and youngest cohorts, respectively).
In view of the egalitarian ideology of state socialism, the stable negative educational gradient in completed fertility might seem surprising. It cannot be interpreted from the opportunity costs perspective, as job alternatives for women were limited, regardless of their education (Fidelis 2010 chap.6; Titkow 1993; Zembrzuska 2000). Ideational changes associated with the second demographic transition cannot serve as an explanation either, since these could not have appeared within or co-existed with a socialist system. Below, I give possible explanations discussed in the literature. Their testing needs further research.
Despite the leading role of the working class, officially declared by the state and guaranteed by the 1952 Constitution (National Constituent Assembly 1952), the concept of traditional social hierarchy remained deeply embedded in Polish society throughout the communist period. In a non-meritocratic country, in which blue-collar workers often earned more than white-collar workers (Rutkowski 1996), education rather than the financial status was of central importance as a determining factor of social status. Thus highly educated people, the so-called ‘intelligentsia’, drew a clear distinction between their social class and the others by leading a ‘bourgeois’ lifestyle. They engaged in reading, went on holiday abroad if possible, sent their children to private piano lessons, or enabled them to take private English or French classes (Domański 2004; Giza-Poleszczuk 2007; Szacka 2008 chap.14). Contrary to the official ideology and policy, they embodied Becker’s theory of raising children of high quality (Becker 1991). Considering their low earnings this led to a quantity–quality trade-off.
The increase in completed fertility net of educational changes, observed between the oldest and the youngest cohort, was entirely due to the increasing fertility of women under 25 years old (see the last column in Table A3 in Appendix). This might be the result of a mortality selection effect, which to some extent certainly affected the oldest cohort. However, it might also be an indicator of changing fertility patterns: Holzer-Żelażewska and Tymicki (2009) have shown that fertility among women under 25 was much lower in the first post-war cohort (1946) than in the 1960 cohort. This finding shows that the fertility postponement in the post-educational phase that took place in capitalist Europe (Ní Bhrolcháin and Beaujouan 2012) was not observed in communist Poland (nor most probably in other European countries behind the Iron Curtain). This is in line with the explanation of early parenthood in the socialist countries given by van de Kaa (1994), that setting up a family there was a way of gaining independence. Centrally planned economies suffered from a persistent housing shortage, and being single or living as a childless couple reduced the chances of moving out of the parental home to almost zero.
Finally, the timing of the ASFR increases might be associated with the substantial changes in parental leave policy that were introduced in 1968, 1972, and 1981 (Frątczak et al. 2007; Kurzynowski 2000; Zembrzuska 2000; compare Spéder and Kamarás 2008 for Hungary).
In sum, the educational differences in completed fertility under state socialism in Poland were substantial and persistent: better educated women had on average fewer children than the less educated. The expansion of female education played an important role in fertility decline.
5. Acknowledgments
References
Becker, G.S. (1991). A Treatise on the Family. Revised and Enlarged Edition. Cambridge, Massachussetts: Harvard University Press.
Canudas Romo, V. (2003). Decomposition Methods in Demography. Groningen: Rijksuniversiteit Groningen.
Cho, L.J. and Retherford, R.D. (1973). Comparative analysis of recent fertility trends in East Asia. In: International Union for the Scientific Study of Population (eds.). Proceedings of the 17th General Conference of the IUSSP. Liège, Belgium: IUSSP: 163–181.
Cohen, J.E., Kravdal, Ø., and Keilman, N. (2011). Childbearing impeded education more than education impeded childbearing among Norwegian women. Proceedings of the National Academy of Sciences of the United States of America 108(29): 11830–11835. doi:10.1073/pnas.1107993108.
Council of Europe (2005). Recent demographic developments in Europe. Strasbourg: Council of Europe.
Domański, H. (2004). O ruchliwości społecznej w Polsce. Warsaw: IFiS PAN. Domański, H. (2007). Struktura społeczna. Warszawa: Wydaw. Naukowe Scholar. Fidelis, M. (2010). Women, Communism, and Industrialization in Postwar Poland.
New York: Cambridge University Press.
Frątczak, E., Kulik, M., Malinowski, M.; and Słotwińska-Rosłanowska, E. (2007). Regulacje prawne w odniesieniu do zjawisk i procesów demograficznych. Wybrane akty prawne regulujące świadczenia na rzecz dzieci i rodziny - polityka społeczna polska, wybrane lata 1945–2006. Warszawa: Komitet Nauk Demograficznych PAN.
Giza-Poleszczuk, A. (2007). Rodzina i system społeczny. In: Marody, M. (ed.). Wymiary życia społecznego. Warsaw: Wydawnictwo Naukowe scholar.
Holzer-Żelażewska, D. and Tymicki, K. (2009). Cohort and period fertility of Polish women, 1945–2008. Studia Demograficzne 155(1): 48–69.
Kotowska, I., Jóźwiak, J., Matysiak, A., and Baranowska, A. (2008). Poland: Fertility decline as a response to profound societal and labour market changes? Demographic Research 19(22): 795–854. doi:10.4054/DemRes.2008.19.22.
Kravdal, Ø. and Rindfuss, R.R. (2008). Changing Relationships between Education and Fertility: A Study of Women and Men Born 1940 to 1964. American Sociological Review 73(5): 854–873. doi:10.1177/000312240807300508.
Kurzynowski, A. (2000). Przemiany wzorów karier zawodowych kobiet w latach 1950– 1989. In: Żarnowska, A. and Szwarc, A. (eds.). Kobieta i praca. Warszawa: DiG: 189–216.
National Constituent Assembly (1952). Konstytucja Polskiej Rzeczypospolitej Ludowej uchwalona w dniu 22 lipca 1952 r. http://www.trybunal.gov.pl/wszechnica/ akty/konstytucja_prl.htm.
Neels, K. and De Wachter, D. (2010). Postponement and recuperation of Belgian fertility: how are they related to rising female educational attainment? Vienna Yearbook of Population Research 8: 77–106. doi:10.1553/populationyearbook 2010s77.
Ní Bhrolcháin, M. and Beaujouan, É. (2012). Fertility postponement is largely due to rising educational enrolment. Population Studies 66(3): 311–327. doi:10.1080/ 00324728.2012.697569.
Okólski, M. (2006). Płodność i rodzina w okresie tranformacji. In: Wasilewski, J. (ed.). Współczesne społeczeństwo polskie – dynamika zmian. Warszawa: Wydawn. Nauk Scholar
Okólski, M. (2007). Przemiany ludnościowe we współczesnej Polsce z perspektywy minionego stulecia. In: Marody, M. (ed.). Wymiary życia społecznego. Polska na przełomie XX i XXI w. Warszawa: Wydawn. Nauk Scholar: 27–66.
Potančoková, M., Vano, B., Pilinská, V., and Jurcová, D. (2008). Slovakia: Fertility between tradition and modernity. Demographic Research 19(25): 973–1018. doi:10.4054/DemRes.2008.19.25.
Prskawetz, A., Sobotka, T., Buber, I., Engelhardt, H., and Gisser, R. (2008). Austria: Persistent low fertility since the mid-1980s. Demographic Research 19(12): 293–360. doi:10.4054/DemRes.2008.19.12.
Sobotka, T., Št’astná, A., Zeman, K., Hamplová, D. and Kantorová, V. (2008). Czech Republic: A rapid transformation of fertility and family behaviour after the collapse of state socialism. Demographic Research 19(14): 403–454. doi:10.4054/DemRes.2008.19.14.
Spéder, Z. and Kamarás, F. (2008). Hungary: Secular fertility decline with distinct period fluctuations. Demographic Research 19(18): 599–664. doi:10.4054/ DemRes.2008.19.18.
Szacka, B. (2008). Wprowadzenie do socjologii. Warsaw: Oficyna Naukowa.
Titkow, A. (1993). Political Change in Poland: Cause, Modifier, or Barrier to Gender Equality? In: Funk, N. and Mueller, M. (eds.). Gender politics and post-communism: reflections from eastern Europe and the former Soviet Union. London: Routledge.
Van de Kaa, D.J. (1994). The second demographic transition revisited: Theories and expectations. In: Beets, G. (ed.). Population and family in the Low Countries 1993: Late fertility and other current issues. NIDI/CBGS Publication: 81–126.
Zakharov, S. (2008). Russian Federation: From the first to second demographic transition. Demographic Research 19(24): 907–972. doi:10.4054/DemRes. 2008.19.24.
Appendix
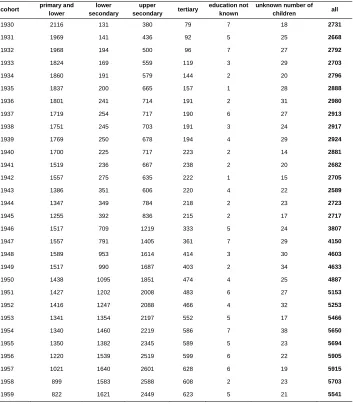
Table A1: The selected cohorts by education, unweighted sample
cohort primary and lower
lower secondary
upper
secondary tertiary
education not known
unknown number of children all
1930 2116 131 380 79 7 18 2731
1931 1969 141 436 92 5 25 2668
1932 1968 194 500 96 7 27 2792
1933 1824 169 559 119 3 29 2703
1934 1860 191 579 144 2 20 2796
1935 1837 200 665 157 1 28 2888
1936 1801 241 714 191 2 31 2980
1937 1719 254 717 190 6 27 2913
1938 1751 245 703 191 3 24 2917
1939 1769 250 678 194 4 29 2924
1940 1700 225 717 223 2 14 2881
1941 1519 236 667 238 2 20 2682
1942 1557 275 635 222 1 15 2705
1943 1386 351 606 220 4 22 2589
1944 1347 349 784 218 2 23 2723
1945 1255 392 836 215 2 17 2717
1946 1517 709 1219 333 5 24 3807
1947 1557 791 1405 361 7 29 4150
1948 1589 953 1614 414 3 30 4603
1949 1517 990 1687 403 2 34 4633
1950 1438 1095 1851 474 4 25 4887
1951 1427 1202 2008 483 6 27 5153
1952 1416 1247 2088 466 4 32 5253
1953 1341 1354 2197 552 5 17 5466
1954 1340 1460 2219 586 7 38 5650
1955 1350 1382 2345 589 5 23 5694
1956 1220 1539 2519 599 6 22 5905
1957 1021 1640 2601 628 6 19 5915
1958 899 1583 2588 608 2 23 5703
Figure A1: Cumulative distribution by cohort and education at the time of the interview (in per cent)
0% 10% 20% 30% 40% 50% 60% 70% 80% 90% 100%
primary and lower basic vocational vocational secondary
Table A2: Completed fertility calculated from (1) the Fertility Survey 2002 (1a) measured at age 43, (1b) with no age limits, and given by the (2) Council of Europe
cohort (1a) CFR at 43 (1b) CFR completed
(no age restrictions) (2) CFR Council of Europe
1930 2.55 2.56 2.78
1931 2.52 2.53
1932 2.55 2.56
1933 2.41 2.42
1934 2.53 2.55
1935 2.48 2.49 2.60
1936 2.44 2.45
1937 2.33 2.34
1938 2.34 2.35
1939 2.29 2.30
1940 2.28 2.29 2.41
1941 2.21 2.21
1942 2.23 2.24
1943 2.26 2.26
1944 2.14 2.15
1945 2.26 2.26 2.27
1946 2.14 2.15
1947 2.16 2.17
1948 2.19 2.19
1949 2.17 2.17
1950 2.14 2.15 2.19
1951 2.17 2.17
1952 2.15 2.16
1953 2.19 2.20
1954 2.19 2.20
1955 2.23 2.23 2.17
1956 2.23 2.23
1957 2.18 2.19
1958 2.21 2.21 2.21
1959 2.25 2.25 2.20
Note: 1ab were calculated using the whole sample (including cases with missing education).
Table A3: The decomposed change in the standardised CFR into changes in the standardised ASFRs, over consecutive five-year cohorts
age\cohort 1935-39 1940-44 1945-49 1950-54 1955-59 1955-59 compared to 1930-34
15-19 0.02 0.02 -0.01 -0.01 0.02 0.05
20-24 0.05 -0.03 -0.01 0.02 0.07 0.09
25-29 -0.08 -0.06 0.05 0.05 0.04 -0.02
30-34 -0.03 -0.02 0.03 0.02 -0.04 -0.02