Open Access
Research
Risk of high blood pressure in salt workers working near salt milling
plants: A cross-sectional and interventional study
Kripa Ram Haldiya*
1, Murli Lal Mathur
2, Raman Sachdev
3and
Habibulla N Saiyed
4Address: 1Deputy Director Senior Grade, Desert Medicine Research Centre (ICMR), Jodhpur, 342005, India, 2Deputy Director, Desert Medicine
Research Centre (ICMR), Jodhpur, 342005, India, 3Deputy Director, Desert Medicine Research Centre (ICMR), Jodhpur, 342005, India and 4Director, National Institute of Occupational Health (ICMR), Meghani Nagar, Ahmedabad, 380816, India
Email: Kripa Ram Haldiya* - [email protected]; Murli Lal Mathur - [email protected]; Raman Sachdev - [email protected]; Habibulla N Saiyed - [email protected]
* Corresponding author
Abstract
Background: Workers working close to salt milling plants may inhale salt particles floating in the air, leading to a rise in plasma sodium, which, in turn, may increase the blood pressure and the risk of hypertension.
Methods: To test the above hypothesis, occupational health check-up camps were organized near salt manufacturing units and all workers were invited for a free health examination. The workers who worked with dry salt in the vicinity of salt milling plants were defined as "non-brine workers," while those working in brine pans located far away from milling plants were defined as "brine workers." Blood pressure (BP) was measured during each clinical examination. In all, 474 non-brine workers and 284 brine workers were studied.
Results: Mean systolic blood pressure of non-brine workers (122.1 ± 13.3 mm Hg) was significantly higher than that of brine workers (118.8 ± 12.8 mm Hg, p < 0.01). Mean diastolic blood pressure of non-brine workers (71.5 ± 10.4 mm Hg) was significantly higher than that of brine workers (69.7 ± 9.4 mm Hg, p = 0.02). The prevalence of hypertension was significantly higher in non-brine workers (12.2%) than in brine workers (7.0%, p = 0.02). Nineteen salt workers were monitored while they used face masks and spectacles, for six days. Systolic, as well as diastolic, blood pressure of these workers began declining on the third day and continued to decline on the fourth day, but remained stationary up to the sixth day. The concentration of salt particles in the breathing zone of these workers was 376 mg/m3 air.
Conclusion: Inhalation of salt particles in non-brine workers may be an occupational cause of increased blood pressure.
Introduction
There is an abundance of scientific evidence
demonstrat-ing a direct relation between salt intake and blood pres-sure (BP) [1]. Many animal studies [2], large population-Published: 25 July 2005
Environmental Health: A Global Access Science Source 2005, 4:13 doi:10.1186/ 1476-069X-4-13
Received: 24 May 2005 Accepted: 25 July 2005
This article is available from: http://www.ehjournal.net/content/4/1/13
© 2005 Haldiya et al; licensee BioMed Central Ltd.
based studies [1,3-6], epidemiological studies [7-9], meta-analyses of clinical trials [10-12], and randomized con-trolled trials [13,14] have shown that BP is directly related to salt intake. People's occupations also have varying impact on their BP [15-19]. Salt workers involved in the process of manufacturing, milling, and packing of salt are exposed to salt via their environment. Since most salt milling plants in India are not fully enclosed, salt particles float in the air in the vicinity of the workers. These workers may therefore inhale considerable amounts of salt during working hours. These salt particles may be inhaled and therefore absorbed in the airway surface epithelium [20-24] or the lungs [25]. These same fine particles are also able to translocate from the lungs into the circulatory sys-tem [26]. Inhaled salt particles may be carried via a con-tinuous upward mucocilliary current on the airway surface to throat, where they can be swallowed. This is likely to increase the plasma sodium level, which in turn may increase the BP [27] and the risk of hypertension in the exposed workers. However, this problem may be com-pletely preventable. This hypothesis was tested through a cross-sectional and experimental study involving salt workers; the results are presented and discussed below.
Methods
A cross-sectional study was conducted among salt workers of the Sambhar, Nawa, and Rajas salt-manufacturing sites of Rajasthan, which are at about 150 km. from Jaipur, the capital of Rajasthan. Occupational health check-up camps were held at these three sites, under the Project on Preven-tion and Control of OccupaPreven-tional Health Hazards Among the Salt Workers, sponsored by the Ministry of Health, Government of India. This project was approved by the Scientific Advisory Committee of the National Institute of Occupational Health, Ahmedabad, India. The procedures followed were in accordance with the Helsinki Declara-tion. The camps were organized at Sambhar, Nawa, and Phalodi, in collaboration with owners of salt manufactur-ing units and the Department of Salt, Government of India. Each camp lasted 5 days. All the workers from nearby salt manufacturing units were invited for a free health examination. Workers who were absent on the dates of the health camp were not included in the study.
The aim of the study was explained to the subjects. Their age (in years), sex, detailed occupational history (includ-ing exact nature of job and duration of work(includ-ing in salt industry) were recorded on schedules especially designed for occupational health examinations.
After obtaining the informed consent, the clinical exami-nation was carried out by one of the authors, who did not measure the blood pressure. After the subject had rested for five minutes in a supine position, the blood pressure was measured in the right arm using digital blood
pres-sure equipment (Omron T-4). The cuff size was 25 cm × 13 cm. Three readings were taken by the trained field investigators, under supervision of another author. The first two readings were to familiarize the subjects with the process and the third reading was recorded for analysis. Prior to the camps, the field investigators were trained by the authors for fifteen days in measuring blood pressure. Body weight and height were measured by another trained field investigator. Height was measured in centim-eters, using an anthropometric rod, while the subject stood erect on a flat platform.
Eight-hundred-and-ninety-one salt workers attended the camps, and three blood pressure measurements were taken in 875 workers. The workers who were involved in crushing, grinding, milling, packing, and loading salt, and who did not work with brine, were defined as non-brine workers. These workers worked in the vicinity of salt mill-ing plants. Workers who worked with brine pans for the purpose of crystal reshuffling and raw salt heaping were defined as brine workers; their site of work was far away from the salt milling plants. The workers who worked as non-brine workers for some time and also worked as brine workers on some other days were excluded from analysis. Workers who were involved in only administra-tive and other related activities were also excluded from the analysis.
Hypertension was defined as systolic blood pressure more than 139 mmHg and/or diastolic blood pressure 90 mmHg or above. Body mass index was calculated as [Weight in Kg/(Height in meters)2]. Systolic and diastolic
blood pressure was compared in the brine workers and non-brine workers. Student's t-test and Chi square test were used to determine the statistical significance of the differences.
measured in the supine position, before starting work in the morning. Only nineteen of them regularly attended the worksite and used the face mask and eyeglasses for all six consecutive days, while others were present on some days, but absent on others. Workers were requested to provide urine samples before starting the intervention study and after completing the intervention for more than 3 days. These samples were collected twice a day – once in the morning before starting work and then in the evening, after completion of working hours. Only eight subjects out of 33 workers provided both (morning and evening) urine samples before intervention and only six workers (not the same) provided both urine samples after inter-vention. These samples were then analyzed for sodium and potassium levels using an AVL electrode electrolyte analyzer (AVL Medical Instruments, Schaffhausen, Swit-zerland). Additionally, the concentration of salt particles in the air in the environment of the work site was meas-ured by using a respirable dust sampler (Environtech). The dust sampler was placed at two sites namely Sambhar Salts and at Nawa for six days. The particles of 10 µm or more were collected at the bottom of the cyclone of the sampler and those smaller than 10 µm were deposited on the filter paper of the sampler. Volume of total air entering the sampler and weight of particles collected were used to calculate the average concentration of both types of dust in the environment.
Results
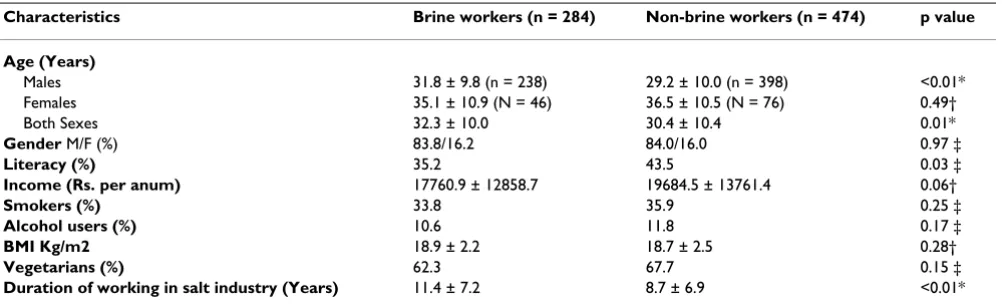
Out of 758 salt workers studied, 474 (62.5%) workers were non-brine workers, while 284 (37.5%) were brine workers. The characteristics of the study subjects are depicted in Table 1. These were comparable in brine and non-brine workers. Mean age of male brine workers was 31.8 ± 9.8 years, while male non-brine workers were
com-paratively a little younger (mean age 29.2 ± 10.0 years.). The mean age of female brine workers (35.1 ± 10.9 years) was not significantly different from that of female non-brine workers (36.5 ± 10.5 years). All workers were 15 years of age or older. The two groups did not show any sig-nificant difference in the prevalence of smoking, alcohol use, literacy, income, diet habits, and BMI. However, mean duration of working in the salt industry was lower in non-brine workers than brine workers.
Mean systolic blood pressure of non-brine workers (122.1 ± 13.3 mmHg) was significantly higher than that of brine workers (118.8 ± 12.8 mm Hg)(p < 0.01). Z-test, as well as the Student's t-test (two-tailed), showed a highly signif-icant difference in both sexes, separately (Table 2). Mean diastolic blood pressure of non-brine workers (71.5 ± 10.4 mm Hg) was significantly higher than that of brine workers (69.7 ± 9.4 mm Hg) (p = 0.01). This was also con-sistently higher in both sexes.
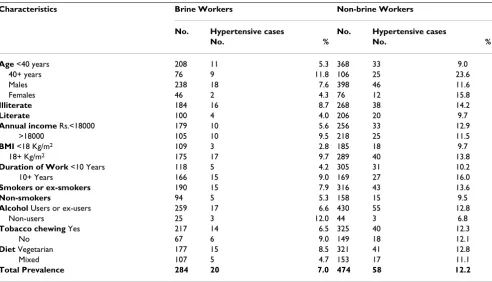
Overall, the prevalence of hypertension in salt workers was 10.3%. It was significantly higher in non-brine work-ers (12.2%) than in brine workwork-ers (7.0%) (p = 0.02). The prevalence of hypertension was also consistently higher in non-brine workers than brine workers in different groups, according to age, sex, literacy, income, and body-mass index, duration of working in salt industry, smoking, alco-hol use, tobacco chewing, and diet (Table 3).
Results of experimental intervention
Table 4 shows the mean number of working hours, mean number of hours for which masks and glasses were used, and the mean morning blood pressure of nineteen work-ers who attended the worksite and used face mask and eyeglasses for all six days of intervention. Morning blood
Table 1: Characteristics of study subjects.
Characteristics Brine workers (n = 284) Non-brine workers (n = 474) p value
Age (Years)
Males 31.8 ± 9.8 (n = 238) 29.2 ± 10.0 (n = 398) <0.01*
Females 35.1 ± 10.9 (N = 46) 36.5 ± 10.5 (N = 76) 0.49†
Both Sexes 32.3 ± 10.0 30.4 ± 10.4 0.01*
Gender M/F (%) 83.8/16.2 84.0/16.0 0.97 ‡
Literacy (%) 35.2 43.5 0.03 ‡
Income (Rs. per anum) 17760.9 ± 12858.7 19684.5 ± 13761.4 0.06†
Smokers (%) 33.8 35.9 0.25 ‡
Alcohol users (%) 10.6 11.8 0.17 ‡
BMI Kg/m2 18.9 ± 2.2 18.7 ± 2.5 0.28†
Vegetarians (%) 62.3 67.7 0.15 ‡
Duration of working in salt industry (Years) 11.4 ± 7.2 8.7 ± 6.9 <0.01*
Table 2: Mean systolic and diastolic blood pressure of brine workers and non-brine workers.
Brine workers Non-brine workers p value
Average systolic BP
Males 119.9 ± 11.7 (n = 238) 122.8 ± 12.4 (n = 398) <0.01*
Females 113.2 ± 16.6 (n = 46) 118.3 ± 16.5 (n = 76) 0.01
Both sexes 18.8 ± 12.8 (n = 284) 122.1 ± 13.3 (n = 474) <0.01*
Average diastolic BP
Males 69.4 ± 9.6 (n = 238) 72.8 ± 10.2 (n = 398) 0.09
Females 71.1 ± 7.8 (n = 46) 75.2 ± 10.3 (n = 76) 0.02*
Both sexes 69.7 ± 9.4 (n = 284) 71.5 ± 10.4 (n = 474) 0.01*
*Difference significant; Z-test and Student's t-test (two-tailed)
Table 3: Prevalence of hypertension in brine workers and non-brine workers according to various characteristics.
Characteristics Brine Workers Non-brine Workers
No. Hypertensive cases No. Hypertensive cases
No. % No. %
Age <40 years 208 11 5.3 368 33 9.0
40+ years 76 9 11.8 106 25 23.6
Males 238 18 7.6 398 46 11.6
Females 46 2 4.3 76 12 15.8
Illiterate 184 16 8.7 268 38 14.2
Literate 100 4 4.0 206 20 9.7
Annual income Rs.<18000 179 10 5.6 256 33 12.9
>18000 105 10 9.5 218 25 11.5
BMI <18 Kg/m2 109 3 2.8 185 18 9.7
18+ Kg/m2 175 17 9.7 289 40 13.8
Duration of Work <10 Years 118 5 4.2 305 31 10.2
10+ Years 166 15 9.0 169 27 16.0
Smokers or ex-smokers 190 15 7.9 316 43 13.6
Non-smokers 94 5 5.3 158 15 9.5
Alcohol Users or ex-users 259 17 6.6 430 55 12.8
Non-users 25 3 12.0 44 3 6.8
Tobacco chewing Yes 217 14 6.5 325 40 12.3
No 67 6 9.0 149 18 12.1
Diet Vegetarian 177 15 8.5 321 41 12.8
Mixed 107 5 4.7 153 17 11.1
Total Prevalence 284 20 7.0 474 58 12.2
Table 4: Mean working hours, period of use of protective devices and morning blood pressure of workers on the days of intervention (n = 19).
Day of intervention Mean no. of hours Worked
Mean no. of hours masks used
Mean no. of hours glasses used
Mean Systolic Blood Pressure (mm Hg)
Mean Diastolic Blood Pressure (mm Hg)
Day 1 6.2 ± 0.5 3.9 ± 1.0 4.8 ± 0.8 127.8 ± 11.1 80.7 ± 8.8
Day 2 10.0 ± 1.4 5.5 ± 1.5 6.5 ± 1.6 127.8 ± 11.8 80.6 ± 12.8
Day 3 9.7 ± 1.8 4.6 ± 1.3 5.2 ± 1.9 123.4 ± 10.3 76.4 ± 8.6
Day 4 7.9 ± 0.5 4.4 ± 1.9 4.8 ± 1.3 117.5 ± 9.9 62.6 ± 7.8
Day 5 9.3 ± 0.9 4.2 ± 1.1 4.5 ± 0.9 113.8 ± 7.0 63.8 ± 8.0
Day 6 9.1 ± 1.3 4.8 ± 1.4 5.2 ± 1.5 114.6 ± 6.5 63.0 ± 5.5
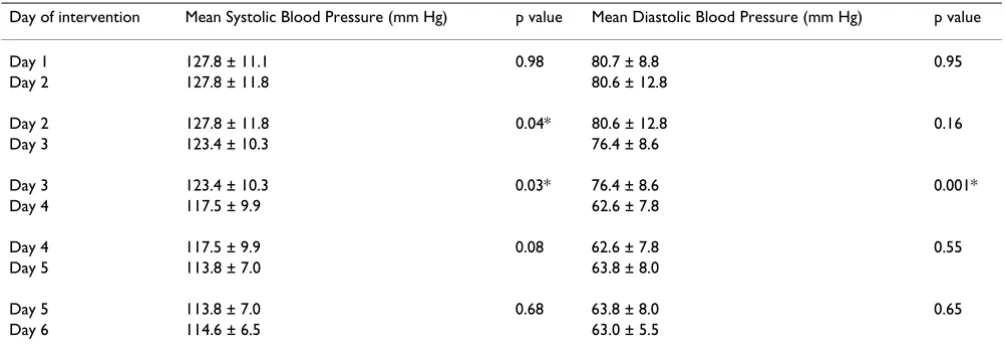
pressure was taken before starting their shift. The systolic, as well as diastolic, blood pressure of these workers began declining on the third day and continued to decline on forth day, but remained stationary, each day thereafter (Figure 1). Table 5 shows that the difference in blood pres-sure between day 1 and day 2 was not significant (for systolic BP p = 0.98 and for diastolic BP p = 0.95), but that between day 2 and day 3 (for systolic BP p = 0.03 and for diastolic BP p = 0.16), as well as between day 3 and day 4, was significant (for systolic BP p = 0.03 and for diastolic BP p < 0.01); again, the decline thereafter was not signifi-cant (for systolic BP p = 0.08 & 0.68 and for diastolic BP p = 0.55 & 0.65). Mean urinary sodium in morning samples before the intervention was 265.7 ± 250.8 mmol/L and decreased to 184.6 ± 46.3 mmol/L three days after the intervention. This decline was not statistically significant (p = 0.27). Mean urinary sodium in evening samples before the intervention was 310.8 ± 304.2 mmol/L, as compared to 180.5 ± 41.2 mmol/L three days after the intervention. This decline was also not statistically signif-icant (p = 0.31). Mean concentration of salt particles of a size less than 10 µm (PM 10) was 15 mg/m3 and that of
larger particles was 361 mg/m3 air in the breathing zone
of these workers, during these six days.
Discussion
In the present study, systolic, as well as diastolic, BP and prevalence of hypertension were found to be higher in non-brine salt workers, who were occupationally exposed to sodium chloride particles in the air of the breathing zone. This is a new observation, though it is in line with
the hypothesis that, after being inhaled, salt may be absorbed from respiratory tract [20-24] or the mucocil-liary current may transport it to pharynx, where it is swal-lowed and can then be absorbed from the gastrointestinal tract. Consequent increases in plasma sodium may be responsible for increases in the BP [27]. Differences in uri-nary sodium, an indicator of sodium intake, and plasma sodium are associated with BP differences of clinical and public health relevance [29]. The exact mechanisms whereby raised plasma sodium increases the BP are not clear. Existing concepts focus on the tendency for an increase in extracellular fluid volume (ECV), but raised plasma sodium increases a transfer of fluid from the intra-cellular to the extraintra-cellular space, and stimulates the thirst center. Accordingly, the rise in plasma sodium is respon-sible for the tendency for an increase in ECV. Although the change in ECV may have a pressure effect, the associated rise in plasma sodium itself may also cause the BP to rise [27]. Systolic and diastolic BP and the prevalence of hypertension of the non-brine (exposed) workers were compared with the brine salt workers, who were not exposed to salt particles in air. BP is affected by multiple factors, including age, nature of job, socioeconomic sta-tus, living standard, nutritional stasta-tus, smoking habits, and alcohol consumption. Both groups of studied work-ers did not differ on these parametwork-ers (Table 1). However, mean age and mean duration of working in the salt indus-try (exposure) were lower in non-brine workers, com-pared to brine workers, but these can be causes of lower BP, rather than of higher BP. The prevalence of hypertension was consistently higher in different sub-groups of non-brine workers (Table 3), and this consist-ency further strengthens the above observation. It can, therefore, safely be concluded that BP and prevalence of hypertension of non-brine workers were higher than brine workers.
To further confirm the hypothesis about probable mecha-nism involved, an experimental intervention was carried out. The decline in BP while using face masks and specta-cles during work again strengthens this hypothesis. The urinary sodium levels also declined after use of masks and glasses for three days, though the decline was not statisti-cally significant (probably because of smaller sample size).
A limitation of the study is that serum sodium levels of the workers involved in the intervention study could not be measured. The total concentration of salt particles in the air was 376 mg/m3. Considering the average tidal volume
of 800–1000 ml/breath and respiratory rate of 18–25/min while working, the average worker could inhale 2.60 to 4.51 gm sodium chloride over the course of an eight hour shift. Average use of the mask was 52.9% of working hours, which could have prevented inhalation of about
Blood Pressure of non-brine workers declined by use of masks and glasses
Figure 1
1.37 to 2.39 gm of salt per day. The exact mechanism by which the decline of 1.37 to 2.39 g of salt intake per day could significantly reduce the BP is not clear. Thus, the results of this intervention study do not fully support the hypothesis that the cause of higher BP and higher preva-lence of hypertension in non-brine workers is inhalation of salt particles from the environment. Eye glasses were provided to protect their eyes from salt particles and the study design did not allow us to find out whether these contributed to lowering of BP, though the salt particle sticking on to conjunctiva may also pass along with tears through the naso-lacrimal duct to respiratory tract and further on to the gastrointestinal tract. The psychological effect of using some of the intervention devices expected to reduce BP can also not be ruled out in this study. Fur-ther studies on salt workers are needed to elucidate our findings.
List of Abbreviations
BP : Blood Pressure
ECV : Extra Cellular fluid Volume
Competing interests
The author(s) declare that they have no competing interests.
Authors' contributions
KRH contributed in conception and design, acquisition of data, analysis and interpretation of data and drafting the paper; MLM contributed in acquisition of data, statistical analysis and interpretation of data and drafting the paper; RS contributed in acquisition of data and drafting the paper; and HNS contributed in conception and design and critical evaluation of the data and drafting of the
paper. All authors read and approved the final manuscript.
Acknowledgements
Ministry of Health and Family Welfare, Govt. of India had financed the project entitled Prevention and Control of Occupational Health Hazards among the Salt Workers working in Desert areas of Gujarat and Western Rajasthan. Authors are grateful to the Ministry as all data presented in this paper were collected under this project. Authors are also grateful to staff of Salt Department, Government of India who helped in this study. We are thankful to the staff of Hindustan Salts Ltd. in Jaipur, India for their help with this work.
References
1. Stamler J: The INTERSALT Study: background, methods,
findings. Am J Clin Nutr 1997, 65(Suppl 2):626S-642S.
2. Denton D, Weisinger R, Mundy NI, Wickings EJ, Dixson A, Moisson P, et al.: The effect of increased salt intake on blood pressure of chimpanzees. Nat Med 1995, 1:1009-1016.
3. Law MR, Frost CD, Wald NJ: By how much does dietary salt reduction lower blood pressure? I. Analysis of observational data among populations. BMJ 1991, 302:811-815.
4. Elliott P: Observational studies of salt and blood pressure.
Hypertension 1991, 17:13-18.
5. William MV, Frank MS, Jamy A, Lawrence JA, George AB, Denise G,
et al.: Effects of Diet and Sodium Intake on Blood Pressure: Subgroup Analysis of the DASH-Sodium Trial. Ann Intern Med
2001, 135:1019-1028.
6. Obarzanek E, Proschan MA, Vollmer WM, Moore TJ, Sacks FM, Appel LJ, et al.: Individual blood pressure responses to changes in salt intake: results from the DASH-Sodium trial. Hypertension
2003, 42:459-67.
7. He J, Tell GS, Tang YC, Mo PS, He GQ: Relation of electrolytes to blood pressure in men. Hypertension 1991, 17:378-385. 8. Frost CD, Law MR, Wald NJ: By how much does dietary salt
reduction lower blood pressure? II. Analysis of observational data within populations. BMJ 1991, 302:815-819.
9. Intersalt Cooperative Research Group: INTERSALT: an interna-tional study of electrolyte excretion and blood pressure: results for 24 hour urinary sodium and potassium excretion.
BMJ 1988, 297:319-328.
10. Cutler JA, Follmann D, Allender PS: Randomized trials of sodium reduction: an overview. Am J Clin Nutr 1997, 65(Suppl 2):643S-651S.
Table 5: Comparison of mean systolic and diastolic blood pressures of the workers on consecutive days of intervention.
Day of intervention Mean Systolic Blood Pressure (mm Hg) p value Mean Diastolic Blood Pressure (mm Hg) p value
Day 1 127.8 ± 11.1 0.98 80.7 ± 8.8 0.95
Day 2 127.8 ± 11.8 80.6 ± 12.8
Day 2 127.8 ± 11.8 0.04* 80.6 ± 12.8 0.16
Day 3 123.4 ± 10.3 76.4 ± 8.6
Day 3 123.4 ± 10.3 0.03* 76.4 ± 8.6 0.001*
Day 4 117.5 ± 9.9 62.6 ± 7.8
Day 4 117.5 ± 9.9 0.08 62.6 ± 7.8 0.55
Day 5 113.8 ± 7.0 63.8 ± 8.0
Day 5 113.8 ± 7.0 0.68 63.8 ± 8.0 0.65
Day 6 114.6 ± 6.5 63.0 ± 5.5
Publish with BioMed Central and every scientist can read your work free of charge "BioMed Central will be the most significant development for disseminating the results of biomedical researc h in our lifetime."
Sir Paul Nurse, Cancer Research UK
Your research papers will be:
available free of charge to the entire biomedical community
peer reviewed and published immediately upon acceptance
cited in PubMed and archived on PubMed Central
yours — you keep the copyright
Submit your manuscript here:
http://www.biomedcentral.com/info/publishing_adv.asp
BioMedcentral
11. Midgley JP, Matthew AG, Greenwood CM, Logan AG: Effect of reduced dietary sodium on blood pressure: a meta-analysis of randomized controlled trials. JAMA 1996, 275:1590-1597. 12. Graudal NA, Galloe AM, Garred P: Effects of sodium restriction
on blood pressure, renin, aldosterone, catecholamines, cho-lesterols, and triglyceride: a meta-analysis. JAMA 1998,
279:1383-1389.
13. MacGregor GA, Sagnella GA, Markandu ND, Singer DRJ, Cappuccio FP: Double-blind study of three sodium intakes and long-term effects of sodium restriction in essential hypertension.
Lancet 1989, 2:1244-1247.
14. The Trials of Hypertension Prevention Collaborative Research Group: Effects of weight loss and sodium reduction interven-tion on blood pressure and hypertension incidence in over-weight people with highnormal blood pressure: the Trials of Hypertension Prevention, Phase II. Arch Intern Med 1997,
157:657-667.
15. Chiplonkar SA, Agte VV, Tarwadi KV, Paknikar KM, Diwate UP:
Micronutrient deficiencies as predisposing factors for hyper-tension in lacto-vegetarian Indian adults. J Am Coll Nutr 2004,
23:239-247.
16. Anand MP: Prevalence of hypertension amongst Mumbai
executives. J Assoc Physicians India 2000, 48:1200-1201.
17. Waskiewicz J, Zaborski L: State of circulatory system in equip-ment operators working in harbour. Bull Inst Marit Trop Med Gdynia 1998, 49:87-96.
18. Tiwai RR, Pathak MC, Zodpey SP, Babar VY: Hypertension among cotton textile workers. Indian J Public Health 2003, 47:34-36. 19. Hazarika NC, Biswas D, Narain K, Kalita HC, Mahanta J:
Hyperten-sion and its risk factors in tea garden workers of Assam. Natl Med J India 2002, 15:63-68.
20. Knowles M, Murray G, Shallal J, Askin F, Ranga V, Gatzy J, et al.: Bio-electric properties and ion flow across excised human bronchi. J Appl Physiol 1984, 56:868-877.
21. Kilburn KH: A hypothesis for pulmonary clearance and its implications. Am Rev Respir Dis 1968, 98:449-463.
22. Boucher RC: Human airway ion transport (Part 1). Am J Respir Crit Care Med 1994, 150:271-281.
23. Boucher RC: Human airway ion transport (Part 2). Am J Respir Crit Care Med 1994, 150:581-593.
24. Knowles MR, Boucher RC: Mucus clearance as a primary innate defense mechanism for mammalian airways. J Clin Invest 2002,
109:571-577.
25. Aswania O, Chrystyn H: Relative lung and systemic bioavailabil-ity of sodium cromoglycate inhaled products using urinary drug excretion post inhalation. Biopharm Drug Dispos 2002,
23:159-163.
26. Nemmar A, Hoylaerts MF, Hoet PH, Nemery B: Possible mecha-nisms of the cardiovascular effects of inhaled particles: sys-temic translocation and prothrombotic effects. Toxicol Lett
2004, 149:243-253.
27. de Wardener HE, He FJ, MacGregor GA: Plasma sodium and hypertension. Kidney Int 2004, 66:2454-2266.
28. Desert Medicine Research Centre: Annual Report. Jodhpur, India; 1996.
29. Khaw KT, Bingham S, Welch A, Luben R, O'Brien E, Wareham N, et al.: Blood pressure and urinary sodium in men and women: the Norfolk Cohort of the European Prospective Investiga-tion into Cancer (EPIC-Norfolk). Am J Clin Nutr 2004,