Volume 2, Issue 7, 2015
1
Available online at www.ijiere.com
International Journal of Innovative and Emerging
Research in Engineering
e-ISSN: 2394 – 3343 p-ISSN: 2394 – 5494
Properties and Application of Artificial Sand
with Steel Fiber
Jitendra Tiple
a, Anant N. Dabhade
ba. Post Graduate Student, Department of Civil Engineering, Kavikulguru Instiute of Technology, Ramtek, India. b. Assistant Professor, Department of Civil Engineering, Kavikulguru Institute of Technology, Ramtek, India.
Email:[email protected] and [email protected]
ABSTRACT
India, this comes into category of developing country taken an initiative on developing infrastructure to meet the requirements of globalization in the construction of structures. And the concrete is the main material to fulfill this demand which made up of ingredient such as cement, sand, coarse aggregate and water. Due to heavy demand of river sand which is used as fine aggregate for making concrete becomes scarier and poses environmental problem. Artificial sand used as alternative to natural sand (river sand) which was used zone wise i.e. zone I, zone II, zone III and zone IV given in IS: 383-1970 for natural sand. After finding properties of artificial sand, mix design made for M20 grade for carrying compressive strength test for each of artificial sand. The zone which gives maximum strength was used further with steel fiber at dosage rate of 0, 0.5, 1, 1.5 and 2 percent. The specimens were casted and tested again for compressive strength at age of 7 and 28 days. The use f artificial sand would be the best alternative for natural sand.
KEYWORDS: Artificial sand, Zones, Steel fiber, Compressive strength
I. INTRODUCTION
Due to large use of natural sand (river sand) as fine aggregate in the making of concrete, it’s getting depleted and its sources too. As compared to natural sand, artificial sand is easy to get because it is available locally at hot mix plant. M20 grade of concrete was designed by full replacement of natural sand to artificial sand for all four zones (i.e. I, II, III and IV). After getting maximum strength given by any one zone out of four further casting of concrete cubes with steel fiber at 0%, 0.5%, 1.0%, 1.5% and 2.0% for determining compressive strength. Application of artificial sand with steel fiber is presented in the paper.
II. OBJECTIVES OF THE PRESENT STUDY
i)
To provide alternative to natural sand by replace it 100% using artificial sand in conventional concrete.ii)
To study the optimization of particle size distribution of artificial sand.iii)
To study optimization of the percentage of steel Fibers.III. MATERIAL USED
17
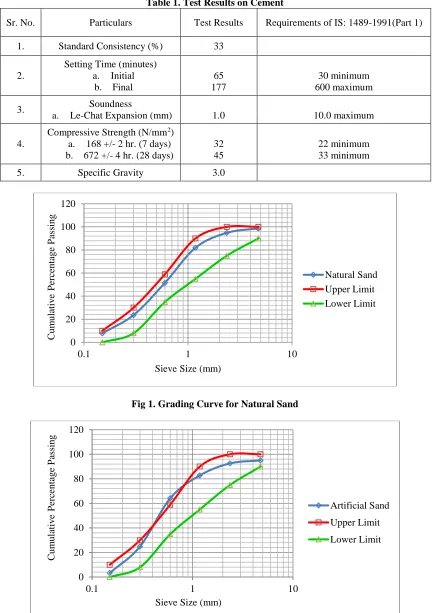
Table 1. Test Results on Cement
Sr. No. Particulars Test Results Requirements of IS: 1489-1991(Part 1)
1. Standard Consistency (%) 33
2.
Setting Time (minutes) a. Initial
b. Final
65 177
30 minimum 600 maximum
3. Soundness
a. Le-Chat Expansion (mm) 1.0 10.0 maximum
4.
Compressive Strength (N/mm2)
a. 168 +/- 2 hr. (7 days) b. 672 +/- 4 hr. (28 days)
32 45
22 minimum 33 minimum
5. Specific Gravity 3.0
Fig 1. Grading Curve for Natural Sand
Fig. 2 Grading Curve for Artificial Sand 0
20 40 60 80 100 120
0.1 1 10
C
u
m
u
lativ
e
P
er
ce
n
tag
e
P
ass
in
g
Sieve Size (mm)
Natural Sand Upper Limit
Lower Limit
0 20 40 60 80 100 120
0.1 1 10
C
u
m
u
lativ
e
P
er
ce
n
tag
e
P
ass
in
g
Sieve Size (mm)
Artificial Sand
Upper Limit
Volume 2, Issue 7, 2015
18 IV. EXPERIMENTAL PROGRAM
Concrete mix was designed for M20 grade in accordance with IS 10262-1982[7] and IS 456-2000[6] by assuming good degree of quality control and mild exposure conditions. In ASC, NS was fully replaced with AS. The adopted mix proportions by weigh batching method are summarized in Table 2 [3].
Table 2. Concrete Mix Proportions (M25 Grade Concrete)
Mixes Natural
Sand
Artificial Sand
Zone I Zone II Zone III Zone IV
w/c ratio 0.45 0.45 0.45 0.45 0.45
Cement (kg/m3) 438 438 438 438 438
Water (kg/m3) 197 197 197 197 197
Coarse Aggregate (kg/m3) 1145 1075 1110 1145 1180
Natural Sand (kg/m3) 637 0 0 0 0
Artificial Sand (kg/m3) 0 710 674 637 601
The exact amount of concrete ingredients were weighed and mixed thoroughly in concrete lab mixer till the consistent mix was achieved. The workability of fresh concrete was measured in terms of slump value. The standard cubes of 150 mm size, cast in steel moulds and compacted on a vibrating table and left for 24 hrs before demoulding. They were then placed in the curing tank until the day of casting. Compaction of concrete in three layers with 25 strokes of 16 mm rod was carried out for each layer. Water absorption capacity and moisture content were taken into consideration. The specimens were cured in water for 7 & 28 days by immersion and tested. The 6 cube specimens for NSC and 24 cube specimens each of ASC and SFRASC were tested for determining the compressive strength according to IS 516-1959[8].
IV. EXPERIMENTAL RESULTS
Fig. 3 Compressive Strength V/S Mixes for M25 Grade of Concrete
The compressive strength of artificial sand concrete (ASC) were higher than conventional natural sand concrete (NSC). The test results of ASC and NSC are reported in figure 3. The compressive strength of concrete done according to IS 516: 1959. The increase in compressive strength of artificial sand concrete of mix 3 (zone II) and mix 5 (zone IV) was found to be 19.61% and 4.05% respectively (Table 3) at 28 days, but there is decrease in compressive strength of mix 2 (zone I) and mix 4 (zone III) at 28 days as shown in above table. Zone II concrete mix gives the maximum compressive strength, so that it was used further with steel fiber percentage for carrying tests.
[* Mix 1 is for natural sand concrete and rest for artificial sand concrete.] 0
5 10 15 20 25 30 35 40
Mix 1 Mix 2 Mix 3 Mix 4 Mix 5
C
o
m
p
ress
iv
e
Stre
n
g
th
(
N/m
m
2)
Concrete Mixes
7 Days
19 Fig. 4 Slump Test for Compressive Strength of NSC and ASC
The procedure for carrying out slump cone test has been done according to IS 1199: 1959[10]. The measured slump values of NSC and ASC with constant water/cement ratio i.e. w/c ratio (0.45) were 120 mm, 130 mm, 105 mm, 95 mm, 65 mm for different mixes such as mix 1 (NSC), mix 2 (zone I), mix 3 (zone II), mix 4 (zone III) and mix 5 (Zone IV) respectively. The variations of slump value are shown in figure 4. It is observed that the slump value is decreases from zone II to zone IV up to 46% of artificial sand for same w/c ratio.
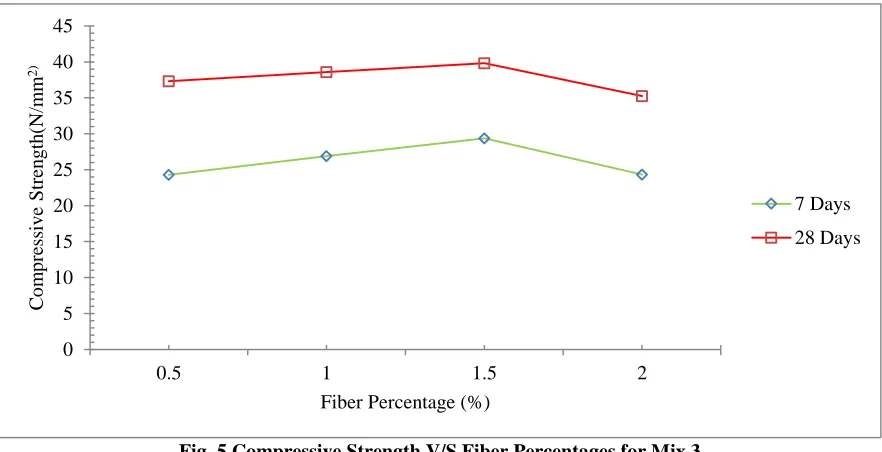
Fig. 5 Compressive Strength V/S Fiber Percentages for Mix 3
Compressive strength of the concrete cube is determined in accordance to IS: 516: 1959. The compressive strength of ASC without using steel fiber is 36.96 N/mm2 (at 28 days) and the compressive strength of the ASC using steel fiber is 39.83
N/mm2 (at 28 days), therefore it is clearly seen that there is increasing of compressive strength concrete. The maximum
compressive strength of ASC was found to be 39.83 N/mm2 for 1.5% of steel fiber at 28 days, but this strength decreased from
1.5% to 2.0% of steel fiber. Results for compressive strength of ASC for 0.5%, 1.0%, 1.5% and 2.0% of steel fiber at 7 days and 28 days are shown in the figure 5.
0 20 40 60 80 100 120 140
Mix 1 Mix 2 Mix 3 Mix 4 Mix 5
Slu
m
p
(
m
m
)
Concrete Mixes Slump
0 5 10 15 20 25 30 35 40 45
0.5 1 1.5 2
C
o
m
p
ress
iv
e
Stre
n
g
th
(N/m
m
2)
Fiber Percentage (%)
7 Days
Volume 2, Issue 7, 2015
20 Fig. 6 Slump Test for SFRASC
The procedure for carrying out slump cone test has been done according to IS 1199: 1959. The measured slump value of ASC with and without using steel fiber with constant water/cement ratio i.e. w/c (0.45) were 85 mm, 75 mm, 70 mm and 60 mm for different percentage of steel fiber such as 0.5%, 1.0%, 1.5% and 2.0% respectively. The variations of slump value with steel fiber percentage are shown in figure 6. It is observed that the slump value is decreasing up to 37% when steel fiber added in ASC for same w/c ratio.
VI. CONCLUSSION AND DISSCUSSION:
The test results obtained from experimental programme encourages the full replacement of natural sand by artificial sand considering the technical, environmental and commercial factors. The fineness modulus of natural sand and artificial sand was found as nearly same. The 28 days compressive strength of concrete was found maximum for Zone II of artificial sand as compared to 28 days compressive strength of natural sand concrete and other zones concrete. And the 28 days compressive strength of ASC was found maximum for 1.5% of steel fiber as compared to 28 days compressive strength of ASC without using steel fiber.
REFERENCES
[1] M. Chitlangeand P. Pajgade, ”Strength appraisal of artificial sand as fine aggregate in sfrc”, ARPN Journal of Engineering and Applied Sciences, Vol. 5, No. 10, pp. 34-38, October 2010.
[2] K. Kene, V. Vairagade and S. Sathawane, “Experimental study on behaviour of steel and glass fiber reinforced concrete composites”, Vol. 2, No. 4, pp. 125-130, December 2012.
[3] M. Chitlangeand P. Pajgade, “Steel fiber reinforced artificial sand concrete – appraisal in earthquake resisting structures”, ARPN Journal of Engineering and Applied Sciences, Volume 05, No. 04, pp. 802-208, August 2012. [4] S. Kandekar, A. Mehetre and Vijayshree A. Auti, “Strength of concrete containing different types of fine aggregate”,
International Journal of Scientific & Engineering Research Volume 3, Issue 9, pp. 1-3, September-2012.
[5] A Pofale and S. Quadri, “Effective utilization of crusher dust in concrete using portland pozzolana cement”, International Journal of Scientific and Research Publications, Volume 3, Issue 8, pp. 1-10, August 2013.
[6] IS: 456-2000, “Plain and reinforced concrete code of practice”, Bureau of Indian Standards, New Delhi, pp. 18. [7] IS: 10262-2009, “Concrete mix proportioning – guidelines (first revision)”, Bureau of Indian Standards, New Delhi,
pp. 1-7.
[8] IS: 516-1959, “Methods of tests for strength of concrete”, Bureau of Indian Standards, New Delhi, pp. 5.
[9] IS: 383-1970, “Specification for coarse and fine aggregates from natural sources for concrete”, Bureau of Indian Standards, New Delhi, pp. 11.
[10]IS 1199-1959, “Methods of sampling and analysis of concrete”, Bureau of Indian Standards, New Delhi, pp. 5-10. 0
10 20 30 40 50 60 70 80 90 100
0 0.5 1 1.5
Slu
m
p
(
m
m
)