66
International Journal of Innovative and Emerging
Research in Engineering
e-ISSN: 2394 - 3343 p-ISSN: 2394 - 5494
Design and Analysis of Deployable Antenna for Large Size
Antenna Structure
Akash M Patel
1Prof. Ramesh G Jivani
1Prof. Jayesh R Koisha
1Department of Mechanical B.V.M Engineering College. V.v.nagar, Anand, Gujarat, India1
Abstract:
The reflector antenna is used in space craft for reflecting back the electromagnetic waves. The
main aim of present work is to increase the diameter of solid reflector in space after deployed.
Various geometrical configurations are attempted for studying the feasibility of realizing the
final antenna meeting the stiffness and strength criterion with minimum mass. For
comparative studies of various configurations, Finite element method (FEM) was employed.
The configuration was finalized based on the primary requirement of stiffness with minimum
mass. The design was attempted using Carbon fiber reinforced plastic (CFRP) sandwich
material for stiff and light weight construction.
For flight solvability check, the finalized model
was analyzed for various types of static and dynamic loads (Sine and Random vibration loads).
Fabrication drawings generated as an outcome of the present work. This new folding
technique has significant advantages over number of existing concept both in terms of
packaged size and mechanical simplicity.
Keywords:
Deployable reflector, solid surface antenna, deployment mechanism.
I. INTRODUCTION
Deployable antennas are vital part of future space technology. The maximum diameter of launch vehicles limits the diameter of the antenna to about 4m, but antennas larger than this are necessary for earth observation and communications. Deployable antennas can be classified into two categories: furlable reflector surface and solid reflector surface.
Furlable antenna is one in which the surface itself can be folded. When deployed, the reflector surface is stretched out to form the required shape. Mesh antennas and inflatable antennas both are from this category.
67 However, the limited surface accuracy is the main disadvantage of furlable antennas which limits the operating frequency to 5 GHz. But the large size antenna is required for greater working frequency above 40 GHz which can easily be acquired from solid surface antenna but the size of this antenna is constrained by the limited dimension of Heat Shield of launch vehicle. This paper presents the possibility of development of solid surface reflector which is foldable and can be unfolded in larger size when deployed in space. [1]
II. OBJECTIVE
1. Design and Analysis of a Deployable Antenna for large size antenna structure. To design antenna, mechanical design goals are illustrated as below.
a) Natural frequency requirement of antenna is 40 Hz. b) Survivability to steady state acceleration loads. c) Survivability to launch load (Sine and Random). 2. Generating 2D Fabrication Drawing.
III. DESIGN CONFIGURATION
The number of configuration has been done on parabolic antenna having diameter 3.5 meter to obtain stowed volume within heat shield volume. After finalizing the design configuration number of iteration has been done on that configuration for studying the feasibility of realizing the final antenna meeting the stiffness and strength criterion with minimum mass. The Normal mode (modal) analysis has been carried out to evaluate the stiffness of antenna with minimum mass.
The normal mode of vibration is deformed shape of the structure at a specific natural frequency of vibration. Natural frequencies and mode shapes are functions of the structural properties and boundary conditions. The modal analysis has been carried out using finite element software Altair Hyper mesh.
The two different material used for antenna are Al Alloy 6061 and Al honeycomb CFRP composite material. The number of iteration has been done on selected configuration with two different material to get better natural frequency of antenna, and compare the results.
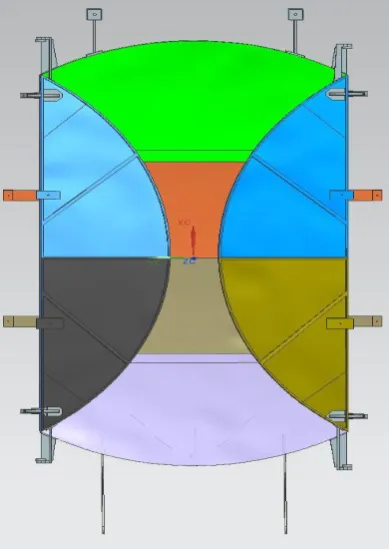
From modal analysis of different configuration, CFRP Al honeycomb composite material is selected for reflector. Because the Reflector made by Aluminium having the high weight and low natural frequency so another alternative CFRP Al honeycomb material having low weight and high natural frequency of reflector is selected. Figure 2 shows the final model of deployable antenna selected based on better natural frequency of antenna.
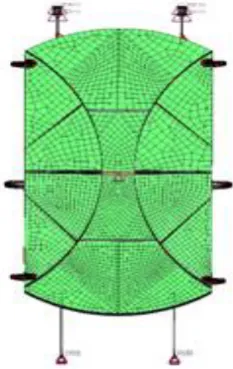
68 Figure 3 Mesh Model of Deployable Reflector
Shown in Figure 3 mesh model of deployable reflector in this model reflector surface is made of by composite material. They are made by five layer of composite in which middle layer is made by 12.7 mm aluminium honeycomb and upper and lower two layer are made by CFRP material having 0.1mm layer thickness and ply angle orientation is 0°- 90° and also same orientation in rib structure only thickness is different.
Figure 4 View of Hyper Laminate for 0/90 Symmetric Ply Orientation
After building the FE model in hyper mesh, normal mode analysis is done using radios solver. Material properties are defined using hyper laminate and also component properties (ply thickness). SPC and EIGRL load collectors are created for fixed support at base and calculate normal modes of antenna. Modal load step collector is created for that assigns the load to structure. Finally, analysis is done.
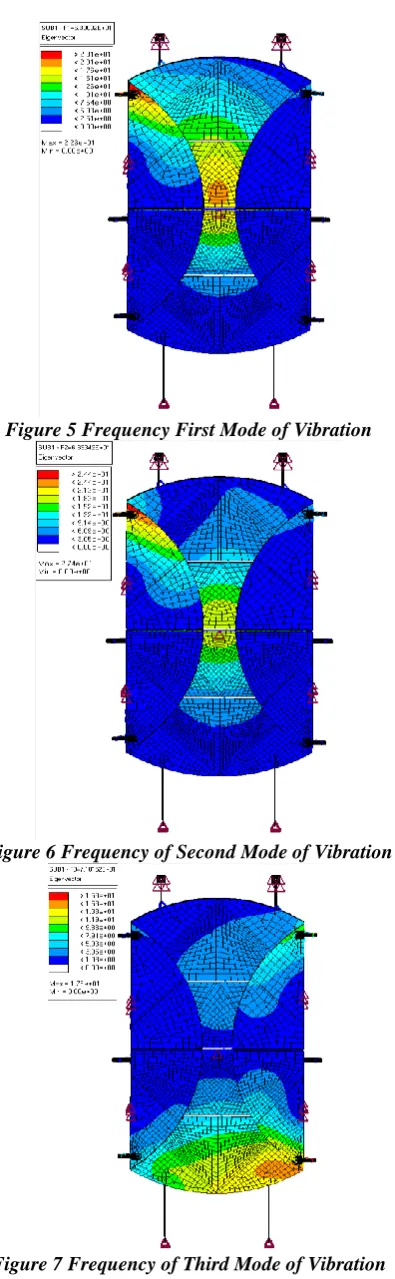
The natural frequency of first three mode of vibration are shown in Table 1 Table 1 Result of First Three Mode of Vibration
Sr.
No.
Mode of
Vibration
Natural
Frequency
(Hz)
1
First Mode of
Vibration
49.0
2
Second Mode
of Vibration
51.2
3
Third Mode of
69 Figure 5 Frequency First Mode of Vibration
Figure 6 Frequency of Second Mode of Vibration
Figure 7 Frequency of Third Mode of Vibration
IV STATIC STRUCTURAL ANALYSIS
A static structural analysis calculates the effects of steady loading conditions on a structure. Static analysis determines the displacements, stresses and forces in structures or components caused by loads.
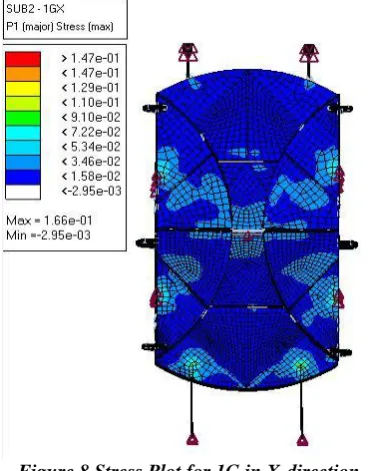
70 When load applied along X-axis, the stress developed in antenna is shown in Figure 8.
Figure 8 Stress Plot for 1G in X-direction
By Tsai-Wu failure criterion for composite material calculated margin of saftey of antenna for 1G acceleration loading in all three axis.[8]
The margin of saftey calculated for X-axis is 106 which is much higher so design is safe under static structural 1G loading. Same as margin of saftey for Y-axis and Z-axis are 95 and 46 respectively which is much higher so design is safe under all three axis static loading condition.
V
DYNAMIC ANALYSISA. Frequency Response Analysis
Frequency response analysis is used to calculate the response of a structure about steady state oscillatory excitation. A frequency response function expresses the structural response to an applied force as function of frequency. In frequency response analysis, the loading is a sine wave for which the frequency, amplitude, and phase are specified. The response may be given in terms of displacement, velocity, or acceleration. [10]
In sinusoidal vibration, the input frequency is varied and the output characteristics are computed or represented as a function of the frequency. Sine vibration is expressedas acceleration and a frequency. The objective of this analysis is to find the acceleration responses with respect to frequencies. Sine test is performed with constant amplitude of 1g and frequency range of 20 to 2000 Hz. From final configuration the nodes withrespect first three modes are selected and response correspond to that nodes are recorded. First test is performed by applying load along the X-axis Then Y and Z. [10]
To perform the sine vibration analysis in hyper mesh, Modal frequency response analysis approach is used. B. Sinusoidal Vibration Analysis When Load Applied Along X-Direction
Figure 9 Sine Response Analysis along X-axis
71 C. Sinusoidal Vibration Analysis When Load Applied Along Z-Direction
Figure 10 Sine Response Analysis along Z-axis
Shown in Figure 10 along the Z axis first excited mode is at 51 Hz, which is near the second natural frequency of antenna.
D. Sinusoidal Vibration Analysis When Load Applied Along Y-Direction
Figure 11 Sine Response Analysis along Y-axis
Shown in Figure 11 along the Y axis first excited mode is at 53 Hz, which is near the third natural frequency of antenna.
From the sine response analysis for different direction the peak is excited near the natural mode of frequency.
E. Random Vibration Analysis
Random response analysis is used when a structure is subjected to a nondeterministic, continuous excitation. Random vibrations are more closely represents the true environments in which spacecraft operate. [10]
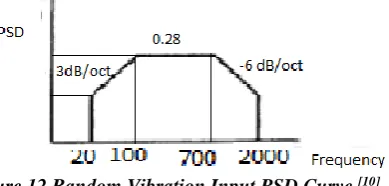
Input data for qualification and acceptance level is defined using following graph shown in Figure 12.
Figure 12 Random Vibration Input PSD Curve [10]
PSD values corresponding to their frequencies are calculated using relation between PSD and frequency. The relation between PSD and frequency is defined as [10]
𝑃
1= 𝑃
2(
𝑓
1𝑓
2)
72 Table 2 Random Vibration Input Data Axis Normal to Mounting Plane [10]
Frequency
(Hz)
PSD (g
2/Hz)
Qualification
Level
Acceptance
Level
20-100
+3dB/oct
+3dB/oct
100-700
0.28
0.12
700-2000
-6dB/oct
-6dB/oct
Overall RMS
17.5g
11.7g
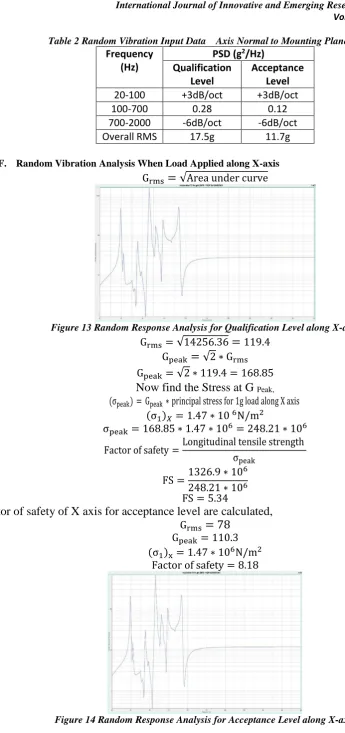
F. Random Vibration Analysis When Load Applied along X-axis
G
rms=
√Area under curve
Figure 13 Random Response Analysis for Qualification Level along X-axis
G
rms= √14256.36
=
119.4
G
peak=
√2 ∗ G
rmsG
peak= √2 ∗ 119.4 = 168.85
Now find the Stress at G
Peak,(σ
peak) = G
peak∗ principal stress for 1g load along X axis
(σ
1)
𝑋= 1.47 ∗ 10
6N/m
2σ
peak= 168.85 ∗ 1.47 ∗ 10
6= 248.21 ∗ 10
6Factor of safety =
Longitudinal tensile strength
σ
peakFS =
1326.9 ∗ 10
6
248.21 ∗ 10
6FS = 5.34
Factor of safety of X axis for acceptance level are calculated,
G
rms= 78
G
peak= 110.3
(σ
1)
x= 1.47 ∗ 10
6N/m
2Factor of safety = 8.18
73 Similarly, factor of safety for qualification and acceptance level of next two axis Z and Y are calculated. The results are as given below,
Factor of saftey for Z axis qualification level is 5.8 and for acceptance level is 7.3. Factor of saftey for Y axis qualification level is 7.6 and for acceptance level is 10.2.
VI
TORQUE CALCULATION and VALIDATIONThe requirements of a deployable antenna motion control system are to analyze the electrical as well as mechanical characteristics. Mechanical characteristics include friction, torque requirement, rotational speed etc. The first step is to calculate torque requirement for desiredspeed which depends on inertia and frictional forces. Motor drive is attractive where mechanical simplicity is desirable and when the load being drivenhas a moderate inertia. The total torque required is taken higher than load inertia.
Inertia Torque (for Right Side Part),𝑇 = 𝐼 ∝
= 1231075.58× 0.01 = 1.231 × 10⁴ N mm Inertia Torque (for Left Side Part),𝑇 = 𝐼 ∝
= 1165818.22 × 0.01 = 1.165 × 10⁴ N mm
Torque required for the Motor to overcome the inertia and static friction effect is taken two to three time higher.
= 3 × Inertia Torque of Right Side Part = 3 × 1.231 × 104
= 3.693 × 10⁴ N mm
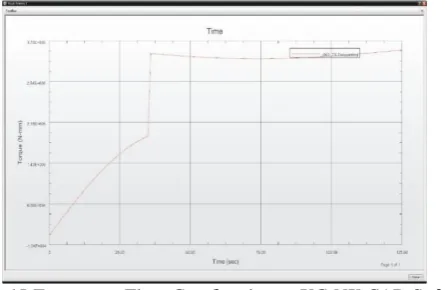
In order to validate this torque values dynamic motion simulation has been done by high end CAE software
Figure 15 Torque vs. Time Graph using UG NX CAD Software
From above graph the torque obtain using cad tool is approximately same as a calculated torque for motor drive.
VII CONCLUSION
From the result comparison between two materials, Al Alloy 6061 is having low natural frequency with high weight. So CFRP Al honeycomb material is used having characteristic high strength to weight ratio.
From static analysis, margin of safety number is found within safe limit, so it is concluded that the design is safe for static analysis.
In sine vibration analysis, it is seen that there is no peak below 40 Hz. So it is concluded that the design is safe for sine vibration.
For random vibration analysis, factor of safety for qualification level in all three axes is more than three and for acceptance level more than five. It is concluded that configuration survives the launch loads.
Finally, free vibration analysis of designed antenna is done. The first natural frequency of designed antenna is 49Hz. It can be concluded that final design meets the design goals.
VII FUTURE WORK
74 VIII REFERENCE
[1] L Datashvili, S Endler, B Wei, H Baier,” Study of Mechanical Architectures of Large Deployable Space antenna apertures” ,Springer CEAS Space J 5:169– 184 (2013)
[2] Rory Barrett,”Deployable Reflectors for Small Satellites”,springer.21st Annual AIAA/USU conference on Small Satellite. August 15th, 2007
[3] Robert Taylor and Dana Turse,” Large Aperture, Solid Surface Deployable Reflector”, , Earth Science Technology Advanced Component Technology (ACT) program, Springer (2007) [4] S. Pellegrino, S. D. Guest,” Concept for Solid Surface Deployable Antennas”, Acta
Astronautica, 38, 103-113 (1995)
[5] M. Eigenmann, M. Schmalbach, M. Schiller, T. Schmidt, L. Scolamiero,” Ultra-Deployment Mechanism (UDM) for Sectioned Large Deployable Antenna Reflectors”, 14th European Space Mechanisms & Tribology Symposium–ESMATS (2012)
[6] Norazman Mohamad nor,” Static analysis and design of sandwiched composite long-span portable beam”, International Journal of the Physical Sciences Vol.6 (27), pp. 6323-6328, 2 November, 2011
[7] P k parathi, S k Bhattacharyya and P k Sinha, Bull. Mater. Sic.,” Failure analysis of multiple delaminated composite plates due to bending and impact”, Indian Academy of Sciences.143. Vol. 24, No. 2, pp. 143–149, April 2001
[8] Athanasios J. Kolios, Stefano Proia,” Evaluation of the Reliability Performance of Failure Criteria for Composite Structures”, World Journal of Mechanics, 2,162-170 (2012) [9] Machine design by V. B. Bhandari
[10] Steinberg, Vibration analysis for electronic equipment, Third edition, University of California