VOLUME 39, ARTICLE 45, PAGES 1227
,
1240
PUBLISHED 13 DECEMBER 2018
https://www.demographic-research.org/Volumes/Vol39/45/ DOI: 10.4054/DemRes.2018.39.45
Descriptive Finding
Does age-adjusted measurement of contraceptive
use better explain the relationship between
fertility and contraception?
Yoonjoung Choi
Madeleine Short Fabic
Jacob Adetunji
© 2018 Yoonjoung Choi, Madeleine Short Fabic & Jacob Adetunji.
This open-access work is published under the terms of the Creative Commons Attribution 3.0 Germany (CC BY 3.0 DE), which permits use, reproduction, and distribution in any medium, provided the original author(s) and source are given credit.
1 Background 1228
2 Methods 1229
2.1 Data and measurement 1229
2.2 Analysis 1230
3 Results 1231
3.1 Differential associations between TFR and CPR over time 1231
3.2 Developing an age-adjusted CPR 1233
3.3 Comparison between unadjusted and age-adjusted CPR estimates 1233 3.4 Relationship between TFR and contraceptive use: Unadjusted vs.
age-adjusted CPR 1235
4 Discussion and conclusion 1237
Does age-adjusted measurement of contraceptive use better explain
the relationship between fertility and contraception?
Yoonjoung Choi1
Madeleine Short Fabic2 Jacob Adetunji2
Abstract
BACKGROUNDThe typical contraceptive–fertility relationship has not held in some countries witnessing rapid increases in contraceptive uptake. With increasingly more diverse population age structures among developing countries, one explanation may be the different measurement approaches of total fertility rate (TFR), an age-adjusted measure, and contraceptive prevalence rate (CPR), an unadjusted measure.
OBJECTIVE
To examine whether the association between contraception and fertility has changed over time in less developed settings and whether the relationship is better explained with an age-adjusted measure of contraceptive use.
METHODS
Using data from 259 Demographic and Health Surveys, we examine associations between CPR and TFR in two 15-year periods. We then develop age-adjusted CPR and explore the relationship between TFR and unadjusted versus age-adjusted CPR, using linear regression analyses with country-level fixed effects.
RESULTS
A TFR decrease of 1 was associated with a CPR increase of 15.4 percentage points during 1985–2000 and of 17.2 percentage points during 2001–2016. On average, across 259 surveys, age-adjusted CPR was higher than unadjusted CPR by about 3% with significant regional variation. Regression model fit reveals that age-adjusted CPR better explains the CPR–TFR relationship.
1 Department of Population, Family, and Reproductive Health, Bloomberg School of Public Health, Johns
Hopkins University, Baltimore, USA. Email:[email protected].
2 Office of Population and Reproductive Health, Bureau for Global Health, US Agency for International
CONTRIBUTION
Age-adjusted CPR addresses varying age structures and age patterns of contraceptive use across populations, facilitating cross-country and cross-temporal comparisons of contraceptive use. Updated demographic shorthand for the CPR–TFR relationship is that a TFR decrease of 1 is associated with a CPR increase of 17 percentage points overall and a 20 percentage point increase in sub-Saharan Africa.
1. Background
Contraceptive use is one of the major proximate determinants of fertility, along with marriage (or union formation), postpartum insusceptibility, and abortion (Bongaarts 1982). The proximate determinants model has been refined over time (Bongaarts 1982, 2015; Stover 1998), yet the simple quantification of the relationship between contraception and fertility the model originally revealed has remained commonly reported and used by researchers, family planning program managers, and advocates worldwide. This simple quantification, based on time-series and cross-sectional data, shows that an increase in contraceptive prevalence rate (CPR) by roughly 15 percentage points is associated with a reduction by 1 in total fertility rate (TFR) (Mauldin and Segal 1988; Ross and Frankenberg 1993; Tsui 2001). Recently observed rapid increases in contraception in myriad countries, however, have not followed this expected CPR– TFR relationship, and studies have reported TFR declining at a slower pace than expected (Bongaarts 2015; Bongaarts and Casterline 2013; Saha and Bairagi 2007). The CPR–TFR relationship appears to be less stable and more context-specific than historic trends would suggest.
Another potentially important reason for the ‘misalignment’ is related to measurement. While TFR is a synthetic cohort measure calculated as an age-adjusted indicator, CPR is a current status measure calculated without any age adjustment. The measurement differential between (age-adjusted) TFR and (age-unadjusted) CPR could be important due to age patterns of contraceptive use and population age structure. With regard to age patterns, if a rapid increase in contraceptive use is more concentrated at older ages where, compared to the 20s and 30s, fecundability is lower and fertility is less associated with contraceptive use, contraceptive impact on overall fertility may be less than expected from the relationship based on historic data. In such cases, TFR would likely be higher than CPR would predict. Second, because population age structures of countries in developing regions have become more heterogeneous over time, some countries may be witnessing higher proportions of women in age bands that generally have higher fertility. In such cases, TFR could stagnate even as CPR rises. The population pyramids of low-income and lower-middle-income countries were quite similar 30 years ago. Over the intervening years, the population distribution has remained relatively stable in low-income countries but has shifted significantly in lower-middle-income countries, increasingly reflecting the distribution of high-income countries. With changing population structures, a contraceptive use measure that is not age-adjusted may be limited when comparing trends within a country as well as across countries.
Our study aims to examine recent CPR–TFR ‘misalignment’ by focusing on a relatively underexplored factor of the misalignment, age-adjustment in the measurement of CPR. The study purpose is to understand if the association between contraceptive use and fertility is better explained with an age-adjusted measure of contraceptive use. The specific objectives are to: (1) assess differential associations between TFR and CPR over time; (2) develop an age-adjusted measure of CPR; (3) describe differentials between unadjusted and adjusted CPR; (4) assess if the relationship between TFR and contraceptive use is better explained by age-adjusted CPR.
2. Methods
2.1 Data and measurement
women are interviewed in a subset of countries due to cultural sensitivities. Each woman is asked to provide information about her birth history, fertility preferences, family planning use, marital status, sexual activity, etc.
We obtained estimates for our study data in September 2017 through the DHS Application Programming Interface (API) (http://api.dhsprogram.com): TFR, age-specific fertility rates (ASFR), CPR (i.e., percentage of women currently using any method of contraception, including both modern and traditional), and union status (i.e., percentage of women who are currently married or live with a partner). For each survey where only ever-married women were interviewed the DHS Program adjusted the fertility estimates using an all-women factor, to provide fertility estimates among the population of all women (Rutstein and Rojas 2006). We used contraceptive use estimates among all women, since fertility estimates are based on all women. For CPR and union status we used overall prevalence among women 15–49 years of age and five-year age-specific estimates. We included estimates from a total of 259 surveys conducted in 85 countries.
2.2 Analysis
Unit of analysis is individual survey, and any summary statistics across the 259 surveys are unweighted. To address Specific Aim 1 we conducted simple linear regression analysis on TFR using unadjusted CPR as the independent variable, with country-level fixed effect. Analysis was conducted in two separate samples: surveys conducted between 1985 and 2000 (n = 120) and between 2001 and 2016 (n = 139). The 15-year periods were used to further allow investigation of regional variation – described briefly, considering the number of surveys. We compared the coefficient on CPR between the two periods, and we used the Chow test to examine the difference in coefficients between the two samples. In addition, model fit was compared across the two period samples using relevant statistics – specifically, variation explained by the model (R-squared). We also assessed the association between TFR and modern contraceptive prevalence rate. The results were qualitatively the same as those using CPR, so we chose to conduct further analyses using only CPR.
To develop age-adjusted CPR among all women of reproductive age (Specific Aim 2) we followed the synthetic cohort approach used in TFR calculation and calculated:
The age-adjusted measure is a synthetic measure of the percentage of women 15– 49 years who would be using a method of contraception if they were to go through their childbearing years using contraception according to the current schedule of age-specific contraceptive prevalence rates in their country. The 5-year age-specific CPR refers to CPR among women in 5-year age groups: 15–19, 20–24, 25–29, 30–34, 35–39, 40–44, and 45–49 years of age.
Once we constructed age-adjusted measures, we compared them with unadjusted measures to identify whether and how the measures differed (Specific Aim 3). Specifically, we calculated the relative difference between unadjusted and age-adjusted estimates and examined whether there is an association between the relative difference and the overall level of unadjusted measure. Any regional pattern in the relative difference was further examined. In addition, we compared average annual change in unadjusted vs. age-adjusted CPR. We estimated the rate of change using country-level fixed effect bivariate linear regression analyses with survey year as an independent variable.
Finally, to address Specific Aim 4, we conducted linear regression analyses on TFR using unadjusted vs. age-adjusted CPR. Our strategy was to compare the association between TFR and a CPR measure, as well as model fit between a pair of models, each using unadjusted vs. age-adjusted measures. Simple and multivariate models were used. Multivariate models included additional independent variables: percentage of women in union – another critical proximate determinant of fertility – and regional classification, considering vastly different fertility patterns across regions (Bongaarts and Casterline 2013). Again, country-level fixed effects models were used. We used Stata 14.2 for all analyses.
3. Results
3.1 Differential associations between TFR and CPR over time
Table 1: Linear regression of contraceptive use on TFR
Period 1 Period 2 Period 1 & 2 combined
Variable Coef. P>|z| Coef. P>|z| Coef. P>|z|
All countries
CPR –0.065 0.000 –0.058 0.000 –0.057 0.000
Period –0.323 0.006
Period*CPR 0.002 0.586
Constant 6.430 0.000 5.932 0.000 6.124 0.000
Number of surveys 121 139 259
Number of countries 67 67 85
R-square: within 0.371 0.040 0.586
R-square: between 0.684 0.579 0.628
R-square: overall 0.705 0.589 0.649
Chow-test
F statistic 18.77
p-value 0.0001
Sub-Saharan African countries
CPR –0.057 0.000 –0.049 0.000 –0.045 0.000
Period –0.248 0.147
Period*CPR –0.002 0.822
Constant 6.638 0.000 6.297 0.000 6.439 0.000
Number of surveys 55 77 132
Number of countries 32 36 40
R-square: within 0.259 0.480 0.475
R-square: between 0.435 0.382 0.414
R-square: overall 0.409 0.409 0.449
Chow-test
F statistic 9.59
p-value 0.0083
Note: All models are with country-level fixed effect.
3.2 Developing an age-adjusted CPR
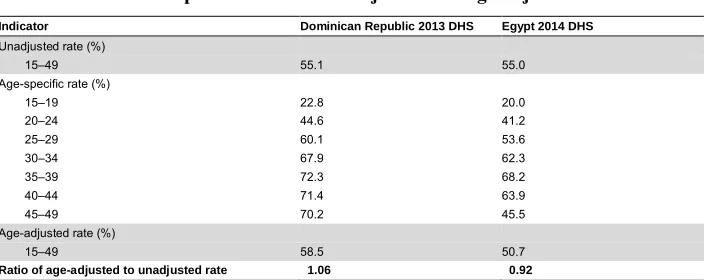
Table 2 presents an illustrative example using data from two countries: the Dominican Republic and Egypt. According to the most recent survey in each country, both countries had nearly identical levels of CPR (55.1% and 55.0% respectively), but different age-adjusted CPR estimates (58.5% and 50.7% respectively). Compared to unadjusted measures, age-adjusted estimates were about 6% higher in the Dominican Republic and 8% lower in Egypt.
Table 2: Illustrative examples of contraceptive prevalence rate by age group, and comparison between unadjusted and age-adjusted measures
Indicator Dominican Republic 2013 DHS Egypt 2014 DHS
Unadjusted rate (%)
15–49 55.1 55.0
Age-specific rate (%)
15–19 22.8 20.0
20–24 44.6 41.2
25–29 60.1 53.6
30–34 67.9 62.3
35–39 72.3 68.2
40–44 71.4 63.9
45–49 70.2 45.5
Age-adjusted rate (%)
15–49 58.5 50.7
Ratio of age-adjusted to unadjusted rate 1.06 0.92
3.3 Comparison between unadjusted and age-adjusted CPR estimates
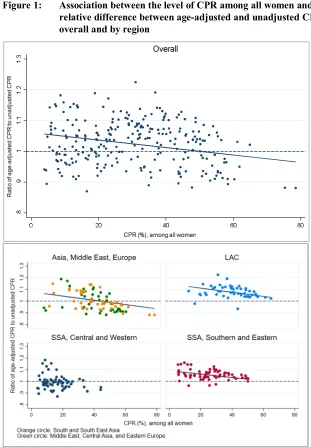
On average, across the 259 surveys, the age-adjusted CPR was slightly higher than the unadjusted CPR (by 2.7%). There was, however, considerable variation. The ratio of the age-adjusted to unadjusted CPR ranged from 0.87 in the Cote d’Ivoire 1994 DHS to 1.22 in the Dominican Republic 1986 DHS. The ratio tended to be lower in countries with high CPR (Figure 1). A bivariate linear regression analysis suggested that the inverse linear pattern is statistically significant (results not shown) but the model fit was poor (R-squared overall = 0.03).
Figure 1: Association between the level of CPR among all women and the relative difference between age-adjusted and unadjusted CPR, overall and by region
3.4 Relationship between TFR and contraceptive use: Unadjusted vs. age-adjusted CPR
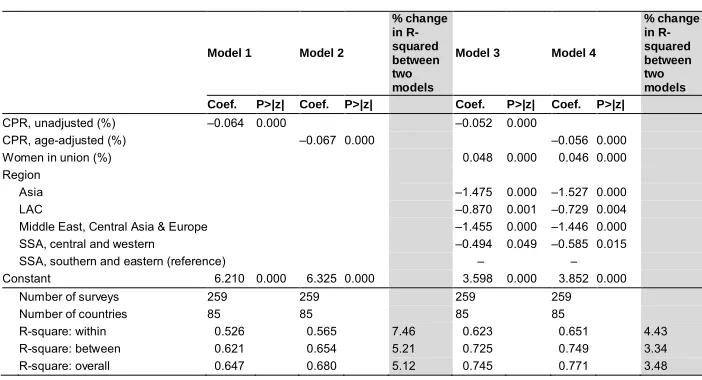
Recognizing that unadjusted and age-adjusted CPR are indeed different, we turned our attention to our main study question: Does age-adjusted CPR explain the relationship between TFR and contraceptive use better than unadjusted CPR? We explored this question using four models (Table 3). Our two bivariate linear regression models show the association between TFR and unadjusted CPR (Model 1) and age-adjusted CPR (Model 2). R-squared values suggest that Model 2 explains variation better than Model 1 (an increase by about 7% in within, 5% in between, and 5% in overall). Two multivariate models also suggested improved model fit when using age-adjusted CRP compared to unadjusted CPR.
Table 3: Linear regression of contraceptive use on TFR by unadjusted vs. age-adjusted contraceptive use
Model 1 Model 2
% change in R-squared between two models
Model 3 Model 4
% change in R-squared between two models Coef. P>|z| Coef. P>|z| Coef. P>|z| Coef. P>|z|
CPR, unadjusted (%) –0.064 0.000 –0.052 0.000
CPR, age-adjusted (%) –0.067 0.000 –0.056 0.000
Women in union (%) 0.048 0.000 0.046 0.000
Region
Asia –1.475 0.000 –1.527 0.000
LAC –0.870 0.001 –0.729 0.004
Middle East, Central Asia & Europe –1.455 0.000 –1.446 0.000
SSA, central and western –0.494 0.049 –0.585 0.015
SSA, southern and eastern (reference) – –
Constant 6.210 0.000 6.325 0.000 3.598 0.000 3.852 0.000
Number of surveys 259 259 259 259
Number of countries 85 85 85 85
R-square: within 0.526 0.565 7.46 0.623 0.651 4.43
R-square: between 0.621 0.654 5.21 0.725 0.749 3.34
R-square: overall 0.647 0.680 5.12 0.745 0.771 3.48
LAC: Latin America and the Caribbean, SSA: sub-Saharan Africa. Models 1 and 2 are bivariate linear regression models on total fertility rate with unadjusted and age-adjusted CPR, respectively. Models 3 and 4 are multivariate linear regression models on total fertility rate with unadjusted and age-adjusted CPR, respectively, controlled for percentage of female population in union and regional classification.
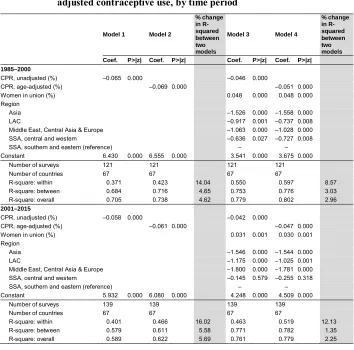
timeframe. Also, generally, even when using age-adjusted CPR, the model explained a lower amount of within-country variance during the recent time period, compared to R-squared during the earlier time period.
Table 4: Linear regression of contraceptive use on TFR by unadjusted vs. age-adjusted contraceptive use, by time period
Model 1 Model 2
% change in R-squared between two models
Model 3 Model 4
% change in R-squared between two models Coef. P>|z| Coef. P>|z| Coef. P>|z| Coef. P>|z|
1985–2000
CPR, unadjusted (%) –0.065 0.000 –0.046 0.000
CPR, age-adjusted (%) –0.069 0.000 –0.051 0.000
Women in union (%) 0.048 0.000 0.048 0.000
Region
Asia –1.526 0.000 –1.558 0.000
LAC –0.917 0.001 –0.737 0.008
Middle East, Central Asia & Europe –1.063 0.000 –1.028 0.000
SSA, central and western –0.636 0.027 –0.727 0.008
SSA, southern and eastern (reference) – –
Constant 6.430 0.000 6.555 0.000 3.541 0.000 3.675 0.000
Number of surveys 121 121 121 121
Number of countries 67 67 67 67
R-square: within 0.371 0.423 14.04 0.550 0.597 8.57
R-square: between 0.684 0.716 4.65 0.753 0.776 3.03
R-square: overall 0.705 0.738 4.62 0.779 0.802 2.96
2001–2015
CPR, unadjusted (%) –0.058 0.000 –0.042 0.000
CPR, age-adjusted (%) –0.061 0.000 –0.047 0.000
Women in union (%) 0.031 0.001 0.030 0.001
Region
Asia –1.546 0.000 –1.544 0.000
LAC –1.175 0.000 –1.025 0.001
Middle East, Central Asia & Europe –1.800 0.000 –1.781 0.000
SSA, central and western –0.145 0.579 –0.255 0.318
SSA, southern and eastern (reference) – –
Constant 5.932 0.000 6.080 0.000 4.248 0.000 4.509 0.000
Number of surveys 139 139 139 139
Number of countries 67 67 67 67
R-square: within 0.401 0.466 16.02 0.463 0.519 12.13
R-square: between 0.579 0.611 5.58 0.771 0.782 1.35
R-square: overall 0.589 0.622 5.69 0.761 0.779 2.25
4. Discussion and conclusion
As population structures and contraceptive use dynamics change, so too does the relationship between CPR and TFR. Our analyses confirm that the CPR–TFR relationship has attenuated. Employing the age-adjustment did improve the overall amount of variance explained by the model, supporting our hypothesis that age-adjusted CPR would explain the relationship between contraceptive use and fertility better than the unadjusted CPR.
One reason for this improvement is likely due to contraceptive use dynamics across age, as previously mentioned. Age-specific contraceptive use has changed over the years (results not shown). The age groups experiencing the fastest increases in use are generally older, with women in age groups 35–39 and 40–44 having the fastest changes in CPR and women in age groups 15–19 and 20–24 having the slowest. Since women in older ages have lower underlying fertility risk than those of younger ages, increases in contraceptive use among older women will have less impact on TFR, thereby contributing to the attenuation of the relationship, especially in countries with younger populations.
The other factor is population age structures, which have become more diverse across countries as countries are at different stages of fertility transition. Younger population structure in LAC and southern and eastern SSA implies that conventional CPR is weighted towards lower contraceptive use among younger women. With the synthetic age-adjusted CPR, equal weight is given across age groups, resulting in higher estimated than unadjusted CPR on average across 259 surveys. In populations with low contraceptive use the adjustment is not shifted in one direction because of generally low age-specific CPR across age groups.
contraception than their younger counterparts, unadjusted CPR is higher than adjusted CPR. As these examples illustrate, age-adjusted CPR addresses varying age patterns of contraceptive use and different age structures across populations, facilitating comparison of contraceptive use over time and across countries.
References
Bertrand, J.T., Sullivan, T.M., Knowles, E.A., Zeeshan, M.F., and Shelton, J.D. (2014). Contraceptive method skew and shifts in method mix in low- and middle-income countries.International Perspectives on Sexual and Reproductive Health 40(3): 144–153.doi:10.1363/4014414.
Bongaarts, J. (1982). The fertility-inhibiting effects of the intermediate fertility variables.Studies in Family Planning 13(6/7): 179–189.doi:10.2307/1965445. Bongaarts, J. (2015). Modeling the fertility impact of the proximate determinants: Time
for a tune-up. Demographic Research 33(19): 535–560.doi:10.4054/DemRes. 2015.33.19.
Bongaarts, J. and Casterline, J. (2013). Fertility transition: Is sub-Saharan Africa different? Population and Development Review 38(S1): 153–168. doi:10.1111/ j.1728-4457.2013.00557.x.
CESDEM and ICF International (2014). Republica Dominicana encuesta demografica y de salud 2013. Santo Domingo: Centro de Estudios Sociales y Demograficos and ICF International.
Majumder, N. and Ram, F. (2015). Explaining the role of proximate determinants on fertility decline among poor and non-poor in Asian countries. PLoS ONE 10(2): e0115441.doi:10.1371/journal.pone.0115441.
Mauldin, W.P. and Segal, S.J. (1988). Prevalence of contraceptive use: Trends and issues.Studies in Family Planning 19(6 Pt 1): 335–353.doi:10.2307/1966628. Ministry of Health and Population, El-Zanaty, F. and Associates, and ICF International
(2015). Egypt demographic and health survey 2014. Cairo: Ministry of Health and Population and ICF International.
Rogers, E. and Stephenson, R. (2017). Examining temporal shifts in the proximate determinants of fertility in low- and middle-income countries. Journal of Biosocial Science 50(4): 551–568.doi:10.1017/S0021932017000529.
Ross, J., Keesbury, J., and Hardee, K. (2015). Trends in the contraceptive method mix in low- and middle-income countries: Analysis using a new ‘average deviation’ measure.Global Health: Science and Practice 3(1): 34–55. doi:10.9745/GHSP-D-14-00199.
Rutstein, S.O. and Rojas, G. (2006).Guide to DHS statistics. Calverton: DHS Program. Saha, U.R. and Bairagi, R. (2007). Inconsistencies in the relationship between
contraceptive use and fertility in Bangladesh. International Family Planning Perspectives 33(1): 31–37.doi:10.1363/3303107.
Stover, J. (1998). Revising the proximate determinants of fertility framework: What have we learned in the past 20 years? Studies in Family Planning 29(3): 255– 267.doi:10.2307/172272.
Stover, J. and Winfrey, W. (2017). The effects of family planning and other factors on fertility, abortion, miscarriage, and stillbirths in the spectrum model. BMC Public Health 17(S4): 775.doi:10.1186/s12889-017-4740-7.
Tsui, A.O. (2001). Population policies, family planning programs, and fertility: The record. Population and Development Review 27(Supplement: Global Fertility Transition): 184–204.