COMPARATIVE INVESTIGATION ON BENDING BEHAVIOR OF CORRUGATED
FIBER/POLYMER COMPOSITE SANDWICH STRUCTURE
M. Nusrathulla *1 Dr. M. Shantaraja2
*1Research scholar in the Department of Mechanical Engineering, at UVCE, Bangalore. India. 2Assistant Professor in the Department of Mechanical Engineering at UVCE, Bangalore. India.
KEYWORDS
:
Polymer Sandwich structure, Three point bending.ABSTRACT
Fiber-reinforced polymer corrugated core sandwich panels were tested for three point bending using UTM. Three types of epoxy based corrugation i.e sinusoidal, square and triangle of different core thickness were tested. The paper focused to compare experimental results with finite element method. Bending load v/s deflection curves were plotted and analyzed, the experimental results are in good agreement with the result of finite element analysis done using Ansys.
INTRODUCTION
Sandwich structures have recently been investigated for their lightweight and multifunctional characteristics, as well as their resistance to blast [1-5]. Various cores have been described, including tetrahedral and pyramidal truss configurations, square honeycombs, corrugated and diamond prismatic configurations and textiles. Methods for manufacturing panels with these cores have been invented and described [6-7].
In some cases, tests have been performed to characterize the core properties and, in others, sandwich panels with these cores have been tested in various shear and bending modes[8-9]. In most cases, analytical formulae characterizing the elastic properties of the cores and of the loads at which they yield and buckle have been derived [10-12]. These formulae have been used to plot failure mechanism maps and to identify minimum flexural strength of the corresponding panels. A relatively complete characterization of the performance of both the cores and the panels, involving both calculations and measurements, has been presented in only one case: pyramidal truss cores [13]. Even then, the results have been restricted to yield strain, ey, and strain hardening levels representative of annealed stainless steel. None of the articles have attempted an explicit comparison among all available core topologies for materials with a range of ey. This article addresses one basic aspect of this comparison with FEM, by establishing deflection for each, subject to generalized bending.
The corrugated core sandwiches of various thicknesses (0.5mm, 0.75mm, 1mm) and shape (sinusoidal, square, and triangular) were fabricated using epoxy and glass fiber by hand layup technique. The materials used for the preparation of composite laminates are Epoxy resin LY556 (10% amine based hardener), E-Glass Fiber- Plain woven - 0/90 = 200 gsm and Standard Epoxy Adhesive.
Three point bending
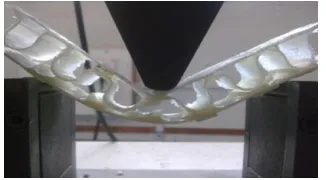
Three point bending test is done according to the ASTM standard C 393 as shown in below figure. Specimens of three types of core geometry and thickness were tested. The dimensions of the specimens are shown in Table 1 three specimens of each type were tested. The test is done using a UTM of 10 ton capacity
Three point bending test of a specimen using UTM
Table 1 Dimensions details of specimens three point bending test.
Profile Sinusoidal Square Triangle
Thickness of core in mm 0.5 0.75 1.00 0.5 0.75 1.00 0.5 0.75 1.00
Total length l in mm 152.4 152.4 152.4 152.4 152.4 152.4 152.4 152.4 152.4
Span Length L in mm 102 102 102 102 102 102 102 102 102
Width b in mm 25.4 25.4 25.4 25.4 25.4 25.4 25.4 25.4 25.4
Height d in mm 15.2 15.45 15.7 15.2 15.45 15.7 15.2 15.45 15.7
RESULTS AND DISCUSSION
Response of corrugated sandwich structures to three point bending
for each kind of corrugated sandwich composites for three point bending tests are shown in Figs 1 to 3. Some of the general observations from these curves and the observations of the samples during deformation are listed below.
show the average bending load of three specimens v/s deflection for sinusoidal, square and triangular specimens of 0.5, 0.75 and 1 mm thickness respectively.
It can be observed that peak load which is, the load that the specimen can withstand before failure, is high when the thickness of the corrugation is 1.0 mm and least when the thickness of the corrugation is 0.5 mm. It is also observed that as the thickness of the corrugation is increased the load that can be taken by the specimen before failure also increased. In case of sinusoidal profile, the mean peak load for 1 mm thickness is 1253 N, whereas in case of square corrugation of 1 mm thickness the mean peak load is 910 N and for triangle corrugation of 1 mm thickness it is 1053 N.
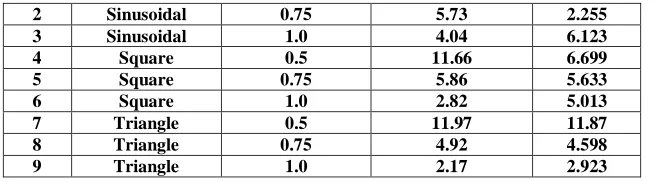
Table 2. Comparison of three point bending results.
Sl. No.
Corrugation profile
Corrugation thickness
Deflection in mm Experimental Analysis
2 Sinusoidal 0.75 5.73 2.255
3 Sinusoidal 1.0 4.04 6.123
4 Square 0.5 11.66 6.699
5 Square 0.75 5.86 5.633
6 Square 1.0 2.82 5.013
7 Triangle 0.5 11.97 11.87
8 Triangle 0.75 4.92 4.598
9 Triangle 1.0 2.17 2.923
It can be seen from the table 2 that the experimental results are in good agreement with the result of finite element analysis done using Ansys. Only slight variation in the results is seen this is caused due to the different types of failures involved in the specimens. The maximum difference in result is seen for square corrugated specimen with 0.5mm thickness, where the experimental result is 11.66mm where as that of the analysis is seen to be 6.699mm. The deflection obtained in the experiment for sinusoidal and triangle specimen with corrugation thickness 0.5 mm and 0.75mm thick square and triangle corrugated specimen are in good agreement with the analysis result.
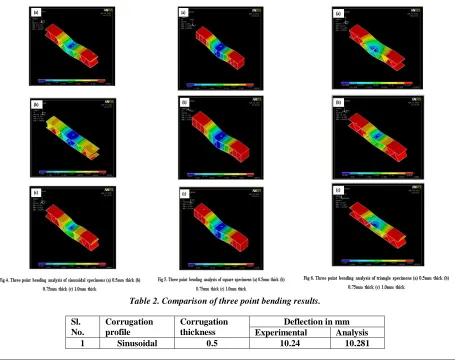
Fig 4 shows the bending pattern of the sinusoidal specimens. The analysis was done using Ansys, as it can be seen that the specimen deforms at the centre where the load is applied. The maximum deformation occurs at the center and reduces towards the supports and the upper face sheet is seen to deform more as compared to the lower face sheet. For the 0.5mm thick sinusoidal specimen, shown in 4(a) the deflection is 10.281mm when the applied load is equal to 564.56 N, the 0.75mm thick specimen shown in 4(b) shows a deflection of 2.255mm when the applied load is 540.53 N and the 1.0mm thick specimen shown in 4(c) shows a deflection of 6.123mm for the applied load of 1442.36 N.
Fig 5 shows the bending pattern of the square specimens. It can be seen that the specimen deforms at the centre where the load is applied, similar to that of sinusoidal specimen. The maximum deformation occurs at the center and reduces towards the supports and the upper face sheet is seen to deform more as compared to the lower face sheet. For the 0.5mm thick square specimen, shown in 5(a) the deflection is 6.699mm when the applied load is equal to 515.221 N, the 0.75mm thick specimen shown in 5(b) shows a deflection of 5.633mm when the applied load is 707.49 N and the 1.0mm thick specimen shown in 5(c) shows a deflection of 5.013mm for the applied load of 1018.572 N.
For the 0.5mm thick triangle specimen shown in 6(a) the deflection is 11.87mm when the applied load is equal to 551.224N, the 0.75mm thick specimen shown in 6(b) shows a deflection of 4.598mm when the applied load is 855.53 N and the 1.0mm thick specimen shown in 6(c) shows a deflection of 2.923mm for the applied load of 1327.293 N.
CONCLUSION
In the load–deflection curves of three point bending of polymer sandwich corrugated core, there is a peak value, followed by a decrement of the load that remains almost constant until the complete failure. The load decreases sharply after the end of the elastic region due to failure initiation in the sandwich composites. Some of the samples show complete fracture, whereas others show a plateau region after this sharp decrease in the load. It is observed from the results that Sinusoidal & triangular core sandwich gives minimum deflection. It is also noticed that experimental results are in good agreement with the finite element analysis.
REFERENCES
1. Elfetori, F. Abdewi, S. Sulaiman, A.M.S. Hamouda and E. Mahdi, Effect of geometry on the crushing behaviour of laminated corrugated composite tubes, Journal of Materials Processing Technology, vol. 172, (2006), pp.394–399. 2. Wang Dongmei, Cushioning properties of multi-layer corrugated sandwich structures, Journal of Sandwich Structures
and Materials, vol. 11: 57, (2009), pp.56 – 66.
3. L. Torre and J.M. Kenny, Impact testing and simulation of composite sandwich structures for civil transportation, Composite Structures, vol. 50, (2000), pp.257 – 267.
4. T. J. LU, C. CHEN and G. ZHU. Compressive Behaviour of corrugated Board Panels, Journal of Composite Materials, vol. 35: 2098, (2001), pp.2097 – 2126.
5. Tomas Nordstrand, Analysis and testing of corrugatedboardpanels into the post-buckling regime, Composite Structures, vol. 63, Issue 2, (2004), pp.189–199.
6. Enrico Armentain, Francesco Caputo and Reato Esposito, FE Analyses of Stability of Single and Double Corrugated Boards, ICAD-2006, vol. 43, (2006), pp.1 – 7.
7. M. Winkler and G. Kress, Deformation limits for corrugated cross-ply laminates, Composite Structures, vol. 92, (2010), pp.1458–1468.
8. Matthew Kampner and Joachim L. Grenestedt, On using corrugated skins to carry shear in sandwich beams, Composite Structures, vol. 85, (2008), pp.139–148.
9. E.E Gdoutos1 and I.M. Daniel. Failure mechanisms of composite sandwich structures.
10. Stanislaw Ochelski and Pawel Gotowicki, Experimental assessment of energy absorption capability of carbon-epoxy and glass-epoxy composites, Composite Structures, vol. 87, (2009), pp.215–224.
11. Peter H. Bull Damage tolerance and residual strength of composite sandwich structures. TRITA-AVE.2004:16, vol. ISBN 91-7283-772-1, (2004), pp.1-29.