Volume 4, Issue 3, 2017
238
Available online at www.ijiere.com
International Journal of Innovative and Emerging
Research in Engineering
e-ISSN: 2394 - 3343 p-ISSN: 2394 - 5494
CONVERTING NON CONDUCTING POLYMER INTO
CONDUCTING POLYMER FOR WEARABLE SENSOR
G.Vijayakumari
1, S.Satheesh Kumar
21Assistant Professor, Electronics and Communication Engineering, EBET Group of Institutions, Tiruppur, India 2Assistant Professor, Civil Engineering, EBET Group of Institutions, Tiruppur, India
e-mail: [email protected]
ABSTRACT:
Copper, Silver and Nickel nanoparticles are prepared by various chemical route and biological method and the nanoparticles are characterized by various techniques. The various Characterization techniques are Atomic Force Microscopy, Scanning Electron Microscopy, X-Ray diffraction Spectrometer, FTIR spectrum, UV-Vis Absorption Spectrum. The copper nanoparticles are prepared by both Polyol method and biological methods and particles are characterized. Compared to polyol method the biological method shows that the uniform distribution of the particles and also oxidation of that particle is reduced. Particle sizes are calculated by using XRD data as ~91nm. Among these two methods the best method for Copper nanoparticles preparation was biological method. The Nickel nanoparticles are prepared by polyol method and wet chemical solution method. The wet chemical solution shows that the there is no agglomeration of that particles and also uniform distribution of the particles are achieved. The particle size of the Nickel nanoparticles was calculated by using XRD data as 12.6nm. Among these two methods the best method for Nickel nanoparticles preparation was Wet chemical Solution method. Silver nanoparticles are prepared from coriander leaf extract by biological reduction method and the nanoparticles are characterized. The electrical conductivity of the polymer was improved by impregnating metal nanoparticles by Sonochemical method. Electrical conductivity of the polymer is measured by using four probe techniques. Then the insulating polymer foam was synthesized by prepared conducting polymer. This conducting foam is used to sense the physiological signal. The polymer foam prepared by using this method is used to increase the sensitivity of the pressure sensor. The conducting foam shows that the linear relationship between the conductance and stress applied. This conducting polymer foam is used for fabricating the wearable sensor.
Keywords: Electrical Conductivity, Nanoparticles, Polymer Foam, Pressure sensor, Wearable Sensor
I.INTRODUCTION
One of the emerging new tendencies for healthcare monitoring systems is rising from areas relatively far away from the traditionally involved technologies. Nowadays, a new generation of monitoring devices based on the growth of the knowledge derived from the past research experience and on the use of textile multi sensing interfaces is rising. The systems have to combine the advances of telecommunication, microelectronics and material science to guarantee a continuously remote monitoring of multiple physiological functions, as well as comfort and wearability.
The spotlight is shifting from external environment control to human oriented systems, where the subject-actor is constantly virtually linked and interactive. This tendency is changing dramatically the common life style, as well as the needs of people. The interaction between physician and patient is growing in quality and the contribution is coming from both sides. New systems designed to be minimally invasive, based on flexible and smart technologies conformable to the human body are conceived to improve the autonomy and the quality of life of patients. They are also cost-effective in providing around-the-clock assistance, in helping physicians to monitor cardiac patients during rehabilitation phase, in decreasing hospitalization time [2] (Domenico Zito et al 2008). The system can also assist professional workers subject to considerable physical and psychological stress and/or environmental and professional health risks.
Volume 4, Issue 3, 2017
239 the electrical conductivity is required to dissipate the charges. But the monomer of the conducting material has to be chemically modified with a substituent or usually a large organic dopant to improve the process ability of these materials. So the conducting material shows a drift in conductivity of the conducting foam over time[6][3] (Sarah Brady et al 2007; King-Tong Lau et al 2008,). This problem can be overcome by coating non conducting polymer with different metal nanoparticles and thereby enhancing the conducting properties which in turn increasing the sensitivity of the wearable sensor.
The need for cheaper, faster, and more accurate measurements has been a driving force for the development of new wearable sensing devices [4](Liming Dai et al 2002). This paper aims at developing pressure-sensitive foam and its application in wearable sensing. The pressure sensitive foam was prepared by coating non-conducting polymer with metal nanoparticles and thereby enhancing the sensing properties. The use of this novel smart foam is attractive for wearable sensing due to the sensor’s retention of desirable mechanical properties similar to those exhibited by textile structures.
II.EXPERIMENTAL A. Materials
The chemicals, used in this work were all research grade. Double distilled water was used throughout the study. B. Synthesis of Nickel Nanoparticles using Wet Chemical Solution Method
Spherical nickel-metal nanoparticles are prepared by the thermal decomposition of Ni-hydrazine complexes and subsequent reduction of Ni ions. First, nickel acetate (0.1mol) aqueous solution was heated to 50 ºC and then hydrazine (N2H4 .H2O, 0.25mol) was added to the solution with vigorous stirring. The solution was then heated to 65 ºC, which results in light violet precipitate. When the solution was cooled to 50 ºC, an aqueous solution of sodium-hydroxide (0.3mol) was added to it. To obtain the spherical nanoparticles, the solution was again heated to 55 ºC and remained for 1hr [8] (Z. Libor et al 2009).
C. Synthesis of Silver nanoparticles using Biological Reduction Method
A 20g of home-grown Coriandum Sativum fresh leaves were washed thoroughly with double distilled water (DDW) and added to 100 ml of boiled sterile DDW for 5 minutes and filtered. The extract was stored at 40C for further experiments. The filtrate is used as reducing and stabilising agent for 1 mM of AgNO3 (AgNo3, 99.99%, Sigma-Aldrich). In a typical synthesis of silver (Ag) nanoparticles the leaf extract (1.5 ml) was added to 30 ml of 10−3 M AgNO3 (99.99%) aqueous solution and kept at 330C. The experiment was done in triplicate for reproducibility. After 10 minutes the colour of the solution changed from colorless to yellow indicating the formation of Ag nanoparticles. The bio-reduced Ag Nanoparticles solution was collected and monitored by periodic sampling of aliquots (5 ml) of aqueous component and measuring UV-visible spectra of the solution. The nanoparticles solution was diluted to 10 times with MilliporeTM water to
avoid errors due to high optical density of the solution.
D. Synthesis of Copper nanoparticles a. Using Polyol Method
Copper nano particles have been prepared by Polyol method [10] using the metal precursor i.e. copper acetate and ethylene glycol. 4 gram of Copper acetate was ground to a fine powder & mixed with 150ml of ethylene glycol and subsequently bringing the resultant mixture to refluxing temperature generally between 120ºC to 200ºC for 1 to 3 hours. During this reaction time metallic powder is precipitated out of the mixture. The metal – glycol mixture was cooled to room temperature, filtered and the collected precipitate was dried in air.
b. Using Biological Method
Step 1: Dissolve 7g of Copper Sulphate in 100ml of distilled water.
Step 2: 24g of Potassium Hydroxide and 34.6g of Sodium Potassium Tartarate in 100ml of distilled water. Just prior to use mix both solutions.
Volume 4, Issue 3, 2017
240 E. Converting Non Conducting Polymer into Conducting Polymer
PMMA Blend with Ni Nanoparticles:
The PMMA/Ni nanocomposite was prepared by in-situ chemical oxidation polymerization of Methylmethacrylate monomer in the presence of nickel nanoparticles. In a typical synthesis process, 10ml Chloroform and 5ml Methylmethacrylate was added to the previously prepared nickel nanoparticles (0.2g, 0.25g, 0.3g), followed by addition of the 0.1g of Benzoylperoxide. The mixture was allowed to react for 4h under constant stirring at 50-60OC. Then the resulting solution was then transferred into a glass plate and kept it 30min for solvent evaporation using solvent casting method [1] (Arup Choudhury 2009). The PMMA/Ni nanocomposites are obtained.
PMMA Blend with Silver Nanoparticles:
The PMMA/Ag nanocomposite was prepared by in-situ chemical oxidation polymerization of Methylmethacrylate monomer in the presence of silver nanoparticles. In a typical synthesis process, 10ml Chloroform and 5ml Methylmethacrylate was added to the previously prepared Ag nanoparticles (0.2g, 0.25g, 0.3g), followed by addition of the 0.1g of Benzoylperoxide. The mixture was allowed to react for 4h under constant stirring at 50-60OC. Then the resulting solution was then transferred into a glass plate and kept it 30min for solvent evaporation using solvent casting method. The PMMA/Ag nanocomposites are obtained. Solvent casting method is one of the easiest methods for the preparation of polymer nanocomposites. It needs simple equipment and is less time consuming.
PMMA Blend With Copper Nanoparticles:
The PMMA/Cu nanocomposite was prepared by in-situ chemical oxidation polymerization of methylmethaacrylate monomer in the presence of Copper nanoparticles. In a typical synthesis process, 5ml of methylmethaacrylate mixed with 10ml of chloroform was added to the previously prepared copper nanoparticles with various compositions like 0.2g, 0.25g and 0.3g followed by addition of the Benzoyl peroxide. The mixture was allowed to react for 12h under constant stirring at 1–2 ◦C. Then the resulting viscous syrup was then transferred into a glass plate and kept it 30min for solvent evaporation using solvent casting method. The PMMA/Cu nanocomposite films were obtained.
F. Characterization
The X-ray diffraction (XRD) patterns of metal nanoparticles were obtained at ambient temperature by step scanning on an X-ray powder diffractometer (Xpert-Pro) using a monochromatic CuKα radiation (λ=1.54056 Å) in the range of 2 =5°-70° with a step size of 0.05°. A Fourier Transform Infrared Spectrophotometer (FT-IR) analysis was performed on spectrophotometer (Bruker Optics, Germany). The surface morphology of the nanorods was scanned by scanning electron microscopy (SEM, HITACHI SU1510, Japan) at an accelerating voltage of 6 & 10KV.
III. RESULTS AND DISCUSSION
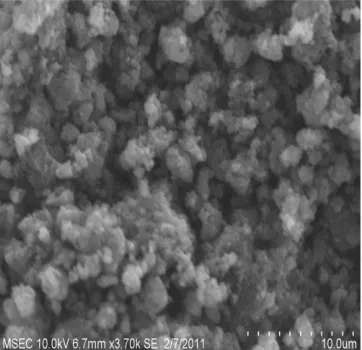
A. SEM Results
Volume 4, Issue 3, 2017
241
Figure 1. SEM Image of Silver Nanoparticles Figure 2. SEM Image of Nickel Nanoparticles
Figure 3a SEM Image of Cu Nanoparticles Figure 3b SEM Image of Cu Nanoparticles by Polyol Method Biological method.
Figure 4. SEM Image of PMMA/Ag Figure 5. SEM Image of PMMA/Ni
Volume 4, Issue 3, 2017
242
Figure 6 SEM Image of PMMA/Cu Nanocomposites.
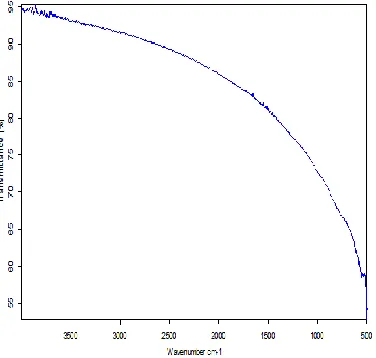
B. FTIR Results for Metal Nano Particles
Fourier transform infrared spectroscopy (FTIR, Bruker IFS 66V/S) was used to study the chemical affinity of PMMA segments towards the surface of these nanoparticles. The Infrared Spectra of the Silver, Nickel and Copper nanoparticles are shown in the Figure 7, Figure 8 and Figure 9 respectively. The FTIR spectrum indicates that the functional group present in the metal nanoparticles. Figure clearly shows that the there is no IR peak absorbed in nickel nanoparticles prepared by wet chemical solution method. The IR Spectra of Silver nanoparticles also clearly shows that the there is no functional group present in that metal nanoparticles. From that the FTIR Spectrum of these metal nanoparticles was clearly explained that there is no functional group for metal nanoparticles. The metal nanoparticle has no functional group which was confirmed by the FTIR Spectrum and the result of the copper nanoparticles was shown in the Figure 9.
Volume 4, Issue 3, 2017
243 Figure 9 FTIR Spectrum of Copper Nanoparticles
C. FTIR Results for Polymer Metal Nanocomposites
Figure 10a shows the FTIR spectrum of PMMA film. The FTIR spectrum of PMMA indicates the details of functional groups present in the synthesized PMMA. A sharp intense peak at 1731cm-1 appeared due to the presence of ester carbonyl group stretching vibration. The broad peak ranging from 1260-1000cm-1 can be explained owing to the C-O (ester bond) stretching vibration. The broad band from 950-650cm-1 is due to the bending of C-H. The broad peak ranging from 3100-2900 cm-1 is due to the presence of stretching vibration. Figure 10b shows that the FTIR spectra of PMMA metal composites are almost identical with no noticeable shifts in the positions of the lines, indicating a non-wetting polymer – particle interfacial Surface.
Volume 4, Issue 3, 2017
244 Figure 10b FTIR Spectrum of PMMA/Metal Nanocomposites
D. XRD Results
XRD data of Silver nanoparticles are shown in the Figure 11. A typical XRD pattern was obtained and the pattern consists of distinct peaks at corresponding 2θ values of 38.12, 44.31, 64.45 and 77.4. These values reveal that it is a face centered cubic (fcc) structure. The discernible peaks can be indexed to (111), (200), (220) and (311) planes of a cubic unit cell, which corresponds to the cubic structure of silver (JCPDS card No. 89-3722) [5] (Li-Ping Jiang et al 2004). Crystallite size calculations were carried out from the peak broadening using Debye-Scherrer formula that resulted in crystallite sizes ranging between 80nm.
Figure 11.XRD Pattern for Ag Nanoparticles Figure 12.XRD Pattern for Ni Nanoparticles
Figure 12 shows the XRD patterns of spherical Ni nanoparticles. Three characteristic peaks for nickel (2θ = 44.5º, 51.8º, and 76.4º), corresponding to Miller indices (111), (200), and (222), were observed. The intensity of these peaks increases with the increase of Ni nanoparticles size [7] (Shlomo Magdassi et al 2010). The appearance of those peaks reveal that the resultant particles are pure face-centered cubic (fcc) nickel at these samples (JCPDS, No. 04-0850). The XRD patterns revealed only nickel. The size of these samples was calculated to be 34nm by Scherrer’s formula.
Figure 13 shows the XRD pattern of Copper nanoparticles. The peak positions are consistent with metallic copper. Sharp peaks of the copper are observed which indicates the crystalline nature of the product. The diffraction peaks at 43.5º,
Position [°2Theta]
20 30 40 50 60 70
Counts
0 1000 2000
Volume 4, Issue 3, 2017
245 50.7º and 74.5º correspond to the formation of metallic copper. The relative peak intensities and the position of diffraction peaks in the XRD pattern were very similar to those reported in the JCPDS card No. 04-0836. The diffraction features were consistent with the face-centered cubic (fcc) crystalline structures of bulk metallic copper, with the two brightest rings corresponding to the diffraction planes of (111) and (220). The size of the samples was calculated to be 91nm by Scherrer’s formula.
Figure 13 XRD pattern for Cu nanoparticles
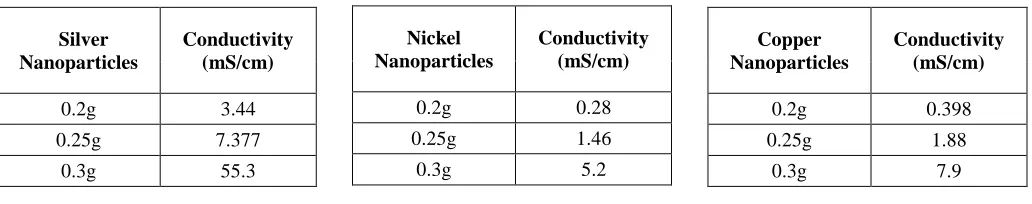
E. Four Point Probe Results:
The Conductivity value for PMMA Metal Nanocomposites was investigated using Four Point Probe Method. Electrical conductivity of dielectric polymer was increased by increasing the Metal concentrations [1](Arup Choudhury 2009). Table 1 was clearly shows that the conductivity results of PMMA with Silver nanoparticles. Silver nanoparticles have the high conductivity when compared to other metal nanoparticles. The conductivity value of the PMMA/Ag nanocomposites was in the range of mS/cm.
Table 1. Four Point Probe Results for Polymer Metal Nanocomposites
IV CONCLUSIONS
In this work, synthesis of metal nanoparticles was in the range of 50-250nm and the prepared metal nanoparticles were used to convert the dielectric polymer into conducting polymer. The electrical conductivity was investigated using Four-Point Probe Techniques and the conductivity value of the Polymer Metal nanocomposites was in the range of mS/cm. The conductivity of the dielectric polymer was found to be increased with the increasing metal concentration. Based on the result the prepared nanocomposites can be used to convert the insulating foam into conductive one which can be used to fabricate wearable sensors for physiological (Breath Rate, Limb Movement, etc.,) monitoring.
Acknowledgements
The authors would like to thank the Management and the Principal for their constant encouragement and support. Silver
Nanoparticles
Conductivity (mS/cm)
0.2g 3.44
0.25g 7.377
0.3g 55.3
Nickel Nanoparticles
Conductivity (mS/cm)
0.2g 0.28
0.25g 1.46
0.3g 5.2
Copper Nanoparticles
Conductivity (mS/cm)
0.2g 0.398
0.25g 1.88
Volume 4, Issue 3, 2017
246 References:
[1] Arup Choudhury, ‘Sensors and Actuators’ B 138 (2009) 318–325.
[2] Domenico Zito, Domenico Pepe, Bruno Neri, Fabio Zito, Danilo De Rossi, Antonio Lanata, ‘International Journal of Telemedicine and Applications’, Vol No. 328597, Page No. 1 – 10, (2008).
[3] King-Tong Lau, ‘ Journal of Sensors and Actuators a – Physical’ , Vol No. 119, Issue No.2, Page No. 398-404, (2008). [4] Liming Dai, Prabhu Soundarrajan, and Taehyung Kim, ‘ Journal of Pure Appl. Chem.,’, Vol No. 74, Issue No. 9, Page
No. 1753–1772,(2002).
[5] Li-Ping Jiang, An-Ning Wang, Yu Zhao, Jian-Rong Zhang, Jun-Jie Zhu, ‘Inorganic Chemistry Communications’ 7 (2004) 506–509.
[6] Sarah Brady, Brian Carson, Donal O'Gorman, Niall Moyna, and Dermot Diamond, ‘Journal of Communications ’, Vol No. 2, Issue No. 5, (2007).
[7] Shlomo Magdassi , Michael Grouchko and Alexander Kamyshny, ‘Materials 2010, 3, 4626-4638; doi:10.3390/ma3094626’
[8] Z. Libor et al, ‘ Journal of Materials Chemistry and Physics’, Vol No.114, Issue No. 2-3, Page No. 902-907,(2009).