R E S E A R C H A R T I C L E
Open Access
Multivariate modeling to identify patterns in
clinical data: the example of chest pain
Oliver Hirsch
1*, Stefan Bösner
1, Eyke Hüllermeier
2, Robin Senge
2, Krzysztof Dembczynski
2and
Norbert Donner-Banzhoff
1Abstract
Background:In chest pain, physicians are confronted with numerous interrelationships between symptoms and with evidence for or against classifying a patient into different diagnostic categories. The aim of our study was to find natural groups of patients on the basis of risk factors, history and clinical examination data which should then be validated with patients’ final diagnoses.
Methods:We conducted a cross-sectional diagnostic study in 74 primary care practices to establish the validity of symptoms and findings for the diagnosis of coronary heart disease. A total of 1199 patients above age 35 presenting with chest pain were included in the study. General practitioners took a standardized history and performed a physical examination. They also recorded their preliminary diagnoses, investigations and management related to the patient’s chest pain. We used multiple correspondence analysis (MCA) to examine associations on variable level, and multidimensional scaling (MDS), k-means and fuzzy cluster analyses to search for subgroups on patient level. We further used heatmaps to graphically illustrate the results.
Results:A multiple correspondence analysis supported our data collection strategy on variable level. Six factors emerged from this analysis:„chest wall syndrome“,„vital threat“, „stomach and bowel pain“,„angina pectoris“, „chest infection syndrome“, and„ self-limiting chest pain“. MDS, k-means and fuzzy cluster analysis on patient level were not able to find distinct groups. The resulting cluster solutions were not interpretable and had insufficient statistical quality criteria.
Conclusions:Chest pain is a heterogeneous clinical category with no coherent associations between signs and symptoms on patient level.
Background
People rarely experience one symptom in isolation. Physicians are confronted with numerous interrelation-ships between symptoms and with evidence for or against classifying a patient into a diagnostic category. They cate-gorize patients with regard to diagnosis, prognosis, and/ or further management. Therefore, finding groups in patient data is important in several respects. One might identify subgroups of patients who can benefit from dif-ferent interventions. Certain symptom configurations might be a cue for further investigations [1]. Diagnostic categories have developed over time, by tradition or by gaining pathophysiological insights. Feedback about the
adequacy of such categories often occurs on the indivi-dual patient level and is therefore non-systematic. We rarely found systematic studies which successfully applied multivariate models to information available to clinicians. Therefore, it might be worthwhile to model clinicians’ decision making by multivariate techniques.
Coronary heart disease (CHD) is one of the main under-lying aetiologies for chest pain in primary care [2]. Primary care practitioners start the diagnostic process with the his-tory and physical examination [3] and order further exam-inations like as needed [4]. Physicians hereby combine the information gained from the above diagnostic tests [3,5].
Statistical measures for grouping variables or patients have rarely been applied to chest pain data, mostly in con-nection with finding subgroups in acute coronary heart disease. We only found one study in chest pain which per-formed a k-means cluster analysis on variable level to
* Correspondence: [email protected]
1
Department of General Practice/Family Medicine, Philipps University Marburg, Germany
Full list of author information is available at the end of the article
determine whether there are characteristic patterns in chest pain locations described by patients [6]. The group-ing of four different chest pain locations on variable level were not helpful in differentiating between patients with an acute coronary syndrome (ACS) and patients with non-cardiac chest pain. Studies with patients with confirmed cardiac diagnoses were also not able to find characteristic symptom patterns within these diagnostic groups by using cluster analytic techniques [1,7-9].
We intended to use statistical methods to identify nat-ural groups of patients with chest pain on the basis of a larger, comprehensive data set with information on his-tory, risk factors, and physical examination [10,11]. These groups should then be validated with patients’diagnoses in order to see if they have predictive power. The applied multivariate techniques enable us to handle a large amount of data in order to unfold hidden patterns. This strategy was not followed previously in other studies.
Patients were enrolled consecutively in a primary care setting so that patient recruitment was not distorted by referral patterns. This could have been the case if we had included specialized physicians (e.g. cardiologists) who get a selection of patients referred to them by primary care doctors.
Methods
We conducted a cross-sectional diagnostic study in a pri-mary care setting [12] with the pripri-mary aim to establish the validity of symptoms and findings for the diagnosis of coronary heart disease [10,11]. The study protocol was approved by the ethics committee of the Faculty of Medi-cine, University of Marburg. The study complies with the Declaration of Helsinki. Here, we present a secondary ana-lysis to find natural groups in our data.
Participating GPs and patients
We approached 209 general practitioners (GPs) in the Land of Hesse of whom 74 (35.4%) agreed to participate in the study. Participating practices had to recruit consecu-tively every attending patient who had chest pain. The recruitment period lasted 12 weeks for each practice.
Every patient above 35 years with chest pain was to be included. Patients were eligible irrespective of the acute or chronic nature of their complaint, or of previously known conditions including CHD or risk factors. Patients whose chest pain had subsided for more than one month, whose chest pain had been investigated already and/or who came for follow-up for chest pain were excluded. This resulted in a total of 1199 patients.
Data collection
The data collection strategy was based on the current literature on chest pain and on feedback by GPs [13]. The GPs took a standardized history and performed a
physical examination. They also recorded their prelimin-ary diagnoses, investigations and management related to the patient’s chest pain. Patients were contacted by phone six weeks and six months after the index consul-tation. Study assistants blinded to clinical data already recorded asked about the course of their chest pain, treatments including hospitalisations and drugs. Dis-charge letters from specialists and hospitals were requested from GPs.
Random audits were performed searching routine docu-mentation of participating practices to identify cases of chest pain not included in the study.
After 6 months a reference panel consisting of one car-diologist, one GP and one research staff of the department of General Practice/Family Medicine decided about the presumed diagnosis at the time of patient recruitment on the basis of the GP’s documentation and follow up data.
Statistical Methods
For statistical grouping techniques like cluster analysis it is important that the underlying constructs are reliably mea-sured and relevant variables are included in the analyses [14]. Consequently, we first examined whether the content of our case report form was capable of capturing relevant aspects associated with chest pain. A conventional factor analysis was not feasible because of the binary scaling of our data. Therefore, we performed a multiple correspon-dence analysis (MCA) on variable level with all variables of our case report form. We only excluded those variables with extremely skewed distributions. MCA is an explora-tory method which performs cross tabulations of all included nonmetric variables [15]. A virtually unlimited number of variables can be included in this analysis. All variables in a data set can be related to each other without differentiation between descriptive and explanatory vari-ables. In contrast to other multivariate measures, MCA does not require large sample sizes and can even be calcu-lated with n = 10 [16]. Recently, MCA was considered being a useful tool to uncover the relationships among categorical variables [17]. We chose the factor analytic interpretation of MCA because of our high number of variables. Calculations were done using ALMO 12 (http:// www.almo-statistik.de).
Based on the results of MCA, we applied two visuali-zation techniques in order to get a first idea of any spe-cific structure in the data, notably in terms of a natural clustering into subgroups. We used multidimensional scaling (MDS) and hierarchical clustering combined with a so-called heat map representation. Both techni-ques are implemented in the R package stats (http:// www.R-project.org).
preserve the pairwise distances between these observa-tions as far as possible (formally, the problem is stated as minimizing the sum of squared differences between the original dissimilarities and the Euclidian distances in the low-dimensional space). Thus, MDS only requires dissimilarities between observations as input. If data are given as multidimensional vectors, the dissimilarities can be computed as Euclidean distances between these vec-tors. If natural clusters exist within the data, these clus-ters should also become visible in the low-dimensional representation of the data [18].
A heat map represents the pairwise distance (similarity) matrix in terms of an image, with distance (similarity) degrees indicated by colours (similarities can be computed as reciprocals of the Euclidean distance between observa-tions): The darker the colour, the more similar the obser-vations are. Prior to printing the image, the sequence of observations is reordered in such a way that similar obser-vations tend to be neighboured. More specifically, this reordering is determined by means of a hierarchical clus-tering of the data, and the corresponding dendrogram is added to the left and to the top side of the image. Since the similarity matrix is symmetric, both dendrograms are the same, and the image itself is symmetric, too. Clusters within the data become visible as“warm-shaded squares” along the diagonal of the heat map.
In a next step, we performed k-means cluster analyses on patient level, generalized to all scales of measurement with weighted squared euclidean distances [19,20]. The k-means procedure identifies relatively homogenous sub-groups while maximizing the variability between clusters and is able to handle larger amounts of classification vari-ables. Variables with mixed scaling can be handled in this approach [19,21,22]. Calculations were done with ALMO 12 which includes a k-means algorithm that is able to han-dle the different scaling of our variables and the large sam-ple size. Schendera [21] states that a samsam-ple size of n = 250 is too large for some cluster analysis algorithms. This programme provides statistical measures to evaluate the appropriate number of clusters and the model fit. For this, an F value and eta2for each cluster solution is calculated that indicate the contribution of the classification variables to the separation of the clusters. One may then choose the solution with the highest F value and largest explained var-iance (eta2). If this solution is not reasonably interpretable with regards to content, then it is admissible to choose another solution [19].
To account for a possible fuzziness in our data, we additionally undertook fuzzy cluster analyses with the programme NCSS2007 (http://www.ncss.com) [14]. In common cluster analysis, each patient is assigned to only one cluster. In fuzzy clustering, a patient can be partially classified into more than one cluster. Goodness
of fit of a fuzzy clustering solution can be assessed by the normalized Dunn partition coefficient Fc(U) that ranges from 0 (completely fuzzy) to 1 (hard clustering) and by the coefficient Dc(U) which ranges from 0 (hard clustering) to 1-(1/K) (completely fuzzy), where K is the number of clusters. The number of clusters should be chosen so that Fc(U) is large and Dc(U) is small [14,23]. Another goodness of fit indicator is the average silhou-ette per cluster. It ranges from -1 to +1. An average sil-houette from 0.71 to 1.00 denotes that a strong structure has been found, an average silhouette from 0.51 to 0.70 indicates a reasonable structure, a value from 0.26 to 0.50 means that the structure is weak and could be artificial, and a value from 0.25 to -1 refers to no substantial structure [23].
Results
Multiple correspondence analysis (MCA) and Multidimensional scaling (MDS)
At first, by applying multiple correspondence analysis (MCA), we explored if the variables on our case report form capture relevant aspects of chest pain. We used the oblique quartimin rotation to enhance interpretability of the results. Six factors emerged from the analysis. The highest correlation between these factors is -.36 so that these factors can be regarded as being orthogonal. The eigenvalues of the six factors range from 2.08 to 3.72. The total explained variance is 24.8%. The explained variance gives a too pessimistic picture about model fit. Conse-quently, the fit index GFIR is recommended [19] which indicates, how many percent of the total c2 value is explained by the six factors. In our case, the GFIR shows that 57.5% of the totalc2value is explained by the six fac-tors. This is a satisfactory result.
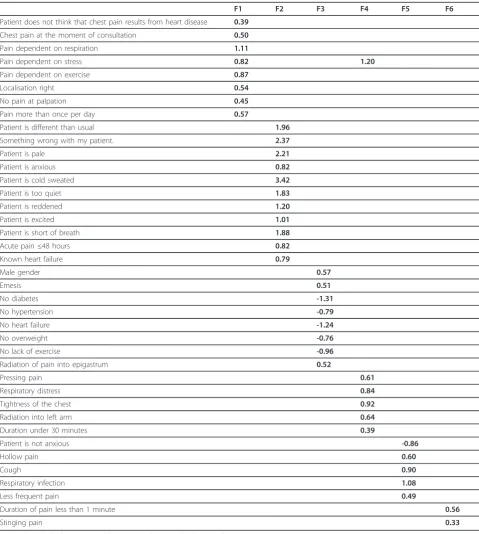
Table 1 lists the main results of the loading matrix that resulted from quartimin rotation. Values larger than one can occur because numbers represent coordi-nate points and not correlations as known from factor analysis. There are no standards to classify these load-ings. They have to be put in relation to the highest loadings on each factor in order to interpret their meaning.
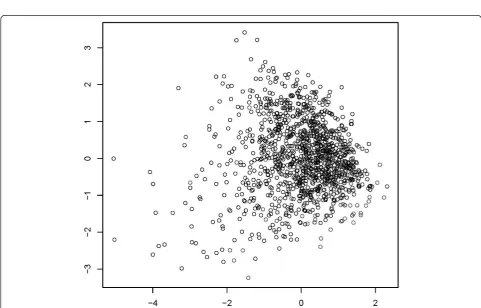
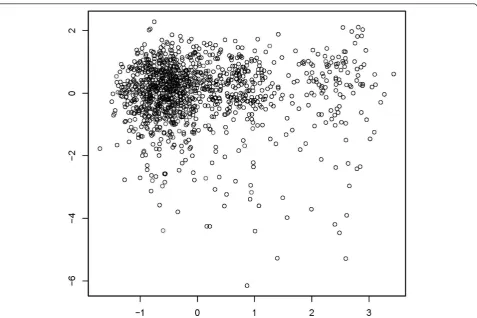
Figure 1 shows a visualization of the data points in two-dimensional space. First, we show data points in the coordinate system consisting of the first two factors obtained by MCA. Next, we show the result of a multi-dimensional scaling of the MCA factors to the two-dimensional plane. We used 6 and 20 factors,
respectively, to compute dissimilarities (Figures 2 and 3). Obviously, a pronounced clustering structure within the data cannot be observed.
We also present heat maps based on the pairwise similarities between data points, using 6 and 20 factors from MCA (Figures 4 and 5). Like in the case of MDS,
Table 1 Loading matrix after quartimin rotation of MCA data
F1 F2 F3 F4 F5 F6
Patient does not think that chest pain results from heart disease 0.39
Chest pain at the moment of consultation 0.50
Pain dependent on respiration 1.11
Pain dependent on stress 0.82 1.20
Pain dependent on exercise 0.87
Localisation right 0.54
No pain at palpation 0.45
Pain more than once per day 0.57
Patient is different than usual 1.96
Something wrong with my patient. 2.37
Patient is pale 2.21
Patient is anxious 0.82
Patient is cold sweated 3.42
Patient is too quiet 1.83
Patient is reddened 1.20
Patient is excited 1.01
Patient is short of breath 1.88
Acute pain≤48 hours 0.82
Known heart failure 0.79
Male gender 0.57
Emesis 0.51
No diabetes -1.31
No hypertension -0.79
No heart failure -1.24
No overweight -0.76
No lack of exercise -0.96
Radiation of pain into epigastrum 0.52
Pressing pain 0.61
Respiratory distress 0.84
Tightness of the chest 0.92
Radiation into left arm 0.64
Duration under 30 minutes 0.39
Patient is not anxious -0.86
Hollow pain 0.60
Cough 0.90
Respiratory infection 1.08
Less frequent pain 0.49
Duration of pain less than 1 minute 0.56
Stinging pain 0.33
Figure 1Graphical depiction of multidimensional scaling of a two factor solution in multiple correspondence analysis.
we were not able to observe any natural cluster struc-ture in the data.
Cluster analysis
A k-means cluster analysis on patient level with all variables of our case report form resulted in a three cluster solution with a small F value of 46.8 and an eta2 of .073. This solution was not interpretable and had only 7.3% explained variance. Other cluster solu-tions were also not interpretable because of worse quality criteria.
Cluster analysis is an iterative process [19,21]. Therefore we ran several analyses and excluded variables with no meaningful contribution. The criterion was an eta2smaller .10 as a contribution of a single variable to cluster forma-tion [24]. Even after the exclusion of irrelevant variables with regards to content and to statistical characteristics, the best quality criteria were reached at a four cluster solu-tion with a F value of 62.2 and an eta2of .135. This solu-tion was not interpretable and had only 13.5% explained variance. Again, other cluster solutions were also not interpretable because of worse quality criteria. The k-means approach was therefore not able to form meaning-ful patient groups in our data.
The best interpretable solution in fuzzy cluster analysis after excluding variables with no meaningful theoretical and numerical contribution consisted of four clusters. Cluster 1 (n = 221) can be characterized as“acute and/or threatening chest pain”, Cluster 2 (n = 402) as“subacute chest pain”, in Cluster 3 (n = 288), there are mainly women≧65 years of age with no acute chest pain, and in Cluster 4 (n = 288), there are mainly men≧55 years of age with no acute chest pain. The average silhouette of this solution was 0.54 which hardly denotes a reasonable structure in the data. The Fc(U) with .49 was low and the Dc(U) with .42 was relatively high and both indicated a high fuzziness in our data. We concluded that fuzzy clus-tering also was not able to partition patients into mean-ingful entities that have a statistical or clinical relevance.
cluster. Other cluster solutions with lower F values and higher number of clusters were also not clinically inter-pretable. The best statistical solution in fuzzy cluster analysis consisted of two clusters. The average silhouette of this solution was 0.25 which means that there was no substantial structure in the data. The Fc(U) with .50 was low and the Dc(U) with also .50 was relatively high and both again indicated a high fuzziness in our data. In this second order analysis, fuzzy clustering was not able to form patient groups that are interpretable on a statistical or clinical level.
Discussion
In our study, clinical data of patients with chest pain had an underlying structure on variable level but not on individual patient level. As a result, patients could not be grouped into clinically meaningful clusters by multi-variate analyses and therefore no validation against patients’final diagnoses was possible.
A multiple correspondence analysis (MCA) supported our data collection strategy on variable level. It showed
that relevant aspects were captured by the case report form. Six factors emerged from this analysis: „chest wall syndrome“, „vital threat“, „stomach and bowel pain“, „angina pectoris“,„chest infection syndrome“, and„ self-limiting chest pain“. Therefore, the clinical category chest pain had a meaningful underlying structure. MCA supported our measurement strategy.
However, k-means and fuzzy cluster analysis on patient level were not able to find distinct groups. The resulting cluster solutions were not interpretable and had insufficient statistical quality criteria. The absence of any pronounced cluster structure was also confirmed by multidimensional scaling (MDS) and heat map repre-sentations of the data.
Strengths of this study are the prospective design, a large and representative consecutive sample in a primary care setting not distorted by referral patterns, and small drop out rates. Study procedures, including random audits, reduced the possibility of selection bias, and an interdisciplinary team provided a precise diagnosis as reference standard.
Individual configurations of patients on our variables were widespread with no typical groupings. This conclu-sion is supported by Eslick [6] who performed a k-means cluster analysis on variable level to determine whether there are characteristic patterns in chest pain locations described by patients. He found four different chest pain locations (upper chest, central retrosternal, central chest, left chest, and left arm). These groupings on variable level were not helpful in differentiating between patients with an acute coronary syndrome (ACS) and patients with non-cardiac chest pain. He concluded that chest pain is a heterogeneous category with no coherent associations between different signs and symptoms. An advantage of our study, compared to Eslick, is the larger number of variables we were able to enter in our analyses.
Other studies using multivariate techniques were done with patients already given a cardiac diagnosis. Crichton and Hinde used multiple correspondence analysis to clas-sify patients with chest pain into those with high cardiac risk and those with low cardiac risk [25]. Correct
et al. [9] found three clusters in elderly patients with ischemic coronary heart disease: a typical group with severe ischemic pain, a weary group with fatigue, sleep disturbance, and shortness of breath, and a group with diffuse symptoms. The patients in the weary group were the most impaired. Except for the study of Eslick [6], all other studies recruited patients with established cardiac diagnoses and used a limited number (up to 20) of classi-fication variables. As was shown, studies with patients with established cardiac diagnoses did not find coherent symptom patterns. The study of Ryan et al. [8] has a comparable sample size to ours. They did not find a clus-ter of patients that included most of the typical symp-toms for acute myocardial infarction. This finding corroborates our central finding in chest pain data that no typical patient clusters emerged. All the other men-tioned studies have much smaller sample sizes so that the stability of their solutions might be reduced.
To our knowledge, ours is the first study to apply MCA and MDS to chest pain data and to use cluster analysis in such detail to search for patient groups in this area. We found an underlying structure of the construct chest pain on variable level but no structure on individual level. Per-haps we have not measured all relevant aspects but we consider this to be unlikely on the basis of previous stu-dies. We even recorded subjective impressions of physi-cians and patients in addition to objective medical data.
Conclusions
Chest pain seems to be a heterogeneous and multi-faceted clinical category that has no prototypical manifes-tations on patient level. This might be a disillusioning result because the physician is expected to construct a diagnosis on an individual level and to categorize whether the patient has a serious condition and needs special care or not. Nevertheless, it has to be emphasized that classification of patients into a diagnostic category is possible without finding natural groups in data [14]. This was demonstrated in another article of our research group [11]. Apart from a different statistical approach, several frameworks in human reasoning like case based reasoning [26], fuzzy reasoning [27], or fast and frugal heuristics [28] have been proposed to model the underly-ing cognitive processes in classification.
Acknowledgements
The work was supported by the German Federal Ministry of Education and Research (BMBF) [FKZ 01GK0401].
We thank all participating GPs for their cooperation, Muazzez Ilhan for study coordination and data management, and Prof. Dr. Kurt Holm for his helpful advice regarding the use of ALMO.
Author details
1
Department of General Practice/Family Medicine, Philipps University Marburg, Germany.2Department of Mathematics and Computer Science,
Knowledge Engineering & Bioinformatics, Philipps University Marburg, Germany.
Authors’contributions
OH developed the concept for data analysis, performed the statistical analyses, and drafted the manuscript. SB participated in the concept for data analyses, participated in performing the statistical analyses, and helped to draft the manuscript. EH developed the concept for data analysis, performed the statistical analyses, and helped to draft the manuscript. RS developed the concept for data analysis, performed the statistical analyses, and helped to draft the manuscript. KD developed the concept for data analysis, performed the statistical analyses, and helped to draft the manuscript. NDB participated in the study design and coordination, the rationale for the data analyses, and helped to draft the manuscript. All authors read and approved the final manuscript.
Competing interests
The authors declare that they have no competing interests.
Received: 6 July 2011 Accepted: 22 November 2011 Published: 22 November 2011
References
1. DeVon HA, Ryan CJ, Rankin SH, Cooper BA:Classifying subgroups of patients with symptoms of acute coronary syndromes: A cluster analysis.
Res Nurs Health2010,33(5):386-397.
2. Bösner S, Becker A, Haasenritter J, Abu Hani M, Keller H, Sönnichsen AC, Karatolios K, Schaefer JR, Seitz G, Baum E,et al:Chest pain in primary care: Epidemiology and pre-work-up probabilities.Eur J Gen Pract2009,
15(3):141-146.
3. Bösner S, Becker A, Abu Hani M, Keller H, Sonnichsen AC, Haasenritter J, Karatolios K, Schaefer JR, Baum E, Donner-Banzhoff N:Accuracy of symptoms and signs for coronary heart disease assessed in primary care.Br J Gen Pract2010,60(575):246-257.
4. Rutten FH, Kessels AG, Willems FF, Hoes AW:Electrocardiography in primary care; is it useful?Int J Cardiol2000,74(2-3):199-205. 5. Gill CJ, Sabin L, Schmid CH:Why clinicians are natural bayesians.BMJ
2005,330(7499):1080-1083.
6. Eslick GD:Usefulness of chest pain character and location as diagnostic indicators of an acute coronary syndrome.Am J Cardiol2005,
95(10):1228-1231.
7. Riegel B, Hanlon AL, McKinley S, Moser DK, Meischke H, Doering LV, Davidson P, Pelter MM, Dracup K:Differences in mortality in acute coronary syndrome symptom clusters.Am Heart J2010,159(3):392-398. 8. Ryan CJ, DeVon HA, Horne R, King KB, Milner K, Moser DK, Quinn JR,
Rosenfeld A, Hwang SY, Zerwic JJ:Symptom clusters in acute myocardial infarction: a secondary data analysis.Nurs Res2007,56(2):72-81. 9. Lindgren TG, Fukuoka Y, Rankin SH, Cooper BA, Carroll D, Munn YL:Cluster
analysis of elderly cardiac patients’prehospital symptomatology.Nurs Res2008,57(1):14-23.
10. Bosner S, Becker A, Abu Hani M, Keller H, Sonnichsen AC, Haasenritter J, Karatolios K, Schaefer JR, Baum E, Donner-Banzhoff N:Accuracy of symptoms and signs for coronary heart disease assessed in primary care.Br J Gen Pract2010,60(575):246-257.
11. Bosner S, Haasenritter J, Becker A, Karatolios K, Vaucher P, Gencer B, Herzig L, Heinzel-Gutenbrunner M, Schaefer JR, Abu Hani M,et al:Ruling out coronary artery disease in primary care: development and validation of a simple prediction rule.CMAJ2010,182(12):1295-1300.
12. Knottnerus JA, Muris JW:Assessment of the accuracy of diagnostic tests: the cross-sectional study.J Clin Epidemiol2003,56(11):1118-1128. 13. Bosner S, Becker A, Haasenritter J, Abu Hani M, Keller H, Sonnichsen AC,
Karatolios K, Schaefer JR, Seitz G, Baum E,et al:Chest pain in primary care: epidemiology and pre-work-up probabilities.Eur J Gen Pract2009,
15(3):141-146.
14. Kaufman L, Rousseeuw PJ:Finding groups in data. An introduction to cluster analysis.Hoboken: Wiley; 2005.
15. Greenacre M, Blasius J:Multiple Correspondence Analysis and Related Methods.London: Chapman & Hall; 2006.
17. Sourial N, Wolfson C, Zhu B, Quail J, Fletcher J, Karunananthan S, Bandeen-Roche K, Beland F, Bergman H:Correspondence analysis is a useful tool to uncover the relationships among categorical variables.J Clin Epidemiol
2010,63(6):638-646.
18. Cox TF, Cox MAA:Multidimensional Scaling.London: Chapman and Hall; 2001.
19. Bacher J, Pöge A, Wenzig K:Clusteranalyse. Anwendungsorientierte Einführung in Klassifikationsverfahren [Cluster analysis. Practical introduction in classification measures].Munich: Oldenbourg; 2010. 20. Everitt BS, Landau S, Leese M:Cluster analysis.London: Arnold; 2001. 21. Schendera CFG:Clusteranalyse mit SPSS: Mit Faktorenanalyse. [Cluster
analysis with SPSS: Including factor analysis].Munich: Oldenbourg; 2009. 22. Romesburg CH:Cluster analysis for researchers.North Carolina: Lulu Press;
2004.
23. Hintze JL:NCSS User’s guide IV.Kaysville, Utah: NCSS; 2007. 24. Jaccard J, Becker MA:Statistics for the behavioral sciences.Belmont:
Wadsworth; 2009.
25. Crichton NJ, Hinde JP:Correspondence analysis as a screening method for indicants for clinical diagnosis.Stat Med1989,8(11):1351-1362. 26. Salem ABM:Case based reasoning technology for medical diagnosis.
World Academy of Science, Engineering and Technology2007,31:9-13. 27. Seising R:From vagueness in medical thought to the foundations of
fuzzy reasoning in medical diagnosis.Artif Intell Med2006,38(3):237-256. 28. Gigerenzer G, Todd P, Group TAR:Simple heuristics that make us smart.
Oxford: Oxford University Press; 1999.
Pre-publication history
The pre-publication history for this paper can be accessed here: http://www.biomedcentral.com/1471-2288/11/155/prepub
doi:10.1186/1471-2288-11-155
Cite this article as:Hirschet al.:Multivariate modeling to identify patterns in clinical data: the example of chest pain.BMC Medical Research Methodology201111:155.
Submit your next manuscript to BioMed Central and take full advantage of:
• Convenient online submission
• Thorough peer review
• No space constraints or color figure charges
• Immediate publication on acceptance
• Inclusion in PubMed, CAS, Scopus and Google Scholar
• Research which is freely available for redistribution