for three occupational posture exposure
assessment methods
Trask
et al.
R E S E A R C H A R T I C L E
Open Access
Data collection costs in industrial environments
for three occupational posture exposure
assessment methods
Catherine Trask
1,2*, Svend Erik Mathiassen
1, Jens Wahlström
1,3, Marina Heiden
1and Mahmoud Rezagholi
1Abstract
Background:Documentation of posture measurement costs is rare and cost models that do exist are generally
naïve. This paper provides a comprehensive cost model for biomechanical exposure assessment in occupational studies, documents the monetary costs of three exposure assessment methods for different stakeholders in data collection, and uses simulations to evaluate the relative importance of cost components.
Methods:Trunk and shoulder posture variables were assessed for 27 aircraft baggage handlers for 3 full shifts each using three methods typical to ergonomic studies: self-report via questionnaire, observation via video film, and full-shift inclinometer registration. The cost model accounted for expenses related to meetings to plan the study, administration, recruitment, equipment, training of data collectors, travel, and onsite data collection. Sensitivity analyses were conducted using simulated study parameters and cost components to investigate the impact on total study cost.
Results:Inclinometry was the most expensive method (with a total study cost of€66,657), followed by observation (€55,369) and then self report (€36,865). The majority of costs (90%) were borne by researchers. Study design parameters such as sample size, measurement scheduling and spacing, concurrent measurements, location and travel, and equipment acquisition were shown to have wide-ranging impacts on costs.
Conclusions:This study provided a general cost modeling approach that can facilitate decision making and planning of data collection in future studies, as well as investigation into cost efficiency and cost efficient study design. Empirical cost data from a large field study demonstrated the usefulness of the proposed models.
Keywords:Ergonomics, Posture, Inclinometer, Observation, Questionnaire
Background
There is widespread acceptance that in occupational studies, not all biomechanical exposure assessment methodologies are equal; most readers will be familiar with the ‘validity hierarchy’, which lists direct measures at the top, followed by observation methods and then self-report [1-6]. This hierarchy generally forms the basis of validation studies [7,8] and studies modeling the determinants of exposure [9,10]. However, validity is not
the only criterion when selecting an exposure assess-ment method. The cited studies also acknowledge that the cost of some methods prohibit measurements over large numbers of people, for example, in epidemiological studies. Despite the ubiquitous challenge of budgeting for successful research, issues of exposure assessment cost are not often represented in the literature.
A recent review attempted to summarize the state of inquiry into cost-efficient exposure assessment of occupa-tional exposures and identified only nine articles systemat-ically addressing this area [11,12]. Since literature was sparse, the authors described the related but distinct no-tion of statistical efficiency, where researchers may use variance components to allocate measures in the most ef-ficient way, based only on criteria related to statistical
* Correspondence:[email protected]
1Centre for Musculoskeletal Research, Department of Occupational and
Public Health Sciences, University of Gävle, SE–801 76, Gävle, Sweden
2Centre for Health and Safety in Agriculture, College of Medicine, University
of Saskatchewan, 103 Hospital Drive, Saskatoon, Saskatchewan, Canada S7N 0W8
Full list of author information is available at the end of the article
© 2012 Trask et al.; licensee BioMed Central Ltd. This is an Open Access article distributed under the terms of the Creative Commons Attribution License (http://creativecommons.org/licenses/by/2.0), which permits unrestricted use, distribution, and reproduction in any medium, provided the original work is properly cited.
performance. The reviewers point out that such studies often make a series of –at times implicit –assumptions that are not borne out in reality: assuming that all mea-surements have an equal cost [13], or that costs can be assessed with only a few types of costs such as‘ measure-ment’and‘recruitment’[14-17]. These works represent a substantial contribution to the area of cost-efficiency in research planning, but it is expected that the cost models may still be too simplistic [11]. To our knowledge, only one study has appeared, which employs a comprehensive cost model (i.e., including several types of costs) developed with empirical cost data to compare the cost-efficiency of four different techniques for observing postures from video [12]. That study clearly demonstrated that a simplis-tic cost model lead to other conclusions than a more complete model. So far, no study used comprehensive assessments in a comparison of basic exposure measure-ment methodologies.
Much of the cost-efficiency research to date has been performed with arbitrary measurement costs to demon-strate the principles. However, in order for researchers to make decisions about which method to use, realistic cost information is required. Despite its importance, re-search costs are not often discussed or reported in stud-ies of occupational exposure. In their review, Rezagholi and Mathiassen [11] identified only two articles that ex-plicitly listed the cost of measurement [14,18], and only one that did so for biomechanical exposures [18]. After the publication of the review, even the cited cost effi-ciency comparison of observation techniques has pre-sented empirical costs for collecting biomechanical data,
in casu postures. Although rare in listing measurement costs for biomechanical measurements, the Trask et al. article also had many limitations [18]. For example, the cost estimates did not include the costs associated with recruitment, travel, or analysis, all of which represent significant contributors to total study cost. The format of the cost model also limited its applicability; rather than listing fixed and variable costs, the article listed only the average cost for all measurements in the study, thereby limiting the applicability of the cost model to situations with different numbers of subjects or repeated measurements in identical settings. Some, but not all, of these limitations were resolved in the recent study of ob-servation methods by Rezagholi et al. [11]. Ideally, a cost model will demonstrate how measurement allocation affects the total study cost as well as the tradeoff be-tween cost components. A complete cost model with realistic cost inputs that can be applied to multiple sce-narios would be a helpful contribution to this area of research.
One of the overarching goals of our research on cost-efficient exposure assessment is to investigate the costs of ex-posure assessment in field-based studies of musculoskeletal
risk factors. To this end, the current study develops a new generic model for estimating costs associated with biomech-anical data collection and uses that model to investigate the costs associated with collecting data using three commonly-used methods of assessing daily postural exposure: self-report via questionnaire, observation via video film, and direct measurement using inclinometers. Also, the paper addresses the use of the cost model in simulating different study design scenarios, thus providing decision support for efficient study planning. The basis for the two latter objectives were an extensive data collection of trunk and shoulder posture in airport baggage handlers during which costs were trackeda priorifor all research activities.
Methods Modeling costs
The cost analysis presented here focuses on the data col-lection stage of research. For the purposes of this cost analysis, the‘project’starts with the acquisition of equip-ment and pilot testing and ends with the completion of all scheduled measurement days. Activities such as pre-liminary meetings with industry stakeholders and writing grant proposals are not included in this analysis, nor is the processing of collected data into exposure metrics, the analysis of video, statistical analyses, or the reporting of results to the scientific community. Measurement costs were assessed for capital including all equipment, as well as all labour involved in several different tasks directly related to data collection: measurement plan-ning, traiplan-ning, piloting, subject recruitment, travel, and the actual acquisition of data.
The cost model used in this study was developed using the economic principles employed in theoretical cost mod-els previously published in exposure assessment science, and in particular the review on this topic completed by two of the authors of the present paper [11]. This theoretical framework was developed and refined by the author group based on previous experience tracking research time and costs during occupational exposure assessment [18,19].
The general model for assessing total cost for method
m, CTm, included in the present case several fixed costs
(denoted by Č): the cost of project meetings to plan the study (ČM); the cost of administering the research aspects
of the study, including documentation, budgeting, and in-ternal correspondence (ČA) and administration related to
recruitment, including corresponding with employer and scheduling (ČR); the capital cost for equipment and
soft-ware (ČE); and the cost of training data collectors to use
measurement method m (ČT). The model also included
several variable costs (denoted byĊ): the cost of traveling to the worksite (ĊV) and hotel accommodations during
overnight trips (ĊH); the cost of recruiting workers at the
This model can be applied to any measurement method
mfollowing the general form of Eq. (1):
CTm¼ČMþČAþČRþČEþČTþĊVþĊH
þĊRþĊD: ð1Þ
ĊVis calculated as the product of the unit cost per trip
ċV (which includes rail, taxi, and private auto costs to
get to the worksite) and the number of trips nt; ĊH is
calculated as the product of the unit cost per night ċH
(including hotel and per-diem costs) and the number of nights nn;ĊRis calculated as the product of the unit cost
of recruiting one worker ċR (including researcher time
to locate randomly-selected workers at the worksite and invite them to participate) and the number of workers nw. There is a certain amount of preparation time that
must be spent irrespective of how many workers are measured on a given day by one researcher. To account for this, ĊDis calculated as the sum of the costs for the
first worker and concurrently measured workers as in Eq (2):
ĊD¼ċSnmþċFndþċCnc: ð2Þ
where ċS is the unit cost of measurement supplies
(in-cluding tape for inclinometers, and questionnaire print-ing costs) per worker-day measured nm; ċF is the unit
cost for the first worker measured on a researcher day nd; and ċC is the unit cost of concurrently measured
workers on that day nc. The unit cost of the first worker
measured includes confirming with the supervisor, set-ting up the research equipment, and waiset-ting for the workers to arrive; this is consistent for each researcher-day no matter how many workers are measured on that day. The cost for additional concurrently measured workers includes the amount of additional time required to administer another questionnaire, video, or inclinom-eter measurement on the same day. If two researchers travel to the worksite on the same date, that is two researcher-days nd. Now, the full model can be
expressed as Eq (3):
CTm¼ČMþČAþČRþČEþČTþċVntþċHnn þċRnwþċSnmþċFndþċCnc:
ð3Þ Because costs were collected for each measurement in-dependently, estimates of cost variability (in terms of standard deviation) were available for ċV, ċH, ċR, ċS, ċF,
andċC.
Applying the model to an example study: study population and data collection overview
Baggage handlers from a single employer at a large Swed-ish airport were recruited to the study. Eligible workers
included full- or part-time workers, but not those on modified duties or a return-to-work schedule. Workers were stratified by workshift and invited to participate in the study in a randomized order. The worker population included both ‘ramp’ workers who loaded, unloaded, de-iced and maneuvered aircraft, as well as‘sorting’workers who packed luggage into cargo containers, unloaded lug-gage onto the arrivals belt, and drove baglug-gage wagons. All subjects signed an informed consent form and all methods were approved by the Regional Ethical Review Board in Uppsala.
Twenty-seven workers were invited to have their trunk and shoulder posture assessed for 3 full shifts using three methods: self-report via questionnaire, observation via video film, and full-shift inclinometer registration via tri-axial accelerometers. Four trained researchers collected the data, including two of the authors (JW and CT) who supervised the data collection process. On each measurement day, a researcher planned to measure two workers, first mounting the inclinometers for full-shift measurement and then fol-lowing each worker with a video camera for half a day. This strategy was selected to permit expansion of the sample size within the time span of the study and gather more exposure information in this population.
Inclinometer data collection
Postural inclination with respect to gravity was measured using the VitaMove triaxial accelerometer system (2 M En-gineering, Veldhoven, The Netherlands). A recorder was placed on the trunk between the shoulder blades and one on each upper arm over the medial deltoid. Workers came in before their shift for instrumentation and calibration, then were measured during their regular work tasks for the duration of the shift. Data were downloaded to a computer and backed up on a hard drive at the end of the shift.
Observation data collection
Researchers video-filmed the workers continuously dur-ing one half of the shift. This involved followdur-ing the workers while they performed their regular work tasks and endeavouring to capture their trunk and shoulder postures.
Questionnaires data collection
Prior to starting their work shift, workers filled out a short questionnaire regarding their current perceived fatigue and body pain. After the work shift was completed, the workers filled out a post-shift questionnaire which repeated the fa-tigue and body pain questions, as well as including items on the amount of time spent performing specific postures and tasks during that particular shift.
Trasket al. BMC Medical Research Methodology2012,12:89 Page 3 of 10
Cost data collection
The data collection of this study was designed for prospective cost tracking rather than retrospective accounting. This meant that our cost assessment could be based on empirical data rather than hypothetical amounts [20] and averages [18] as used in previous cost studies. Researchers tracked their own office and lab tasks such as administration, planning, training, and piloting were tracked using a custom Excel macro with defined task categories, which was subse-quently compiled by one of the authors (CT) into hours per task category for all researcher staff working on the project. Researchers’ time spent travelling, as well as re-cruitment or measurement tasks was tracked via paper forms, and summarized for each researcher-day. Research-ers were trained and coached in this process at the outset of the study, and a list of activities, definitions, and categor-ies was jointly developed at the outset of the study. Cost tracking was reviewed by one of the authors (CT) throughout the data collection process and any questions or irregularities were discussed during team meetings. Al-though the reliability of researcher time tracking was not strictly recorded, there was no significant difference in task time reported between researchers. All costs were standar-dized to Euro currency using the average exchange rate be-tween October 2010 to March 2011. Researcher time was valued at€31 per hour with a University overhead addition of 68%.
When determining the cost components for each method, data acquisition time was considered for each method independently. In practice several methods were applied concurrently, but the cost components presented assume that researcher time is paid for the full time spent on each method without savings for multi-tasking. This was designed to facilitate decision making about single-method studies.
The study also considered which stakeholders bore the costs of research. Although most of the costs listed were borne by the researchers, the employer paid for workers to come early and stay late on each worker-day (a total of 1 hour paid, non-productive time per day). Employer administrators also assisted with the study and tracked their time spent on research tasks using a customized MS Excel spreadsheet similar to that used by the researchers.
Simulations based on study costs
The cost model can also be used as a decision tool to com-pare costs of studies with different sampling strategies. To demonstrate the effect of different study parameters on the total cost for each method and investigate the sensitivity of the model to different inputs, two kinds of simulations were performed: 1) changing the study design parameters (i.e. number of days in the field or measurement trips), and 2) changing the unit costs (the cost per trip or per first worker). In all cases, the simulation scenarios maintain the
same number of workers and total volume of measurement data as the present data. These simulations illustrate the potential for cost savings with different study designs as well as giving examples of how researchers can use the model to estimate study costs given different situations. They also illustrate the sensitivity of cost estimations to changes in study conditions, as expressed in changed unit costs.
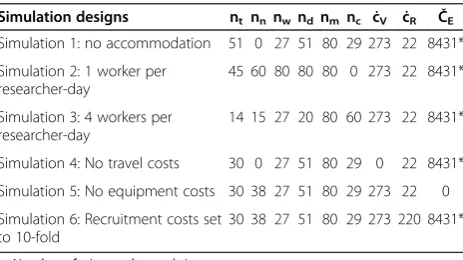
Table 1 details the parameters for simulations performed with the cost model. Simulation 1 examines the effect of traveling to and from the worksite for each of the 80 mea-surements (i.e. no accommodation at the worksite. Simula-tion 2 outlines the effect of measuring 1 worker per day on 80 researcher-days to reach 80 measurements. Simulation 3 looks at the effect of measuring 4 workers concurrently on 20 researcher-days to reach 80 measurements. Simulations 4-6 investigate the effect of different unit costs while main-taining the same study parameters as the present study. Simulation 4 examines the scenario where cost of travel and accommodation is set to zero, presuming that the measurement site is within biking distance from the univer-sity; Simulation 5 shows the scenarios where the cost of re-cruitment is increased 10-fold, assuming that it takes far longer to locate and persuade workers. Simulation 6 demonstrates the situation where the cost of equipment is set to zero, assuming that required equipment items have been previously purchased (recruitment, piloting, and train-ing are still required).
Table 1 Study design parameters and selected costs for 6 different simulated scenarios for use with the cost mode All costs are in Euros
Simulation designs nt nnnwnd nm nc ċV ċR ČE
Simulation 1: no accommodation 51 0 27 51 80 29 273 22 8431*
Simulation 2: 1 worker per researcher-day
45 60 80 80 80 0 273 22 8431*
Simulation 3: 4 workers per researcher-day
14 15 27 20 80 60 273 22 8431*
Simulation 4: No travel costs 30 0 27 51 80 29 0 22 8431*
Simulation 5: No equipment costs 30 38 27 51 80 29 273 22 0
Simulation 6: Recruitment costs set to 10-fold
30 38 27 51 80 29 273 220 8431*
ntNumber of trips to the worksite.
nnNumber of nights spent at the worksite.
nwNumber of workers.
ndTotal number of researcher days.
nmNumber of worker-days.
ncNumber of concurrently measured workers. ċVTravel cost.
ċRRecruitment unit cost.
ČEEquipment fixed costs.
* Fixed equipment cost for inclinometer. ObservationČE= 4496 Questionnaire ČE= 2401.
Results Study sample
As a result of 8 distinct recruitment efforts, 50 workers were invited to participate and 29 agreed. Twenty-seven of these workers were successfully measured. Out of 81 planned measurements (3 per worker), 80 were successfully com-pleted, while one worker went on disability leave for a back injury before the third measurement could be completed. Thus, a total of 80 full workshifts were collected with suc-cessful, concurrent assessments using all three methods. Although the questionnaire and video recording were com-pleted successfully each time they were attempted (success rate of 100%), the inclinometer method had a success rate of 93%. All participants were male; work shifts varied from 6 to 12 hours in length.
Study costs
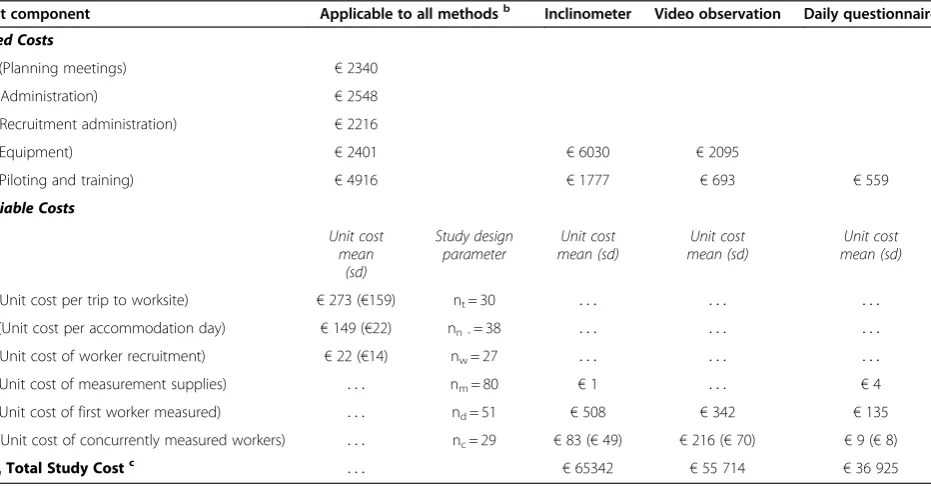
Values for the fixed and unit cost components observed for each of the three measurement methods are presented in Table 2. These cost components include costs borne by all research partners combined. The first column in Table 2 (‘applicable to all methods’) shows the costs that are required no matter which method is used; the total for each method in columns 3-5 represents the total study cost for applying that method, including the‘applicable to all meth-ods’costs that are in the first column. Table 3 takes the present study’s total costs for all methods combined and
estimates how much of the total study cost was borne by each of the study partners.
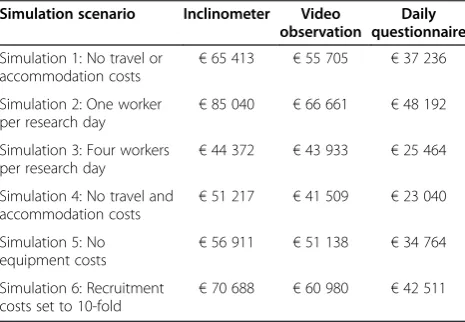
Costs of simulated studies
The total study costs estimated under the different simu-lated scenarios explained in Table 1 are presented in Table 4.
Discussion
Comparing cost of different methods
This study provided empirical cost data for use in cost models that can facilitate decision making and planning of future studies, as well as investigations of cost efficiency. For the current study design, exposure questionnaires were the least costly way to produce posture data, followed by observation and then inclinometer.
It is important to note that method-specific measure-ment costs are not always the most costly aspect of a study; in the present study the fixed and variable costs that apply to all methods make up between 43% and 78% of the total study cost (Table 2). This provides a substantially different result from a previous report of cost in ergonomic expos-ure assessment that disregarded travel and recruitment components, resulting in interview costs roughly 10% that of inclinometry [18]. Clearly this has a substantial effect on research planning and also the relative trade-off between methods; choosing a self-report method does not
Table 2 Cost model components for three measurement methods in the current studya(sd)
Cost component Applicable to all methodsb Inclinometer Video observation Daily questionnaire
Fixed Costs
ČM(Planning meetings) €2340
ČA(Administration) €2548
ČR(Recruitment administration) €2216
ČE(Equipment) €2401 €6030 €2095
ČT(Piloting and training) €4916 €1777 €693 €559
Variable Costs
Unit cost mean
(sd)
Study design parameter
Unit cost mean (sd)
Unit cost mean (sd)
Unit cost mean (sd)
ċV (Unit cost per trip to worksite) €273 (€159) nt= 30 . . . .
ċH (Unit cost per accommodation day) €149 (€22) nn -= 38 . . . .
ċR (Unit cost of worker recruitment) €22 (€14) nw= 27 . . . .
ċS (Unit cost of measurement supplies) . . . nm= 80 €1 . . . €4
ċF (Unit cost of first worker measured) . . . nd= 51 €508 €342 €135
ċC (Unit cost of concurrently measured workers) . . . nc= 29 €83 (€49) €216 (€70) €9 (€8)
CTmTotal Study Costc . . . €65342 €55 714 €36 925
a
researcher, employer, and worker production costs combined.
b
costs that are required no matter which method is used.
c
total study cost for applying that method, including the costs in the first column.
Trasket al. BMC Medical Research Methodology2012,12:89 Page 5 of 10
necessarily mean that one can conduct 10 times as many exposure assessment for the same price; one must consider the overall logistics of the study.
The effect of study design and cost assumption
The simulations in Table 4 demonstrate the budget impact of several different situations. The general form of the model is intended to be a tool for researchers during project planning, and the empirical costs are intended to provide a guideline for similar situations. Although the potential inputs to the model are infinite, here we will use the simulations in Table 4 to com-ment on research planning and budgeting issues.
Study design and planning involves a lot of logistics, with some cost-relevant aspects seldom reported in the research literature. Decisions around sample size, meas-urement scheduling and spacing, concurrent measmeas-urements,
location and travel, and equipment acquisition can have wide-ranging impacts on costs. Sample size affects generalizability, study power, and confidence in research results, but is limited by budget constraints. The ċR unit
cost of € 22 included in the model quantifies explicitly the cost increase when a new worker is recruited. Reten-tion and attriReten-tion are acknowledged problems in public health research [21], and it can be increasingly difficult to recruit and maintain participation. One of the simulated unit cost assumptions (simulation 6) examined a case where recruitment costs 10 times as much as in our study, resulting in an 8-14% increase in total study costs. It may be that as the sample size approaches an exhaust-ive sample of the worksite, the cost of recruitment does not stay constant as in the cost model presented here; costs may go up if employers are resistant to additional recruitment, or they may go down if social facilitation encourages workers to participate (i.e. they see their col-leagues participating and want to join). These types of non-linear relationships have been hypothesized [20], but the current study did not collect empirical data to be able to implement them.
Although the inclinometers were robust enough not to re-quire replacement over the span of the study, some types of equipment may require replacement that would make the direct measurement cost even higher. The inclinometer had the highest fixed costs, and therefore the most opportunity to amortize the fixed equipment costs over many measure-ments. The variable costs are also high since the in-clinometer measurements were made for the full day, but this is a conservative estimate of time required for the inclinometer as this method only requires hands-on researcher input for set-up and take-down and occasional troubleshooting during the shift. This means the inclinometer lends itself very well to multi-tasking or to concurrent measurements. In multi-multi-tasking researchers could analyze previously-collected data, write reports, or do administrative work during the seven hours between inclinometer set-up and take-down. If researchers were to perform useful work during the inclinometer measurements, a day’s in-clinometer measurement would include only the cost of supplies and preparation time (approximately €175); the total study cost for an inclinometer study with the parameters of the current study would be€48 359, a sav-ings of€16 983.
Work context could have an effect on the estimated costs, particularly for video tasks. Baggage handling work is very dynamic and takes place over a large workplace, so researchers must actively track workers with a camera for the entire measurement. This strategy would be similar in industries like health care, construction, agriculture, and re-source industries such as mining. However, office work and assembly line jobs in manufacturing where the tasks are
Table 4 Total study cost using the present study unit costs and different simulated design parameters
Simulation scenario Inclinometer Video observation
Daily questionnaire
Simulation 1: No travel or accommodation costs €
65 413 €55 705 €37 236
Simulation 2: One worker
per research day €
85 040 €66 661 €48 192
Simulation 3: Four workers
per research day €
44 372 €43 933 €25 464
Simulation 4: No travel and accommodation costs €
51 217 €41 509 €23 040
Simulation 5: No
equipment costs €
56 911 €51 138 €34 764
Simulation 6: Recruitment costs set to 10-fold
€70 688 €60 980 €42 511 Table 3 Proportion of costs borne by different
stakeholders
Cost component Researchers Employers admin
staff
Worker’s production
time
ČM(Planning meetings) €1170 €1170, . . .
ČA(Administration) €1897 €754 . . .
ČR(Recruitment
administration)
€1748 €468 . . .
ČE(Equipment) €10 526 . . . .
ČT(Piloting and training) €7686, . . . €260
ČRRecruitment time €1413 . . . .
ĊV&ĊH(Measurement travel) €7659 . . . .
ĊD(Measurement
preparation) €
6456 . . . €4162
ĊD(Measurement time and
supplies)
€25 539 . . . .
carried out in a small area may be good candidates for pas-sive video capture using a tripod or a surveillance camera, in which case concurrent video measure would be possible. This would increase nc, the number of concurrent workers,
and decrease the total study cost. If it were possible to have perfectly overlapping measurements that required no extra time, the total study cost would decrease slightly to 88-99% of current study costs. Despite a cost savings of 12%, con-current measurement using video seems impractical, if not impossible under the conditions of the current study. In concurrent measurements, several workers would be mea-sured within the same workshift for the same amount of preparation, travel, and waiting time and this could yield savings. Simulation 3 examines concurrent measurement of 4 workers per day and is the cheapest of the simulated options, costing 68-79% of the current study costs. Con-versely, measuring only one worker per day (Simulation 2) requires more time and travel costs, resulting in costs 19-30% higher than the current study. The feasibility of con-current measurements will depend on the start times of the workers and how flexible employer and/or workers are to modifying work times to allow for set up and meas-urement of several workers. Based on our experience, we estimate that for one researcher, 4 workers could be mea-sured simultaneously using the inclinometer, 10 or more using the questionnaire, and only 1 additional worker for the video camera (unless the amount of recording time was shortened).
Although not explicit in the cost model, it is possible for the spacing of measurements to affect cost as well as the more well-known effects on exposure values [19]. In the current study we chose consecutive shifts to avoid the travel costs and administrative hassle of scheduling work-ers on a rotating shift schedule, but the trade-off is auto-correlation in the data. We also elected to conduct the study over a 3-month period during the winter, which surely impacts the type of exposures encountered and is unlikely to have full generalizability to the other parts of the year. However, a year-long sampling campaign would have been cost-prohibitive, given the need to retain part-time staff for the full year or retrain new staff.
Travel and accommodation needs are likely to vary sub-stantially between research studies depending on the location of the researchers and institution relative to the data collec-tion site. The current study showed substantial variacollec-tion in travel distance and cost, represented by a ċVcoefficient of
variation of 58%. The distances in the current study required considerable travel, and introduced a trade-off between the total number of trips and length of stay. Simulation 1 shows the effect of making a new trip to the measurement site for each measurement day, which increases the costs less than 1%. Conversely, if each researcher made only 1 trip to the measurement site and stayed in a hotel for the duration of the study, costs decrease to 88-92% of the current study. If
unit costs for travel or accommodation were zero because the measurement site was adjacent to the university as in simulation 4, the costs would be only 61-78% of the current study costs. Naturally cost is not the only factor when plan-ning travel logistics and accommodation schedules; an add-itional consideration will be the tolerance of data collectors and local labour laws.
This study assumed no depreciation of the equipment cost, so the whole cost of research equipment purchase price is included inČE. The costs presented therefore
repre-sent the assumption of ‘starting from scratch’and having to purchase all equipment. However, were the researchers to pursue a similar study in the future, the decision between which method to select would be weighed without the fixed costs of equipment, since the equipment has already been acquired. This is demonstrated in simulation 5, where total study costs are only 87% of the current study cost for the equipment-intensive inclinometer method, 92% for the ob-servation and 93% for the questionnaire.
Who’s paying? Researcher- and employer-borne study costs
Over 90% of costs tracked in the current study were borne by researchers. It seems likely that time tracking biases would tend to overestimate this proportion, since researchers may be more motivated and diligent in reporting time spent on the study. It is possible that the time tracked by employer administrators (3.4% of the total study costs) is underesti-mated. For example, short tasks might be deemed‘not worth tracking’ but cumulatively might represent a relevant cost. When industry stakeholders decide whether to participate in research, information about the time and resource commit-ments can help manage expectations and plan resources, as well as demonstrating researchers’ sensitivity to balancing business interests with research needs, the prioritization of which is different between researchers and industry holders. Researchers forecasting costs for industry stake-holders may not have a strong influence on participant recruitment, but it seems likely to foster better trust and stronger relations between research stakeholders and al-most certainly enhances retention or re-contact of study participants.
In the current study, employer administration and work-er’s production time were both borne by the employer. In other contexts, the employer might not be able to pay for workers’time, and transferring this cost (in terms of time spent or opportunity cost) onto workers is likely to affect the participation rate. The opportunity cost is the value of what is given up in order to participate in a study. Adding an hour to the workday may affect carpooling arrangements or transit/parking habits that can change direct costs of par-ticipation; it also means less time with family or sports and leisure pursuits. To address this, some studies provide an economic incentive equivalent to wage replacement [22].
Trasket al. BMC Medical Research Methodology2012,12:89 Page 7 of 10
This could increase the research budget substantially as worker production time accounted for over 6% of the total study cost in the current study. Although workers were paid for their time when they showed up early and stayed late, a limitation of the current study’s cost track-ing method is that it does not account for opportunity costs associated with extending the workday or filling out questionnaires during work time. These types of costs are difficult to quantify and so were not included in the current study, although they may have an impact in participants’decision making.
Method performance: another consideration for decision making
If cost were the only consideration, the findings pre-sented here would suggest that self-report is always the best option for assessing work postures. However, cost is far from the only criterion for selecting an exposure as-sessment method. It is possible for less tangible charac-teristics to render a method more desirable to worker, employer, union, insurance board, or regulatory stake-holders. These partners may have aperceptionthat self-report will always be biased, that direct measurements are infallible, or that ‘expert’ observation is adequate in every situation. In order to foster collaboration, these perceptions need to be discovered and addressed either through education or compromise.
Researchers also need to consider the scientific qual-ity of the data in terms of accuracy, precision, or pre-dictive validity for health outcomes. In order to address this issue, the cost efficiency of each method must be determined by comparing the price to the per-formance of each method. To determine cost effi-ciency, cost data (such as that contained in this report) could be combined with components of variance from collected exposure data to quantify the cost efficiency of each method and sampling schemes as described previously [11,20]. Variance components are often used to guide allocation of measurement efforts within and between individuals [19,23]. Most studies investigat-ing this issue have considered only statistical efficiency, not measurement cost [11]. However, optimization based on both costs and statistical performance could yield a substantially different study design than what follows from optimizing only with respect to statistical performance [16,17,20]. For example, when within-worker variance is higher than between-worker variance and recruitment costs for engaging participants are high compared to costs for collecting more data from subjects already in the study, multiple measures on fewer workers may prove to be a more cost efficient sampling strategy than that sug-gested when only statistical performance is considered, i.e. distributing measurements among as many subjects as possible [14,20]. Bias is also an important consideration;
self-report has been shown to, in general, overestimate physical exposures [24], particularly in workers with mus-culoskeletal symptoms [25]. Some observation methods may also be associated with bias when compared to results obtained by inclinometry [12]. This type of misclassifica-tion could have deleterious effects on an epidemiological study of health outcomes. Previous cost-efficiency studies have shown that for simple models of cost and statistical performance, cost efficiency can be explicitly optimized. However, the complexity of the cost model, including pos-sible non-linearity, and the structure and degree of errors in some exposure variables may preclude a fully-optimized cost efficiency model and instead favour a numerical ra-ther than analytical approach.
Thus, future research should investigate not only the price, but also the cost efficiency of the exposure assess-ment methods in terms of value outputs like precision and bias of the resulting information.
Performance of the cost model
The accounting protocols used in this study allowed es-timation of variability in unit costs, and variability tended to be high. The coefficient of variation (CV) in recruitment and travel were both over 50%, demon-strating that these costs are influenced by other factors than just the number workers recruited or number of trips. The cost for concurrently measured workers was also highly variable (CV = 32-88%), a result of the vary-ing amount of time required to complete an additional measurement. Together, the variability of the unit costs gives some insight as to the stability of total study cost if the study were to be repeated, introducing the notion of confidence intervals around a projected study cost. The uncertainty of cost estimations, as well as the im-pact of such uncertainty on total costs, could be an av-enue for future research.
The Rezagholi and Mathiassen review lists several simplifying assumptions in existing cost models: as-suming that all measurements have an equal cost [13], or that costs can be split into two or three stages or levels (e.g.‘worker’level and‘repeated measures’level), or can be represented by limited components such as
researcher time. Thus, another issue for further re-search would be the cost efficiency of the cost tracking
per se; for instance whether a simpler and cheaper cost tracking procedure would free resources in a study that could then be used to collect more exposure data.
There are a number of other ‘hidden’costs that were not explicitly separated out in the model. For example, energy and infrastructure costs were considered to be included in the University overhead which was incorpo-rated into researcher work time. As a result, researchers looking to use the model cannot separate institutional overhead components. This limitation could be navigated by adjusting unit costs for researcher time to apply differ-ent overhead values.
The data presented do not currently include the costs related to post-processing and analyzing collected data into postural exposure variables. Rather, the present study stops accounting when all the acquired electronic files are downloaded onto University servers and the questionnaires are delivered to University file storage. These additional costs in a full exposure as-sessment include all tasks between data collection and statistical analysis, including data entry for paper ques-tionnaires, data processing, visual inspection and qual-ity control for inclinometer data, and observer time spent recording postures from video still frames. A re-cent study investigating the cost-efficiency of different observation sampling protocols suggests these costs can be substantial, but also that they depend signifi-cantly on the technique used for data processing [12]. There are many options for processing and analyzing data depending on the research questions; the present results may be viewed as a common starting point for a complete cost assessment of basic data collection up to the point of finalized exposure data, where the pro-cessing costs differ depending on the techniques used for retrieving exposure variables. Since processing and analysis costs could comprise a considerable portion of total research costs, the comparisons between exposure assessment methods could evolve as these components are included.
Some time was spent multitasking in the current study, and it is difficult to separate the time spent on each method. For example, inclinometer and video data could be downloaded while the questionnaire was being filled out. Although it would seem that the in-clinometer took the most preparation time, it is not al-ways possible to separate how much time was spent on what. For this reason, the time estimates for each method (and especially the questionnaire) could be over-estimated. Conversely, when questionnaire methods are applied alone, the time it takes to identify a participating worker and introduce an instrument is non-trivial but was not explicitly accounted for in our data, so overestimates
on the researcher time spent on the questionnaire are likely minimal.
Conclusion
The current study addresses research gaps in the area of cost efficiency [11] and improves on previous studies of cost [18] by introducing a comprehensive model for esti-mating total costs including fixed and variable cost com-ponents, implementing prospective collection of cost data, and acknowledging who bears the costs. In terms of determining the cost of common posture assessment methods, findings show that posture assessment by incli-nometry was more expensive than observation, which was more expensive than self-report; the majority of costs were borne by researchers. However, costs for data processing and analysis are non-trivial and may have substantial impact on the total cost of research including both data collection (as in the present study), and subse-quent processing of data into end-point exposure vari-ables of interest; the costs of the processing method also needs to be considered when selecting an exposure as-sessment method.
This study successfully developed a cost model with cost components for the three exposure assessment methods; this model is intended to be used as a research planning tool for future ergonomics field research. The division of the cost model into components means that researchers can use information about their own specific unit costs, e.g. for travel and researcher time, and their proposed sampling strategy to tailor costs for a novel study, sup-porting decisions that lead to a more efficient resource allocation in studies of occupational ergonomics.
Competing interests None to declare.
Acknowledgements
The authors would like to thank AFA Insurance and the Swedish Council for Research in Working Life and Social Science (FAS Dnr 2009-1761) for their financial support, as well as study partners SAS Ground Services and the Vocational Training & Working Environment Council (Transport Trades, TYA). We gratefully acknowledge the data collection efforts of Jennie Jackson and Carl Lind. We would particularly like to thank all of the flight loaders who participated in this study.
Author details
1Centre for Musculoskeletal Research, Department of Occupational and
Public Health Sciences, University of Gävle, SE–801 76, Gävle, Sweden.
2Centre for Health and Safety in Agriculture, College of Medicine, University
of Saskatchewan, 103 Hospital Drive, Saskatoon, Saskatchewan, Canada S7N 0W8.3Department of Public Health & Clinical Medicine, Occupational and
Environmental Medicine, Umeå University, SE-901 85, Umeå, Sweden.
Authors’contributions
CT developed the specific research question at hand, contributed to sampling strategy and data collection protocols, supervised data collection, drafted the cost model, processed the results, and drafted the manuscript. SEM conceived of the original study of flight loaders, developed the sampling strategy, contributed to data collection protocols, and contributed significantly to the manuscript. JW contributed to sampling strategy and data collection protocols, collected worksite data, and contributed
Trasket al. BMC Medical Research Methodology2012,12:89 Page 9 of 10
significantly to the manuscript. MH contributed to sampling strategy and data collection protocols, and contributed significantly to the manuscript. MR took part in designing the cost model, interpreting the results, and contributed significantly to the manuscript. All five authors read and approved the final manuscript.
Received: 13 March 2012 Accepted: 27 June 2012 Published: 27 June 2012
References
1. Burdorf A, van der Beek AJ:In musculoskeletal epidemiology are we asking the unanswerable in questionnaires on physical load?Scand J Work Environ Health1999,25(2):81–83.
2. van der Beek AJ, Frings-Dresen MH:Assessment of mechanical exposure in ergonomic epidemiology.Occup Environ Med1998,55(5):291–299. 3. Wells R,et al:Assessment of physical work load in epidemiologic studies:
common measurement metrics for exposure assessment.Ergonomics
1997,40(1):51–61.
4. Winkel J, Mathiassen SE:Assessment of physical work load in
epidemiologic studies: concepts, issues and operational considerations.
Ergonomics1994,37(6):979–988.
5. van Dieen JH,et al:Validity of estimates of spinal compression forces obtained from worksite measurements.Ergonomics2010,53(6):792–800. 6. Takala EP,et al:Systematic evaluation of observational methods
assessing biomechanical exposures at work.Scand J Work Environ Health
2009,24:24.
7. Spielholz P,et al:Comparison of self-report, video observation and direct measurement methods for upper extremity musculoskeletal disorder physical risk factors.Ergonomics2001,44(6):588–613.
8. Village J,et al:Development and evaluation of an observational Back-Exposure Sampling Tool (Back-EST) for work-related back injury risk factors.Appl Ergon2009,40:538–544.
9. Teschke K,et al:Measuring posture for epidemiology: Comparing inclinometry, observations, and self-reports.Ergonomics2009,52 (9):1067–1078.
10. Trask C,et al:Using observation and self-report to predict mean, 90th percentile, and cumulative low back muscle activity in heavy industry workers.Ann Occup Hyg2010,54(5):595–606.
11. Rezagholi M, Mathiassen SE:Cost-efficient design of occupational exposure assessment strategies–a review.Ann Occup Hyg2010,54 (8):858–868.
12. Rezagholi M, Mathiassen SE, Liv P:Cost efficiency comparison of four video-based techniques for assessing upper arm postures.Ergonomics
2012,55(3):350–360.
13. Lemasters GK,et al:Balancing cost and precision in exposure assessment studies.J Occup Environ Med1996,38(1):39–45.
14. Whitmore RW,et al:Cost/variance optimization for human exposure assessment studies.J Expo Anal Environ Epidemiol2005,15(6):464–472. 15. Stram DO,et al:Cost-efficient design of a diet validation study.Am J
Epidemiol1995,142(3):353–362.
16. Mathiassen S-E, Trask C:Cost efficiency of adding another subject or another day to an exposure dataset, Proceeding of the 7thInternational Scientific Conference on Prevention of Work-Related Musculoskeletal Disorders (PREMUS 2010) CD-Rom. Angers, France: University of Angers; 2010. August 29-September 3.
17. Trask C, Mathiassen S-E:Price versus precision: cost efficiency in trunk posture observation, Proceeding of the 7thInternational Scientific Conference on Prevention of Work-Related Musculoskeletal Disorders (PREMUS 2010) CD-Rom. Angers, France: University of Angers; 2010. August 29-September 3. 18. Trask C,et al:Measuring low back injury risk factors in challenging work
environments: an evaluation of cost and feasibility.Am J Ind Med2007, 50(9):687–696.
19. Liv P, Mathiassen SE, Svendsen SW:Theoretical and empirical efficiency of sampling strategies for estimating upper arm elevation.Ann Occup Hyg
2011,55(4):436–449.
20. Mathiassen SE, Bolin K:Optimizing cost-efficiency in mean exposure assessment - cost functions reconsidered.BMC Med Res Methodol2011, 11:76.
21. Senturia YD,et al:Successful techniques for retention of study participants in an inner-city population.Control Clin Trials1998,19 (6):544–554.
22. Fethke NB, Gant LC, Gerr F:Comparison of biomechanical loading during use of conventional stud welding equipment and an alternate system.
Appl Ergon2011,42(5):725–734.
23. Mathiassen SE, Burdorf A, van der Beek AJ:Statistical power and measurement allocation in ergonomic intervention studies assessing upper trapezius EMG amplitude. A case study of assembly work.J Electromyogr Kinesiol2002,12(1):45–57.
24. Unge J,et al:Validity of self-assessed reports of occurrence and duration of occupational tasks.Ergonomics2005,48(1):12–24.
25. Balogh I,et al:Self-assessed and directly measured occupational physical activities–influence of musculoskeletal complaints, age and gender.Appl Ergon2004,35(1):49–56.
doi:10.1186/1471-2288-12-89
Cite this article as:Trasket al.:Data collection costs in industrial environments for three occupational posture exposure assessment
methods.BMC Medical Research Methodology201212:89.
Submit your next manuscript to BioMed Central and take full advantage of:
• Convenient online submission
• Thorough peer review
• No space constraints or color figure charges
• Immediate publication on acceptance
• Inclusion in PubMed, CAS, Scopus and Google Scholar
• Research which is freely available for redistribution