InTrans Project Reports Institute for Transportation
3-2015
Concrete Pavement Mixture Design and Analysis
(MDA): Development and Evaluation of Vibrating
Kelly Ball Test (VKelly Test) for the Workability of
Concrete
Peter Taylor
Iowa State University, [email protected]
Xuhao Wang
Iowa State University, [email protected]
Xin Wang
Iowa State University, [email protected]
Follow this and additional works at:http://lib.dr.iastate.edu/intrans_reports
Part of theCivil Engineering Commons
This Report is brought to you for free and open access by the Institute for Transportation at Iowa State University Digital Repository. It has been accepted for inclusion in InTrans Project Reports by an authorized administrator of Iowa State University Digital Repository. For more information, please [email protected].
Recommended Citation
Taylor, Peter; Wang, Xuhao; and Wang, Xin, "Concrete Pavement Mixture Design and Analysis (MDA): Development and Evaluation of Vibrating Kelly Ball Test (VKelly Test) for the Workability of Concrete" (2015).InTrans Project Reports. 105.
Concrete Pavement Mixture Design and Analysis (MDA): Development
and Evaluation of Vibrating Kelly Ball Test (VKelly Test) for the
Workability of Concrete
Abstract
Due to the low workability of slipform concrete mixtures, the science of rheology is not strictly applicable for such concrete. However, the concept of rheological behavior may still be considered useful. A novel
workability test method (Vibrating Kelly Ball or VKelly test) that would quantitatively assess the
responsiveness of a dry concrete mixture to vibration, as is desired of a mixture suitable for slipform paving, was developed and evaluated. The objectives of this test method are for it to be cost-effective, portable, and repeatable while reporting the suitability of a mixture for use in slipform paving. The work to evaluate and refine the test was conducted in three phases: 1. Assess whether the VKelly test can signal variations in laboratory mixtures with a range of materials and proportions 2. Run the VKelly test in the field at a number of construction sites 3. Validate the VKelly test results using the Box Test developed at Oklahoma State University for slipform paving concrete The data collected to date indicate that the VKelly test appears to be suitable for assessing a mixture’s response to vibration (workability) with a low multiple operator variability. A unique parameter, VKelly Index, is introduced and defined that seems to indicate that a mixture is suitable for slipform paving when it falls in the range of 0.8 to 1.2 in./√s.
Keywords
Concrete mixing; Concrete pavements; Concrete tests; Guidelines; Mix design; Pavement design; Pavement performance; Specifications; Vibration tests; Workability; Kelly ball test; Vibrating Kelly ball; VKelly test
Disciplines Civil Engineering
Concrete Pavement Mixture Design and Analysis (MDA):
Development and Evaluation of
Vibrating Kelly Ball Test (VKelly test)
for the Workability of Concrete
Final Report
March 2015
Sponsored through
About the National CP Tech Center
The mission of the National Concrete Pavement Technology Center is to unite key transportation stakeholders around the central goal of advancing concrete pavement technology through
research, tech transfer, and technology implementation.
Disclaimer Notice
The contents of this report reflect the views of the authors, who are responsible for the facts and the accuracy of the information presented herein. The opinions, findings and conclusions expressed in this publication are those of the authors and not necessarily those of the sponsors. The sponsors assume no liability for the contents or use of the information contained in this document. This report does not constitute a standard, specification, or regulation.
The sponsors do not endorse products or manufacturers. Trademarks or manufacturers’ names appear in this report only because they are considered essential to the objective of the document.
Iowa State University Non-Discrimination Statement
Iowa State University does not discriminate on the basis of race, color, age, religion, national origin, pregnancy, sexual orientation, gender identity, genetic information, sex, marital status, disability, or status as a U.S. veteran. Inquiries regarding non-discrimination policies may be directed to Office of Equal Opportunity, Title IX/ADA Coordinator and Affirmative Action Officer, 3350 Beardshear Hall, Ames, Iowa 50011, 515-294-7612, [email protected].
Iowa Department of Transportation Statements
Federal and state laws prohibit employment and/or public accommodation discrimination on the basis of age, color, creed, disability, gender identity, national origin, pregnancy, race, religion, sex, sexual orientation or veteran’s status. If you believe you have been discriminated against, please contact the Iowa Civil Rights Commission at 800-457-4416 or the Iowa Department of Transportation affirmative action officer. If you need accommodations because of a disability to access the Iowa Department of Transportation’s services, contact the agency’s affirmative action officer at 800-262-0003.
The preparation of this report was financed in part through funds provided by the Iowa Department of Transportation through its “Second Revised Agreement for the Management of Research Conducted by Iowa State University for the Iowa Department of Transportation” and its amendments.
Technical Report Documentation Page
1. Report No. 2. Government Accession No. 3. Recipient’s Catalog No.
TPF 5(205)
4. Title and Subtitle 5. Report Date
Concrete Pavement Mixture Design and Analysis (MDA): Development and Evaluation of Vibrating Kelly Ball Test (VKelly Test) for the Workability of Concrete
March 2015
6. Performing Organization Code
7. Author(s) 8. Performing Organization Report No.
Peter Taylor, Xuhao Wang, Xin Wang
9. Performing Organization Name and Address 10. Work Unit No. (TRAIS)
National Concrete Pavement Technology Center Iowa State University
2711 South Loop Drive, Suite 4700 Ames, IA 50010-8664
11. Contract or Grant No.
12. Sponsoring Organization Name and Address 13. Type of Report and Period Covered
Federal Highway Administration and Pooled Fund Partners U.S. Department of Transportation
1200 New Jersey Avenue SE Washington, DC 20590
Technical Report
14. Sponsoring Agency Code
TPF-5(205)
15. Supplementary Notes
Visit www.cptechcenter.org for color pdfs of this and other research reports.
16. Abstract
Due to the low workability of slipform concrete mixtures, the science of rheology is not strictly applicable for such concrete. However, the concept of rheological behavior may still be considered useful. A novel workability test method (Vibrating Kelly Ball or VKelly test) that would quantitatively assess the responsiveness of a dry concrete mixture to vibration, as is desired of a mixture suitable for slipform paving, was developed and evaluated. The objectives of this test method are for it to be cost-effective, portable, and repeatable while reporting the suitability of a mixture for use in slipform paving.
The work to evaluate and refine the test was conducted in three phases:
1.Assess whether the VKelly test can signal variations in laboratory mixtures with a range of materials and proportions 2.Run the VKelly test in the field at a number of construction sites
3.Validate the VKelly test results using the Box Test developed at Oklahoma State University for slipform paving concrete
The data collected to date indicate that the VKelly test appears to be suitable for assessing a mixture’s response to vibration (workability) with a low multiple operator variability. A unique parameter, VKelly Index, is introduced and defined that seems to indicate that a mixture is suitable for slipform paving when it falls in the range of 0.8 to 1.2 in./√s.
17. Key Words 18. Distribution Statement
concrete mixtures—concrete workability—Kelly ball test—vibrating Kelly ball— VKelly test
No restrictions.
19. Security Classification (of this report)
20. Security Classification (of this page)
21. No. of Pages 22. Price
Unclassified. Unclassified. 43 NA
C
ONCRETE
P
AVEMENT
M
IXTURE
D
ESIGN
AND
A
NALYSIS
(MDA):
D
EVELOPMENT AND
E
VALUATION OF
V
IBRATING
K
ELLY
B
ALL
T
EST
(VK
ELLY
T
EST
)
FOR THE
W
ORKABILITY OF
C
ONCRETE
Technical Report March 2015
Principal Investigator Peter Taylor, Associate Director
National Concrete Pavement Technology Center, Iowa State University
Research Assistants Xuhao Wang and Xin Wang
Authors
Peter Taylor, Xuhao Wang, and Xin Wang
Sponsored by
FHWA Pooled Fund Study TPF-5(205): Colorado, Iowa (lead state), Kansas, Michigan, Missouri, New York, Oklahoma, Texas, Wisconsin
Preparation of this report was financed in part
through funds provided by the Iowa Department of Transportation through its Research Management Agreement with the
Institute for Transportation (InTrans Project 10-374)
A report from
National Concrete Pavement Technology Center Iowa State University
2711 South Loop Drive, Suite 4700 Ames, IA 50010-8664
v
TABLE OF CONTENTS
ACKNOWLEDGMENTS ... vii
EXECUTIVE SUMMARY ... ix
INTRODUCTION ...1
BACKGROUND ...2
VKELLY TEST METHOD ...13
WORK CONDUCTED ...18
Phase I (Laboratory Test) ...18
Phase II (Field Test) ...25
Phase III (Validation of VKelly Test Results) ...27
CONCLUSIONS AND FUTURE WORK ...30
Conclusions ...30
Future Work ...30
vi
LIST OF FIGURES
Figure 1. Kelly ball test apparatus (Koehler and Fowler 2003) ...13
Figure 2. VKelly test apparatus ...14
Figure 3. Modified eccentric weight in vibrator ...15
Figure 4. Variable transformer ...15
Figure 5. Adjustable steel frame to stabilize the VKelly apparatus ...16
Figure 6. Completed VKelly test ...16
Figure 7. Sample plot of VKelly test results ...17
Figure 8. Gradations of coarse and fine aggregates ...20
Figure 9. VKelly Index for plain mixes ...22
Figure 10. Influence of elapsed time and remixing on VKelly Index ...23
Figure 11. Influence of fine aggregate content on VKelly Index ...23
Figure 12. Influence of Class C fly ash replacement on VKelly Index ...24
Figure 13. Influence of air content on VKelly Index ...24
Figure 14. Influence of water content on VKelly Index ...25
Figure 15. VKelly test conducted in the field ...25
Figure 16. Field test results ...26
Figure 17. Slump (a) and VKelly Index (b) versus binder content ...28
Figure 18. Box Test visual rating versus VKelly Index...29
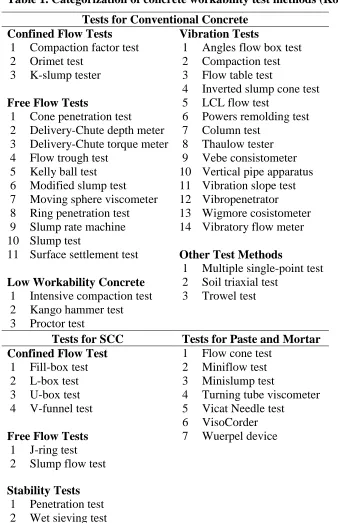
LIST OF TABLES Table 1. Categorization of concrete workability test methods (Koehler and Fowler 2003) ...4
Table 2. Summary of features of existing workability test methods ...5
Table 3. Mix proportions ...19
Table 4. Chemical compositions of cementitious materials ...20
Table 5. Laboratory test results ...21
vii ACKNOWLEDGMENTS
This research was conducted under the Federal Highway Administration (FHWA) Transportation Pooled Fund Study TPF-5(205) with support from the following state departments of
transportation (DOTs):
Colorado
Iowa (lead state)
Kansas
Michigan
Missouri
New York
Oklahoma
Texas
Wisconsin
The authors would like to express their gratitude to the Iowa DOT and the other pooled fund state partners for their financial support and technical assistance.
ix EXECUTIVE SUMMARY
The aim of the work described in this report is to develop and evaluate a method that would quantitatively assess the responsiveness of a dry concrete mixture to vibration, as is desired of a mixture suitable for slipform paving. Even though a number of workability test methods have been developed, there continues to be a need to measure workability in order to achieve the following objectives:
The test should be cost-effective
Testing equipment should be portable
The test should measure two parameters
The test should simulate the paving process
The test should be repeatable
Due to the low workability of slipform concrete mixtures, the science of rheology is not strictly applicable for such concrete. However, the concept of rheological behavior may still be
considered useful. The workability test method discussed in this report, the Vibrating Kelly Ball (VKelly) Test, considers the rate of movement under vibration as well as the initial yield stress.
The work to evaluate and refine the test was conducted in three phases. The first phase was to assess whether the VKelly test can signal variations in laboratory mixtures with a range of materials and proportions. The second phase was to run the VKelly test in the field at a number of construction sites. The third phase was to validate the VKelly test results using the Box Test developed at Oklahoma State University for slipform paving concrete.
1 INTRODUCTION
Workability of concrete is a poorly defined property that has long been a challenge to predict and measure (Cook et al. 2013). Researchers have spent over 80 years working on test procedures to determine workability for research, mix proportioning, and field use. The majority of these test methods have never found any use beyond the initial studies (Koehler and Fowler 2003). In addition, the workability requirements of slipform paving mixtures are unique in that the ideal is a stiff mixture with no edge slump, yet one that flows readily under vibration.
The science of rheology is sometimes applied to concrete systems, but, as the study of fluids in motion, it is not strictly applicable to dry concrete mixtures. However, the concept of a two-parameter measurement may be considered useful. The testing approach reported here considers the rate of movement under vibration as well as the initial yield stress.
2 BACKGROUND
Multiple definitions of the term “workability” are summarized by Koehler and Fowler (2003):
American Concrete Institute (ACI 116R-00 2000): “that property of freshly mixed concrete or mortar that determines the ease with which it can be mixed, placed, consolidated, and finished to a homogenous condition”
Japanese Association of Concrete Engineers: “that property of freshly mixed concrete or mortar that determines the ease and homogeneity with which it can be mixed, placed, and compacted due to its consistency, the homogeneity with which it can be made into concrete, and the degree with which it can resist separation of materials”
Mindess et al. (2003): “the amount of mechanical work, or energy, required to produce full compaction of the concrete without segregation”
In the early 20th century, a simple and cost-efficient slump test was adopted because, in the mixtures at the time, workability could be tied to water-to-cement ratio (w/c) and thus potential performance (Abrams 1922). However, with the adoption of supplementary cementitious materials (SCMs) and water-reducing admixtures, this correlation has been lost. However, there continues to be a need to measure workability as a means to monitor uniformity, as well as to ensure that a mixture has the right workability for the proposed construction method. As such, the slump test is insufficient because it only measures one parameter.
If concrete is considered to be a Bingham fluid, it is characterized by two parameters (yield stress and plastic viscosity) that can be measured using a rheometer (Tattersall and Banfill 1983).
Tattersall (1991) split the assessment of workability into three broad categories, and the majority of workability test methods fall into categories II and III, as follows:
Category I – Qualitative: workability, flowability, compactability, finishability, and pumpability; to be used only in a general descriptive way without any attempt to quantify
Category II – Quantitative Empirical: slump, compacting factor, Vebe time, and flow table spread; to be used as a simple quantitative statement of behavior in a particular set of circumstances
Category III – Quantitative Fundamental: viscosity, mobility, fluidity, and yield stress; to be used strictly in conformity with standard definitions
3
Workability test methods have also been classified by the National Institute of Standards and Technology (NIST) in terms of flow produced during the test (Hackley and Ferraris 2001):
Confined flow tests: the material flows under its own weight or under an applied pressure through a narrow orifice.
Free flow tests: the material either flows under its own weight, without any confinement, or an object penetrates the material by gravitational settling.
Vibration tests: the material flows under the influence of applied vibration. The vibration is applied by using a vibrating table, dropping the base supporting the material, using an external vibrator, or using an internal vibrator.
Rotational rheometers: the material is sheared between two parallel surfaces, one or both of which are rotating.
This classification scheme may be considered to be the most consistent with the current understanding of concrete rheology and workability. Koehler and Fowler (2003) summarized comprehensive workability test methods in accordance with the NIST flow-type classification scheme, as shown in Table 1.
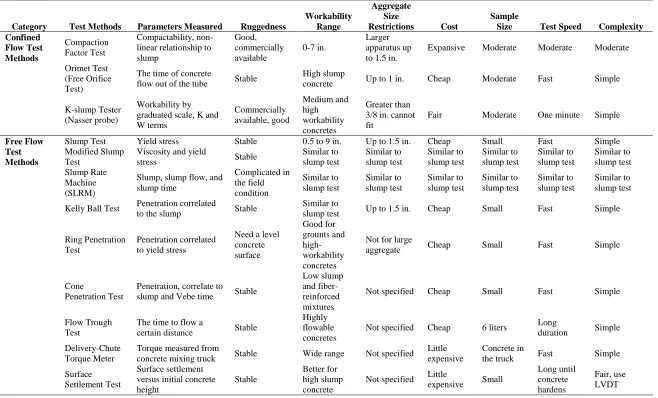
Table 2 (Part 1 and Part 2) summarizes the findings of Koehler and Fowler (2003) for each of the above mentioned methods, including their advantages, disadvantages, and performance criteria.
4
Table 1. Categorization of concrete workability test methods (Koehler and Fowler 2003)
Tests for Conventional Concrete
Confined Flow Tests Vibration Tests
1 Compaction factor test 1 Angles flow box test
2 Orimet test 2 Compaction test
3 K-slump tester 3 Flow table test
4 Inverted slump cone test
Free Flow Tests 5 LCL flow test
1 Cone penetration test 6 Powers remolding test 2 Delivery-Chute depth meter 7 Column test
3 Delivery-Chute torque meter 8 Thaulow tester 4 Flow trough test 9 Vebe consistometer 5 Kelly ball test 10 Vertical pipe apparatus 6 Modified slump test 11 Vibration slope test 7 Moving sphere viscometer 12 Vibropenetrator 8 Ring penetration test 13 Wigmore cosistometer 9 Slump rate machine 14 Vibratory flow meter 10 Slump test
11 Surface settlement test Other Test Methods
1 Multiple single-point test
Low Workability Concrete 2 Soil triaxial test
1 Intensive compaction test 3 Trowel test 2 Kango hammer test
3 Proctor test
Tests for SCC Tests for Paste and Mortar
Confined Flow Test 1 Flow cone test
1 Fill-box test 2 Miniflow test
2 L-box test 3 Minislump test
3 U-box test 4 Turning tube viscometer
4 V-funnel test 5 Vicat Needle test 6 VisoCorder
Free Flow Tests 7 Wuerpel device
1 J-ring test 2 Slump flow test
Stability Tests 1 Penetration test
5
Table 2. Summary of features of existing workability test methods (Part 1)
Category Test Methods Parameters Measured Ruggedness
Workability Range
Aggregate Size
Restrictions Cost
Sample
Size Test Speed Complexity
Confined Flow Test Methods Compaction Factor Test Compactability, non-linear relationship to slump Good, commercially available 0-7 in. Larger apparatus up to 1.5 in.
Expansive Moderate Moderate Moderate
Orimet Test (Free Orifice Test)
The time of concrete
flow out of the tube Stable
High slump
concrete Up to 1 in. Cheap Moderate Fast Simple
K-slump Tester (Nasser probe)
Workability by graduated scale, K and W terms Commercially available, good Medium and high workability concretes Greater than 3/8 in. cannot fit
Fair Moderate One minute Simple
Free Flow Test Methods
Slump Test Yield stress Stable 0.5 to 9 in. Up to 1.5 in. Cheap Small Fast Simple
Modified Slump Test
Viscosity and yield
stress Stable
Similar to slump test Similar to slump test Similar to slump test Similar to slump test Similar to slump test Similar to slump test Slump Rate Machine (SLRM)
Slump, slump flow, and slump time Complicated in the field condition Similar to slump test Similar to slump test Similar to slump test Similar to slump test Similar to slump test Similar to slump test
Kelly Ball Test Penetration correlated
to the slump Stable
Similar to
slump test Up to 1.5 in. Cheap Small Fast Simple
Ring Penetration Test
Penetration correlated to yield stress
Need a level concrete surface Good for grounts and high-workability concretes
Not for large
aggregate Cheap Small Fast Simple
Cone
Penetration Test
Penetration, correlate to
slump and Vebe time Stable
Low slump and fiber-reinforced mixtures
Not specified Cheap Small Fast Simple
Flow Trough Test
The time to flow a
certain distance Stable
Highly flowable concretes
Not specified Cheap 6 liters Long
duration Simple
Delivery-Chute Torque Meter
Torque measured from
concrete mixing truck Stable Wide range Not specified Little expensive
Concrete in
the truck Fast Simple
Surface Settlement Test
Surface settlement versus initial concrete height
Stable
Better for high slump concrete
Not specified Little
expensive Small
Long until concrete hardens
6
Category Test Methods Parameters Measured Ruggedness
Workability Range
Aggregate Size
Restrictions Cost
Sample
Size Test Speed Complexity
Vibration Test Methods
Compaction Test
Degree of compaction -
compactability Stable
Low to moderate slump concrete
Not specified Cheap Small Fast Simple
Vebe Consistometer
Remolding ability of concrete under vibration
Inappropriate for field use
Commonly used for low slump mixtures
Up to 2 in. Expensive Minimum
50 lbs Fair Simple
Powers Remolding Test
Similar to Vebe test, different apparatus
Inappropriate for field use
Commonly used for low slump mixtures
Not specified Fair Similar to
Vebe test Fair Simple
Thaulow Tester Similar to the Powers remolding test, but modified to allow for the measurement of concretes with higher workability
Flow Table Test
Horizontal spread of a cone specimen subjected to jolting
Stable, but place on firm level ground
Wide range of
concrete Not specified Fair
As slump cone test, 0.25 cf
Fast Simple
Angles Flow Box Test
The time of concrete to flow under vibration and pass obstructions
Inappropriate for field use
Moderate slump mixtures
Not specified Fair Fair Fast Simple
LCL Flow Test Similar to Angles flow test, not suitable for very low or very high workability Wigmore
Consistometer
Penetration resistance
by adding energy Stable
Wide range of
concrete Not specified Fair Fair Fast Simple
Inverted Slump Cone Test
Elapsed time from the insertion of the vibrator until all concrete discharged Stable Specially for fiber-reinforced concrete
Up to 1.5 in. Cheap
As slump cone test, 0.25 cf
Fast Difficult to perform
Vertical Pipe Apparatus
Penetration depth versus time
Stable for lab use
Low to moderate slump concrete
Cannot be too large due to the apparatus
Expensive Fair Fair
Fair, use displacement transducer Vibrating Slope Apparatus (VSA)
Discharge rate of concrete falling from the chute to bucket with vibration
Stable Low slump
concrete Not specified Expensive Large Fair Fair
Vibratory Flow
Meter Similar to the LCL flow test, Angles flow box, and the vibrating slope apparatus
Box Test
Visual rates, surface voids and edge slumping
Stable
Slipform paving concrete
May up to 2
7
Category Test Methods Parameters Measured Ruggedness
Workability Range
Aggregate Size
Restrictions Cost
Sample
Size Test Speed Complexity
Methods for Very Low Slump Concrete
Proctor Test
Dry unit weight and corresponding moisture content
Stable Lean, dry
concrete Not specified Cheap Small
Very time
consuming Simple
Kango Hammer Test
Density of compacted
concrete Stable
Low-slump
concretes Not specified Fair
Cubic,
small Fair Simple
Intensive Compaction Test
Density of compacted
concrete Stable
Slump less than about 1 cm
Up to 1.25 in. Expensive
Small cylindrical sample
8
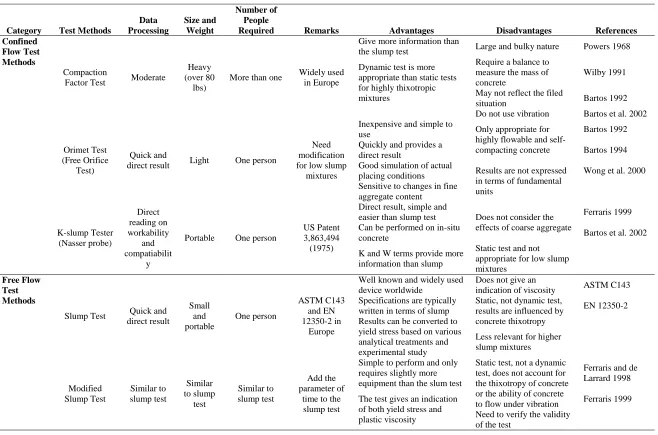
Table 2. Summary of features of existing workability test methods (Part 2)
Category Test Methods
Data Processing Size and Weight Number of People
Required Remarks Advantages Disadvantages References
Confined Flow Test Methods
Compaction
Factor Test Moderate
Heavy (over 80
lbs)
More than one Widely used in Europe
Give more information than
the slump test Large and bulky nature Powers 1968
Dynamic test is more appropriate than static tests for highly thixotropic mixtures
Require a balance to measure the mass of concrete
Wilby 1991
May not reflect the filed
situation Bartos 1992
Do not use vibration Bartos et al. 2002
Orimet Test (Free Orifice
Test)
Quick and
direct result Light One person
Need modification for low slump
mixtures
Inexpensive and simple to
use Only appropriate for
highly flowable and self-compacting concrete
Bartos 1992
Quickly and provides a
direct result Bartos 1994
Good simulation of actual
placing conditions Results are not expressed in terms of fundamental units
Wong et al. 2000
Sensitive to changes in fine
aggregate content K-slump Tester (Nasser probe) Direct reading on workability and compatiabilit y
Portable One person
US Patent 3,863,494 (1975)
Direct result, simple and
easier than slump test Does not consider the effects of coarse aggregate
Ferraris 1999
Can be performed on in-situ
concrete Bartos et al. 2002
K and W terms provide more information than slump
Static test and not appropriate for low slump mixtures Free Flow Test Methods
Slump Test Quick and direct result Small and portable One person ASTM C143 and EN 12350-2 in Europe
Well known and widely used device worldwide
Does not give an
indication of viscosity ASTM C143 Specifications are typically
written in terms of slump
Static, not dynamic test, results are influenced by concrete thixotropy
EN 12350-2
Results can be converted to yield stress based on various analytical treatments and experimental study
Less relevant for higher
slump mixtures Modified Slump Test Similar to slump test Similar to slump test Similar to slump test Add the parameter of
time to the slump test
Simple to perform and only requires slightly more equipment than the slum test
Static test, not a dynamic test, does not account for the thixotropy of concrete or the ability of concrete to flow under vibration
Ferraris and de Larrard 1998
The test gives an indication of both yield stress and plastic viscosity
Ferraris 1999
Need to verify the validity
9
Category Test Methods
Data Processing Size and Weight Number of People
Required Remarks Advantages Disadvantages References
Slump Rate Machine (SLRM) Similar to slump test Similar to slump test Similar to slump test A computer-controlled device
Give an indication of both yield stress and viscosity
Static test, not a dynamic test, does not account for the thixotropy of concrete or the ability of concrete to flow under vibration
Chidiac et al. 2000
A simplified traditional rheometer and less expensive
Requires computer to log data and calculate
Kelly Ball Test Quick and direct result Little heavier than slump test One person Developed in 1950s in US, alternative to the slump test
Faster than the slump test and more accurate in determining consistency than the slump test
Static test Powers 1968
Must be performed on a
level concrete surface Bartos 1992
Provides an indication of yield stress
The test is no longer
widely used Scanlon 1994
Large aggregate can
influence the results Ferraris 1999
Ring Penetration
Test
Quick and
direct result Portable One person
Not a well known test
Easy and simple to perform Static test, perform on a
level concrete surface Wong et al. 2000 Can be performed on in-situ
concrete
Large aggregate can
influence the results
Test is not widely used
and the interpretation of the results is not well known Cone Penetration Test Quick and direct result 4 kg metal cone
One person Not a well known test
Provide a direct result and
easy to perform Static test, not particularly appropriate for fiber-reinforced concrete
Sachan and Kamesawara 1998 Can be performed on in-situ
concrete
Not recorded in fundamental units Flow Trough Test Quick and direct result
1 m long and .23 m wide
One to two persons
Not widely used
Simple and inexpensive Only appropriate for
highly flowable concrete Bartos et al. 2002 Test results are a function of
the time required for the concrete to flow both out of the cone and down the trough
Not standardized and not
widely used
10
Category Test Methods
Data Processing Size and Weight Number of People
Required Remarks Advantages Disadvantages References
Delivery-Chute Torque Meter
Quick and
direct result Portable One person
US Patent 4,332,158 (1982)
Measure the workability of the concrete as it exists the mixer before it is placed
It gives no indication of
plastic viscosity Wong et al. 2000 Readings are made at only
one shear rate
Directly read the torque from device
Device need calibration for each mixture No need computer or other
sensors
Surface Settlement Test
Do not give a direct
result
Fair One person
Can be used for moderate
slump mixtures
Inexpensive and simple to perform
It does not give a direct
result
Appropriate for a wide range of concrete mixtures
Time required to perform the test is longer than other test methods due to the settlement distance must be recorded until concrete hardens
Bartos et al. 2002
Vibration Test Methods Compaction Test Quick and direct result 200 by 400 mm rigid metal containe r One EN12350-4, similar test (Fritsch test)
Provide an indication of the compactability
Difficult to empty for low
slump concrete Bartos et al. 2002 Simple and inexpensive Different compaction
methods cannot be compared directly
Ferraris 1999 Can give an indirect
indication of plastic viscosity when the variable of time is added
May need a computer to facilitate the readings
Vebe Consistometer
Direct
results Heavy At least one
ASTM C1170 (1998)
Dynamic test, can be used on very dry concrete
Size of the device generally unsuitable for field
Bartos 1992
Standardized in ASTM and identified by ACI 211 in its guide for proportioning low slump concrete
Only works for low slump
concretes Bartos et al. 2002 No analytical treatment of
the test method has been developed, shear rate declines during vibration
Scanlon 1994
Test results are directly
obtained
Powers Remolding
Test
Direct
results Heavy At least one
ASTM C124 (Withdrawn in 1973)
Dynmaic test and suitable for low slump concretes
Only works for low slump
concretes Powers 1968
Test results are directly obtained
Size of the device generally unsuitable for field
Scanlon 1994
No analytical treatment of
the test method has been developed, shear rate declines during vibration
Wong et al. 2000
11
Category Test Methods
Data Processing Size and Weight Number of People
Required Remarks Advantages Disadvantages References
Thaulow Tester
Similar to the Powers remolding test, but modified to allow for the measurement of concretes with higher workability
Measure higher workability than that measured with the Vebe and the Powers remolding test
Size of the device generally unsuitable for field
ACI 211.3R-02 (2002)
No analytical data are
available
Flow Table Test
Direct
results Fair One person
DIN 1048 and EN12350-5
Simple and can be used in the field
Does not represent actual
placement conditions Tattersall 1991 Direct result Results tend to converge
as the number of drops is increased
Wong et al. 2000 Appropriate for highly
thixotropic concrete Bartos et al. 2002
An analytical treatment of
the test is difficult
Angles Flow Box Test
Direct
results Fair One person
Similar concept for SCC mixtures
Represent actual field conditions
Not be appropriate for
field use Scanlon 1994
Dynamic test that subjects concrete to vibration
Results are likely a function of yield stress and viscosity, but the values are not directly recorded
Wong et al. 2000
The ability of concrete to pass obstructions and resist segregation is assessed
LCL Flow Test Similar to Angles flow test, not suitable for very low or very high workability
Similar to Angles flow box test
More expensive, requires
electricity, not precise Bartos 1992
Wigmore Consistometer
Direct
results Large One person -
Dynamic test The drop ball need to be larger than the maximum coarse aggregate size
Scanlon 1994 Wide range of concrete
workability
Device is too large and
bulky for field use
Inverted Slump
Cone Test Direct
Small and portable One person ACI Committee 544 recommended
Dynamic test considering the high thixotropy of fiber-reinforced concrete
Appropriate for less than 2
in. slump mixtures Tattersall and Banfill 1983 Operation is tricky to
maintain consistency
Simple and direct results Long fibers may wrap around the vibrator
ASTM C995-01 (n.d.)
Readily available apparatus Important test parameters
are not standardized Bartos et al. 2002
Vertical Pipe Apparatus
Direct
results Fair
More than one person
Behaves as a Newtonian
fluid subjected to
vibration
Dynamic and provide valuable information
Expensive and may not be
suitable for field use Tattersall and Baker 1989 By changing the vibration
parameters, the test can be used to determine values related to yield stress and viscosity
Pipe has 60 mm opening may too small for sizes
Banfill et al. 1999
12
Category Test Methods
Data Processing Size and Weight Number of People
Required Remarks Advantages Disadvantages References
Vibrating Slope Apparatus (VSA) Direct results Very heavy
More than two people
Developed in the 1960s, modified by
FHWA
Measure low slump concrete Very large, bulky, and
heavy device Wong et al. 2000
Results can be correlated to yield stress and viscosity
Results have not been verified analytically Need a notebook
computer to record data It is designed to be rugged
for field use
Vibration is limited and shear rate is non-uniform
Vibratory Flow Meter
Similar to the LCL flow test, Angles flow box, and the vibrating slope apparatus
Simple and direct results
Not effective in
distinguishing changes of mixtures
Szescy 1997
Readily available equipment and materials
Different vibrators result in varied results
Box Test Direct
results Fair One person
Developed from Okalahoma
State University
Simulate actual placement conditions
More work is needed to
verify the rating scale Cook et al. 2013 Simple and does not require
expensive equipment No field data is available
Suitable for slip-form paving concrete
No specifications for evaluating the edge slumping
Repeatability is good for
single and muti-operators
Methods for Very Low Slump Concrete
Proctor Test Direct results
Small and portable
One person Designed for soil test
Can be used for low slump mixtures
Does not incorporate vibration and can be only used for low slump concretes
ASTM D698
The test is simple and well
known ASTM D1557
Very time consuming,
need preparation Kango Hammer Test Direct results Larger than proctor test
One person Designed for soil test
With vibration and pressure, the test accurately simulates field placmeent conditions
Hammer is not specified, making comparisons of the test results difficult
Juvas 1994 Bartos, et al. 2002
Simple and easy to perform The apparatus is large and requires electricity Intensive Compaction Test Direct results About
120 lbs One person
Nordtest-Build 427, US
patent 4,794,799 (1989) and 4,930,346 (1990)
Accurately measure small changes in proportions
Equipement is expensive compared to proctor test, 150 mm model is too heavy for field use
Juvas 1990
Simulate low slump
roller-compacted concretes Tattersall 1991
Fast and computer controlled The test does't incorporate vibration, which is commonly used in placing of low slump concrete
Juvas 1994
Smaller model is feasible for
13 VKELLY TEST METHOD
Background
The Kelly ball test—the basis of the VKelly test described in this report—was developed in the 1950s in the United States as a fast alternative method to the slump test (Powers 1968, Ferraris 1999, Bartos et al. 2002). It is not an expensive test and can be quickly performed in situ. Typically, the value of slump is 1.10 to 2.00 times the Kelly ball test reading. Scanlon (1994) claimed that the Kelly ball test is more accurate in determining consistency than the slump test. The Kelly ball test is applicable to a similar range of concrete consistencies as the slump test and is also appropriate for special concrete, such as lightweight and heavyweight concrete. Bartos (1992) stated that the precision of the test declines with the increasing size of coarse aggregate.
[image:27.612.188.425.358.591.2]The Kelly ball test apparatus consists of a 6 in. diameter, 30 lb. steel ball attached to a stem, as shown in Figure 1. The penetrator is attached to a shaft graduated to measure penetration to the nearest ¼ in. About 3 ft.2 of the concrete surface is struck off level, the ball is placed on the surface, released, and the depth of penetration is recorded. Three measurements should be made for each sample.
Figure 1. Kelly ball test apparatus (Koehler and Fowler 2003)
The test was formerly standardized in ASTM C360-92, Standard Test Method for Ball
14
Ferraris (1999) stated that the Kelly ball test provides an indication of yield stress, because the test essentially measures whether the stress applied by the weight of the ball is greater than the yield stress of the concrete. However, this test may not be able to give valuable information when testing on very low-slump concrete or highly thixotropic concretes where energy is required to overcome the initially high-yield stress at rest.
Overview of VKelly Test
[image:28.612.224.389.250.472.2]As shown in Figure 2, a VKelly test apparatus consists of a Kelly ball with a vibrator attached. The ball is trimmed to maintain the original weight of 30 lbs. This means that the VKelly test apparatus can still be used to measure slump statically.
Figure 2. VKelly test apparatus
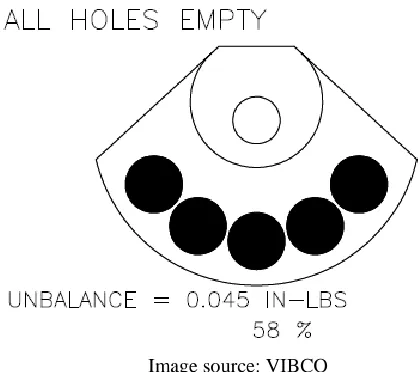
Initial tests indicated that the vibrator selected was providing too much energy to the system. Smaller devices were considered, but none were capable of delivering the desired frequency discussed below. Instead, the eccentric weight within the vibrator was drilled out reduce its mass. 5 holes were drilled, each 3/8 in. diameter (as shown in Figure 3). The characteristics of the
15
[image:29.612.187.397.71.257.2]Image source: VIBCO
Figure 3. Modified eccentric weight in vibrator
Tymkowicz and Steffes (1996) concluded that the Iowa Department of Transportation
specification of 5,000 to 8,000 vibrations per minute (vpm) for slipform pavers is effective for normal paver speeds while maintaining a good air-void structure. In order to simulate the vibrator frequency recommended for slipform paving, the vibrator speed is set at 6,000 vpm using a variable transformer, as shown in Figure 4.
Figure 4. Variable transformer
[image:29.612.231.383.387.596.2]16
Figure 5. Adjustable steel frame to stabilize the VKelly apparatus
VKelly Test Procedure
The following test procedures are conducted, as shown in Figure 6:
Figure 6. Completed VKelly test
Similar to the Kelly ball test, fresh concrete should be discharged into a wheelbarrow, buggy, or other container. The depth of concrete above the bottom of the container or reinforcement should be at least 6 in. for 1 in. aggregate or smaller and 8 in. for larger aggregate.
The tested concrete surface should be struck off level over an area of about 3 ft.2. Do not tamp, vibrate, or consolidate the concrete manually. Screed the minimum amount required to obtain a reasonable level surface. Do not overwork the surface because it may flush excess mortar to the surface, causing erroneously high penetration readings (California Test 533 2014).
[image:30.612.201.408.350.518.2]17
penetration is due to the dead load of the ball only and is not affected by any force generated by the acceleration of the mass. Record the second reading to the nearest 0.1 in. when the ball comes to rest.
Turn on the vibrator, which has been pre-set to run at 6,000 vpm, and simultaneously start the timer. Record the readings on the graduated stem at 6 second intervals up to 36 seconds. A video recorder can be used to record the test, and the data can be collected later using the timer in the camera and by observing the graduated stem.
Remove the VKelly apparatus and dump the tested concrete back into a mixer to remix for 30 seconds. Repeat twice. The reported penetration is the average of the three readings, which should agree within ½ in. of penetration at any given time.
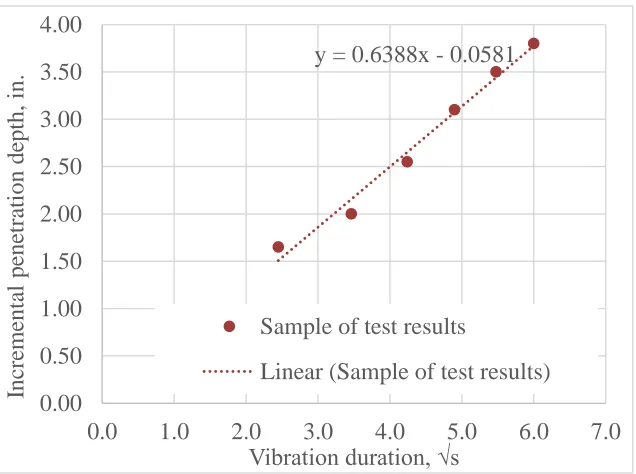
Plot the average readings in inches (vertical scale) against the square root of the time in seconds (horizontal scale) (see Figure 7), and determine the slope of the best fit line through the data (Equation 1).
Report the initial penetration (c) in inches and the slope (V) in in./√s.
𝐷𝑝𝑒𝑛𝑒 = 𝑉𝑖𝑛𝑑𝑒𝑥× √𝑡 + 𝑐 (1)
where,
Dpene = penetration depth at time t t = elapsed time of vibration c = initial penetration V = VKelly Index
[image:31.612.148.466.451.688.2]The static part of the test should agree well with the slump, allowing for a multiplication factor of 2. Incremental depth data do not include the multiplication factor.
Figure 7. Sample plot of VKelly test results
y = 0.6388x - 0.0581
0.00 0.50 1.00 1.50 2.00 2.50 3.00 3.50 4.00
0.0 1.0 2.0 3.0 4.0 5.0 6.0 7.0
Inc
re
menta
l
pe
ne
tra
ti
on
de
pth, i
n.
Vibration duration, √s Sample of test results
18 WORK CONDUCTED
The work to evaluate and refine the test was conducted in three phases. The first phase was to assess whether the VKelly test can signal variations in laboratory mixtures with a range of materials and proportions. A series of mixtures was prepared and tested using the following process:
Make a control mixture
Incrementally adjust a single ingredient
Conduct slump and VKelly test
Repeat for other ingredients
The repeatability for single operator and multiple operators were evaluated during the laboratory mixing process.
The second phase was to run the VKelly test in the field at a number of construction sites.
The third phase was to validate the VKelly test results using the Box Test developed at Oklahoma State University for slipform paving concrete.
Phase I (Laboratory Test)
Matrix
The matrix was selected to obtain the most information within the constraints of the project.
Base Mixture
564 lb./yd.3 ordinary portland cement
5% total air content
45/55 fine/coarse aggregate ratio
0.45 w/cm
Variables
Sand: increments of 100 lb./yd.3 (+1, +2, +4, -1, -2, and -4)
Air: increments of 1% (+2 and -2)
Class C fly ash: increments of 10% (+1, +2, and +3)
Water: increments of 1 gallon/cubic yard (+1 and +2)
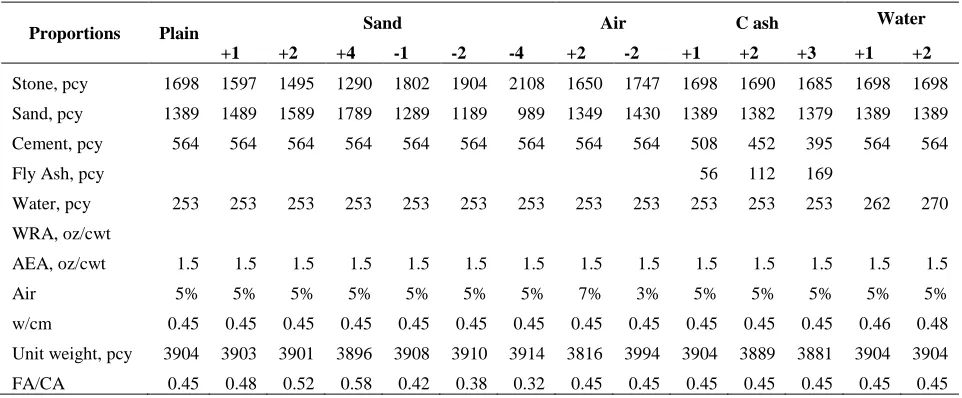
19 Table 3. Mix proportions
Proportions Plain Sand Air C ash Water
+1 +2 +4 -1 -2 -4 +2 -2 +1 +2 +3 +1 +2
Stone, pcy 1698 1597 1495 1290 1802 1904 2108 1650 1747 1698 1690 1685 1698 1698
Sand, pcy 1389 1489 1589 1789 1289 1189 989 1349 1430 1389 1382 1379 1389 1389
Cement, pcy 564 564 564 564 564 564 564 564 564 508 452 395 564 564
Fly Ash, pcy 56 112 169
Water, pcy 253 253 253 253 253 253 253 253 253 253 253 253 262 270
WRA, oz/cwt
AEA, oz/cwt 1.5 1.5 1.5 1.5 1.5 1.5 1.5 1.5 1.5 1.5 1.5 1.5 1.5 1.5
Air 5% 5% 5% 5% 5% 5% 5% 7% 3% 5% 5% 5% 5% 5%
w/cm 0.45 0.45 0.45 0.45 0.45 0.45 0.45 0.45 0.45 0.45 0.45 0.45 0.46 0.48
Unit weight, pcy 3904 3903 3901 3896 3908 3910 3914 3816 3994 3904 3889 3881 3904 3904
FA/CA 0.45 0.48 0.52 0.58 0.42 0.38 0.32 0.45 0.45 0.45 0.45 0.45 0.45 0.45
Materials
The following materials were considered as part of the matrix:
Type I/II portland cement
Class C fly ash
Local coarse (1 in. limestone) and fine (gravel) aggregate
MB AE 90 air-entraining admixture
20
Figure 8. Gradations of coarse and fine aggregates
Table 4. Chemical compositions of cementitious materials
Chemical Composition
Type I/II Cement
Class C Fly Ash
SiO2 20.10 42.46
Al2O3 4.44 19.46
Fe2O3 3.09 5.51
SO3 3.18 1.20
CaO 62.94 21.54
MgO 2.88 4.67
Na2O 0.10 1.42
K2O 0.61 0.68
P2O5 0.06 0.84
TiO2 0.24 1.48
SrO 0.09 0.32
BaO - 0.67
LOI 2.22 0.19
Tests
The following tests were conducted on samples collected from all of the mixtures:
Fresh properties, including slump (ASTM C 143), air content (ASTM C 231), and unit weight (ASTM C 138)
VKelly test 0 10 20 30 40 50 60 70 80 90 100
1-1/2"
1"
3/4"
1/2"
3/8"
No. 4
No. 8
No. 16
No. 30
No. 50
No. 100
No. 200
P
er
ce
n
t
P
assi
n
g
Sieve Size
[image:34.612.65.330.328.536.2]21
Laboratory Test Results
The test results are shown in Table 5. The VKelly Index gives the test results for the comparison of multiple operators. The percent difference varies from 0.00% to 8.31% for the same test performed by two operators.
[image:35.612.68.546.259.658.2]The index seems not to be linearly correlated to slump results, which confirms that the dynamic VKelly test can indicate more information about a mixture, such as thixotropy, than a static slump test.
Table 5. Laboratory test results
Mix
Slump, in.
Slump Measured by VKelly Test, in.
Air Content, %
Unit Weight,
lb./yd.3
VKelly Index
in/√s VKelly Index Statistics Oper 1 Oper 2 Δ %, Δ
Sand -4 0.75 0.80 4.8 152.4 0.47 0.45 0.49 -0.04 8.31
Sand -2 0.75 1.00 5.3 149.0 0.46 0.46 0.47 -0.01 2.15
Sand -1 0.75 1.00 4.5 151.4 0.46 0.45 0.48 -0.03 6.45
Sand +1 1.00 1.00 5.5 146.4 0.57 0.58 0.56 0.02 2.63
Sand +2 1.00 1.75 5.4 149.6 0.50 0.50 0.49 0.01 2.02
Sand +4 1.10 1.20 4.5 148.9 0.73 0.72 0.74 -0.02 2.74
Air +2 1.50 2.00 7.0 147.4 0.66 0.66 0.66 0.00 0.30
Air -2 1.00 1.00 5.8 147.4 0.64 0.63 0.65 -0.02 3.13
C Ash +1 1.00 1.50 5.0 148.0 0.63 0.64 0.62 0.02 3.17
C Ash +2 1.00 1.10 5.0 148.3 0.68 0.68 0.68 0.01 0.74
C Ash +3 1.25 1.50 5.5 147.4 0.72 0.71 0.73 -0.02 2.09
MAX 1.25 1.50 7.3 148.7 0.69 0.69 0.70 -0.01 1.30
Plain 1.00 1.25 4.5 147.6 0.58 0.58 0.59 -0.01 2.06
Plain(2) 1.00 1.10 4.7 147.8 0.61 0.61 0.61 -0.01 0.99
Plain(2) + 1 Gal - 1.25 - - 0.70 0.72 0.69 0.03 4.40
Plain(2) + 2 Gal - 1.60 - - 0.74 0.74 0.73 0.01 1.36
Plain(3) 1.25 1.10 5.2 148.6 0.62 0.61 0.63 -0.02 3.38
Plain(4) 1.25 0.90 5.5 148.0 0.68 0.67 0.68 -0.01 1.48
Plain(3) 15 mins - 1.35 - - 0.61 0.60 0.62 -0.02 3.11
Plain(3) 30 mins - 1.05 - - 0.61 0.61 0.62 -0.01 1.80
Plain(3) 45 mins - 0.90 - - 0.55 0.55 0.54 0.01 1.83
Plain(4R) mix - 1.00 - - 0.67 0.66 0.69 -0.03 3.86
Plain(4R) 15 mins - 1.05 - - 0.67 0.65 0.69 -0.04 5.37
22
[image:36.612.118.497.129.366.2]The plain mix testing was repeated four times to check the repeatability with a single operator. The measured VKelly Index for the repeated mixes is shown in Figure 9. The standard deviation of the index for the four mixes is 0.037 and is marked as error bars in the plot.
Figure 9. VKelly Index for plain mixes
In order to check the influence of elapsed time and remixing on the VKelly Index for the same mix, the index was measured on one of the four plain mixes at 15 minute intervals up to 45 minutes elapsed time. The index declined as elapsed time increased, as shown in Figure 10. One of the plain mixes was tested right after mixing, right after remixing, and at 15 minutes after remixing, denoted as Plain(4), Plain(4) Remix, and Plain(4) Remix@15 minutes in Figure 10, respectively. The index results are identical for the three measurements. The error bars represent the standard deviation of all the plain tests, i.e., 0.041.
0.40 0.45 0.50 0.55 0.60 0.65 0.70 0.75 0.80 0.85
Plain Plain(2) Plain(3) Plain(4)
V
Ke
ll
y
index
, in/
23
[image:37.612.124.488.378.597.2]Figure 10. Influence of elapsed time and remixing on VKelly Index
Figures 11 to 14 give the effects of varying fine aggregate content, Class C fly ash, air content, and water content on the VKelly Index. In broad terms, increasing sand content can be seen to increase VKelly Index, as expected (Figure 11).
Figure 11. Influence of fine aggregate content on VKelly Index
The index increases linearly with an increased Class C fly ash replacement dosage up to 30%. The Class C fly ash replacement level seems to linearly change the VKelly Index (Figure 12).
0.40 0.45 0.50 0.55 0.60 0.65 0.70 0.75 0.80 0.85
VK
ell
y
index
, in/
√s
0.40 0.45 0.50 0.55 0.60 0.65 0.70 0.75 0.80 0.85
Sand-4 Sand-2 Sand-1 Plain Sand+1 Sand+2 Sand+4
VK
ell
y
index
, in/
24
Figure 12. Influence of Class C fly ash replacement on VKelly Index
It is not clear why the variation with air content was nonlinear (Figure 13).
Figure 13. Influence of air content on VKelly Index
As expected, adding water to the system increased workability and the VKelly Index (Figure 14).
0.40 0.45 0.50 0.55 0.60 0.65 0.70 0.75 0.80 0.85
Plain C Ash+1 C Ash+2 C Ash+3
VK
ell
y
index
, in/
√s
0.40 0.45 0.50 0.55 0.60 0.65 0.70 0.75 0.80 0.85
Air-2 Plain Air+2
VK
ell
y
index
, in/
[image:38.612.126.488.340.555.2]25
Figure 14. Influence of water content on VKelly Index
Phase II (Field Test)
The VKelly test was conducted on several slipformed highway paving sites in the states of Minnesota (MN) and Missouri (MO) (Figure 15).
Figure 15. VKelly test conducted in the field
The test results are shown in Figure 16. Sites A through H represent the sites in MN, and Site MO is the only test site in MO. The laboratory mix, Plain(3), is included in the plot for comparison purposes.
0.40 0.45 0.50 0.55 0.60 0.65 0.70 0.75 0.80 0.85
Plain Plain(2) Water+1 Plain(2) Water+2
VK
ell
y
index
, in/
[image:39.612.175.440.418.636.2]26
Figure 16. Field test results
Table 6 summarizes the mix proportions, site information, environmental conditions, and test results of each visited site. The VKelly test measured slump for all of the slipform paving mixes; results ranged from 1.0 to 2.0 in. Based on the mix proportions, the lower index value at Site C can be attributed to the lower fly ash replacement dosage (i.e., 20%, while most of others were 30%). Sites F through H generally exhibited higher index values, which are likely due to the effect of modifying the aggregate system on thixotropy, i.e., either introducing coarse sand or intermediate coarse aggregate. Site MO had the lowest cementitious materials content and the highest daily average temperature compared to other sites, which can be a reason why this site had the lowest index value.
0 1 2 3 4 5 6 7
0.0 2.0 4.0 6.0 8.0
Inc
re
menta
l
pe
ne
tra
ti
on
de
pth, i
n.
√time, s
Plain(3) Site A Site B Site C Site D
27
Table 6. Mix proportions, site information, and field test results
Site ID Site A Site B Site C Site D Site E Site F Site G Site H Site MO Date 7/17/14 7/18/14 7/22/14 7/21/14 8/14/14 8/15/14 8/29/14 9/12/14 8/27/14
Cement 400 400 547 400 400 400 400 400 390
Fly Ash 170 175 137 170 171 160 171 172 130
Water 228 210 260 215 211 190 211 206 213
Sand 1255 1217 1246 1404 1278 1177 1087 747 1270
Coarse Sand - - - 404 560 -
Coarse Agg. 1806 1560 1652 1649 1839 1367 1616 1806 1397
Intermediate Agg. - - - 636 - - 508
Aggregate Type Limestone Limestone Limestone Quartzite Granite Gravel Gravel Gravel Limestone
Air Entraining Agent Yes Yes Yes Yes Yes Yes Yes Yes Yes
Water Reducer Type A Type A Type A Type A Type A Type A Type A Type A WRDA 82
Air Content 7% 7% 7% 7% 7% 7% 7% 7% 6%
Location 16th st. I-90 EB TH 22 CSAH 23 TH 24 TH 65 TH 169 I-35E Hwy K
Pavement Type Reconstruct Unbounded
overlay Reconstruct
Bonded overlay
Bonded overlay
Overlay using fabric
- Unbounded
overlay
New pavement
Pavement Thickness (in.) 9.0 9.5 9.0 5.0 4.0 6.0 - 8.0 12.0
Joint Spacing (ft.) 15.0 15.0 15.0 6.0 6.0 12.0 - 15.0 -
Saw Type Early entry Conv. Conv. Conv. Conv. Conv. Conv. Conv. Conv.
Average Temp. ˚F 66 69 74 79 64 72 73 48 82
VKelly Slump, in 2.00 1.75 2.25 1.50 1.00 1.50 1.00 1.00 1.00
VKelly Index, in/√s 0.81 0.82 0.71 0.82 0.80 0.84 0.87 0.86 0.61
Phase III (Validation of VKelly Test Results)
A limitation of the mixtures tested thus far was that all of them may be considered reasonable systems for paving, making it difficult to assess the limits of what may be considered “good” or “bad” data points.
As part of another program investigating concrete mixture proportioning (Taylor et al. 2015), mixtures were being prepared that were deliberately dry to deliberately wet, allowing the team to conduct VKelly tests on a wide range of mixture workabilities.
28
Fresh concrete properties were measured using the slump test (ASTM C143 2012), air content test (ASTM C231 2014), the VKelly test, and the Box Test (Cook et al. 2014).
Figure 17 (a) and (b) present the slump and VKelly Index versus binder content, respectively.
(a)
(b)
Figure 17. Slump (a) and VKelly Index (b) versus binder content
Similar trends can be seen in that both the slump and the VKelly Index increase with increased binder content. The aggregate system that fit the Tarantula curve generally gave a better
0 1 2 3 4 5 6 7 8
400 450 500 550 600 650
Slump
, in
.
Binder content, lb./yd.3
G1.0 50
LS1.0 50
G1.0 Tarantula
LS1.0 Tarantula
0 0.2 0.4 0.6 0.8 1 1.2 1.4 1.6
400 450 500 550 600 650
VKe
lly
In
d
ex
in
/
√s
Binder content, lb./yd.3
G1.0 50
LS1.0 50
G1.0 Tarantula
[image:42.612.116.496.146.651.2]29
workability, and, surprisingly, the limestone coarse aggregate was more workable than the gravel at similar binder contents.
[image:43.612.116.496.202.424.2]The Box Test visual rating was assessed for each mix and plotted, as shown in Figure 18. Based on Cook et al. (2014), a Box Test visual rate of 2 is an acceptable ranking and corresponds to a minimum VKelly Index of 0.8 in/√s, which is consistent with the field observations. A VKelly Index of 1.4 in/√s was observed in a mixture with a 3 in. slump, which may be considered too wet for paving; therefore, a value of 1.2 in/√s may be a reasonable upper limit.
Figure 18. Box Test visual rating versus VKelly Index
0.0 0.5 1.0 1.5 2.0 2.5 3.0 3.5 4.0 4.5
0 0.2 0.4 0.6 0.8 1 1.2 1.4 1.6
Box
Te
st
vis
u
al
ra
tin
g
30 CONCLUSIONS AND FUTURE WORK
Conclusions drawn from this study and future work are summarized below.
Conclusions
The data collected to date indicate the following:
The VKelly test method appears to be suitable for assessing a mixture’s response to vibration (workability).
The VKelly test can report both static and dynamic characteristics while simulating the effect of vibration from paving.
Multiple-operator variability for the VKelly test appears to be up to 8.3%.
The VKelly test can be operated in the field, but the intended use is mostly in the laboratory to help design mixtures that perform as required.
Based on the data collected to date, a VKelly Index in the range of 0.8 to 1.2 in./√s seems to indicate a mixture that is likely to be suitable for slipforming.
It is intended that this test will primarily be used for mixture design purposes, but the test may also find some use as a quality control tool in the field.
Future Work
Further work is required to improve and further validate the VKelly test:
The recommended ranges should be confirmed both in the laboratory and in the field.
The frame should be refined so that the system can be operated by one person.
31 REFERENCES
Abrams, D.A. 1922. Proportioning Concrete Mixtures. ACI Journal, Proceedings, 18(2), 174– 181.
ACI 116R-00. 2000. Cement and concrete terminology. American Concrete Institute Committee 116, Farmington Hills, MI.
ACI 211.3R-02. 2002. Guide for selecting proportions for no-slump concrete. American Concrete Institute Committee 211, Farmington Hills, MI.
ASTM C29. 2009. Standard test method for bulk density (“unit weight”) and voids in 419 aggregate. American Society for Testing and Materials, West Conshohocken, PA. ASTM C143/C143M. 2012. Standard test method for slump of hydraulic-cement concrete.
American Society for Testing and Materials, West Conshohocken, PA.
ASTM C231. 2014. Standard test method for air content of freshly mixed concrete by the 425 pressure method. American Society for Testing and Materials, West Conshohocken, PA. ASTM C360-92. Test method for ball penetration in freshly mixed hydraulic cement concrete
(Withdrawn 1999). ASTM International, West Conshohocken, PA.
ASTM C995-01. Standard test method for time of flow of fiber-reinforced concrete through inverted slump cone (Withdrawn 2008). ASTM International, West Conshohocken, PA. ASTM C1170-91. 1998. Standard test methods for determining consistency and density of
roller-compacted concrete using a vibrating table. ASTM International, West Conshohocken, PA.
Banfill, P.F.G., Yongmo, X., and Domone, P.L.J. 1999. Relationship between the rheology of unvibrated fresh concrete and its flow under vibration in a vertical pipe apparatus.
Magazine of Concrete Research, 51(3), 181–190.
Bartos, P.J.M. 1992. Fresh Concrete: Properties and Tests. Elsevier Science Publishers, Amsterdam.
Bartos, P.J.M. 1994. Assessment of properties of underwater concrete by the Orimet test. In P.J.M. Bartos, Ed., Proceedings, Special Concretes: Workability and Mixing. RILEM, Paisley, Scotland, 191–200.
Bartos, P.J.M., Sonebi, M., Tamimi, A.K. (Eds.). 2002. Workability and rheology of fresh
concrete: compendium of tests. RILEM TC 145-WSM. RILEM, France.
Chidiac, S.C., Maadani, O., Razaqpur, A.G., and Mailvaganum, N.P. 2000. Controlling the quality of fresh concrete. Magazine of Concrete Research, 52(5), 353–363.
Cook, D., Ghaeezadeh, A., and Ley, T. 2013. Investigation of optimized graded concrete for Oklahoma. Final Report OTCREOS11.1-38-F. Oklahoma State University, Stillwater, OK.
Cook, D., Ghaeezadah, A., and Ley, T. 2014. A workability test for slip formed concrete pavements. Construction and Building Materials, 68, 376–383.
EN12350-2:2000. 2000. Testing fresh concrete – Part 2: Slump test. European Committee for Standardization, Brussels, Belgium.
EN12350-3:2000. 2000. Testing fresh concrete – Part 3: Vebe test. European Committee for Standardization, Brussels, Belgium.
EN12350-4:2000. 2000. Testing fresh concrete – Part 4: Degree of compactability. European Committee for Standardization, Brussels, Belgium.