International Journal of Engineering
J o u r n a l H o m e p a g e : w w w . i j e . i rModified Structure Function Model Based on Coherent Structures
M. Nourollahi, M. Farhadi*, K. Sedighi
Faculty of Mechanical Engineering, Babol University of Technology, Babol, Islamic Republic Islamic of Iran.
P A P E R I N F O
Paper history:
Received 31 October 2012
Recivede in revised form 24 December 2012 Accepted 24 January 2013
Keywords:
Structure Function Coherent Structure Square Cylinder Large Eddy Simulation Adapted Coefficient
A B S T R A C T
In the present study, a Modified Structure Function is introduced. In this Modified Structure Function model, the coefficient of model was computed dynamically based on the coherent structure in the flow field. The ability of this Modified Structure Function was investigated for complex flow over a square cylinder in free stream and a low aspect ratio cylinder confined in a channel. The results was compared with experimental data, standard structure function and Coherent Structure Model which use a dynamically method to computed the coefficient of Smagorinsky model based on coherent structure in the flow field. The results show that Modified Structure Function improved the stability and accuracy of simulation in comparison to Coherent Structure Model and standard structure function model.
doi:10.5829/idosi.ije.2013.26.05b.09
1. INTRODUCTION 1
Turbulent flow appears in many engineering applications. Therefore, correct simulation of turbulent flow is very significant in fluid mechanics and many researchers try to understand turbulence mechanism by numerical methods [1-3]. The most accurate method for this purpose is direct numerical simulation (DNS), but this method is very expensive and is restricted to low Reynolds numbers. Many researchers introduced different models to simulate turbulent flow accurately with low cost such as RANS models, Reynolds Stress models, Large Eddy Simulation, etc. Results show that LES models could simulate the turbulent flow more precisely compared to other methods because in LES, the total cascade of energy is not modeled and just subgrid scales are modeled. As a result, LES has been used in different engineering and scientific applications by different researchers [4-6]. It should be mentioned that Large Eddy Simulation needs finer grid in comparison to other models, but, its relevant grid points are severely less than those of DNS.
There are many models for Large Eddy Simulation. Physical space models, particularly, viscous models are more practical than other models because of their usage in engineering problems. Smagorinsky model is one of
* Corresponding Author Email: [email protected] (M. Farhadi)
famous models in this category. In this model the subgrid scale viscosity is defined as :
2 2 1/2
( , ) ( ) (2 ( , ) ) sgs x t Cs S x t
n = D
where Csis model constant coefficient. Results
models which are based on Germano procedure. It should be mentioned that there are some dynamic procedures that are not based on Germano procedure, such as multilevel dynamic procedure developed by Terracol and Sagaut [13]. Numerical results show that the dynamic models usually are unstable and need numerical contrivances such as clipping or averaging in the directions of statistical homogeneity. Consequently, the ability of dynamic models can be restricted in complex geometries.
Many researchers have attempted to introduce easier models to adapt the coefficient of subgrid scale model to local state of the flow, for example: Wall Adaptive Large Eddy model [14], Selective Structure model (SSF) [15], Coherent structure model (CSM) [16], etc. In CSM, the model coefficient is composed of a fixed model-parameter and a coherent structure function. Consequently, the coefficient of subgrid scale modeling is calculated locally. Moreover, Kobayashi [17] applied this model to complex geometry such as diffuser, jet and backward step and showed that the result of CSM is same as dynamic model. Kobayashi only used his procedure for Smagorinsky model which uses only strain rate. It should be noted that some authors such as Nicoud and Ducros [14] stated that a better model can be obtained by using both strain rate and rotation rate in computing the subgrid scale viscosity. This requirement is considered in Structure Function model [18]. But, this model suffers from some shortcomings similar to those in Smagorinsky model (constant coefficient).
In this paper a modified structure function was introduced. In this modified structure function the constant coefficient of standard structure function is computed locally based on coherent structure procedure. Consequently, it is tried to introduce a semi dynamic model which the constant coefficient of the model computed locally in time and space. In addition, both strain and rotation rate in computing the viscosity of subgrid scale model have been considered. The ability of this Modified Structure Function was investigated for complex flow over a square cylinder in free stream and a low aspect ratio cylinder confined in a channel. The results was compared with experimental data, standard structure function and Coherent Structure Model
2. MATHEMATICAL FORMULATION AND SUBGRID SCALE MODELING
Large eddy simulation is based on the idea that it is not necessary to model the total of cascade of energy (transform of energy from large scale to small scale) such as RANS models, RSM models and so on. In large eddy simulation, the resolved scales are simulated
directly and subgrid scales (SGS) are modeled. For this purpose a filter has been introduced.
( , )i ( , )i x( i i) i,
f x t =
ò
f y t GD x -y dy f¢= -f f (1)where
f
ndf
¢ are the resolved and subgrid scale components, respectively. GDX( )xi is the filtering function. One famous filtering function which is usually used in large eddy simulation is top hat filter. By applying this filter on Navier-Stokes equations, these equations can be represented as follows:0 i i u x ¶ = ¶ (2) 2 1 ( ) Re ij i
i j i
i j
u u u P u
t t x x
t
¶ + ¶ = -¶ + D
-¶ ¶ ¶ ¶ (3)
where ui , P and tij are the velocity
components, pressure and stress tensor of subgrid scales, respectively. In the above equations, the stress tensor of subgrid scales should be modeled. In Functional modeling for large eddy simulation, it is supposed that the effect of subgrid scales on resolved scales is same as viscous effect. Therefore, the stress tensor of subgrid scales is computed as follows:
1
( )
3 j i
ij s g s k k ij
j i
u u
x x
t =n ¶ + ¶ + t d
¶ ¶ (4)
where usgs is the viscosity of subgrid scales and is modeled by different subgrid scale models.
2. 1. Modiied and Standard Structure Function Model M´etais and Lesieur [18] introduced Structure Function Model (SF) by transferring their constant effective viscosity model into the physical space. The authors supposed that the energy at cutoff can be estimated by the second-order velocity structure function. In this model, the eddy viscosity is evaluated according to:
3 2
2
( , , ) 0 .1 0 5 ( , , ) S F
t c t Ck c F c t
n x D = - D x D (5)
where 13
1 2 3
( )
c x x x
D = D ´ D ´ D , C
k and F2 is Kolmogorov constant (Ck≈1.97) and structure function respectively. Structure function is computed by resolved scale velocity as:
[ ] [ ] 2 2 3 3 2 2 1 ( , ) ( , ) 1 ( , , )
6 ( , ) ( , )
i
i i i
x t x x t c
F c t
x
x t x x t
=
- + D + æ D ö
D = çD ÷
è ø
- - D
å u u
x
u u (6)
study, it is tried to calculate constant coefficient of standard SF model by coherent structure procedure. In the standard coherent structure procedure the coefficient of model is calculated locally as follows [16, 17]:
S CSM CS
C =C F FW (7)
where:
(8)
(9)
(10)
(11)
where CCSMis a fixed model constant, FC S the coherent structure function defined as the second invariant normalized by the magnitude of a velocity gradient tensor E, FW the energy-decay suppression function and Wij the vorticity tensor in a resolved flow field. Moreover, FC S and FW have definite upper and lower limits:
1 FCS 1, 0 FW 2
- £ £ £ £ (12)
In order to use this procedure with SF model, the fixed model constant (CCSM) should be adapted. For calculating this constant, an isotropic turbulent case (fully developed turbulent channel flow) was considered. For this case, our numerical results show that the computed coefficient by CSM for the center of the channel is approximately 0.2:
0.2
CSM CS
C ´F FW= (13)
Therefore:
4.4
C S
F FW = (14)
In this case the coefficient of SF model is approximately 0.063, therefore:
0.063
ad C S
C ´F FW= (15)
If we supposed that the results of CSM and SF model for simulation of flow in the center of the channel is approximately the same, the Cad (adaptive constant) can be computed as follows:
0.063 3 4.4 220 ad
C = » (16)
Therefore, that CCSM
C
should be (3/220) instead of (1/22) when this procedure is used with SF model.3. TEST CASES
Many complex phenomena appear in turbulent flow around bluff bodies such as unsteady flow separation,
vortex shedding, periodic force loading, etc. Simulations for turbulent flow is obstacle therefore numerical simulations became usual test cases. One of these standard test cases is the turbulent flow over a square cylinder in free stream. There is abundant literature for simulation of flow around a square cylinder in free stream by numerical methods and experiments [19-22]. One of the comprehensive experiments for this case study is that of Lyn et al. [23] for Re=21400. Thus, many researchers usually simulate flow past a square cylinder at Re=21400 or Re=22000 to exhibit the ability of different numerical models because the detail experimental data are available for Re=21400. Farhadi and Rahnama [24] studied the effect of different discretized scheme for convection term and subgrid scale models for two Reynolds numbers of Re=21400 and Re=22000. They noted that QUICK scheme can improve the results of simulation in comparison to Central Difference scheme for this case.
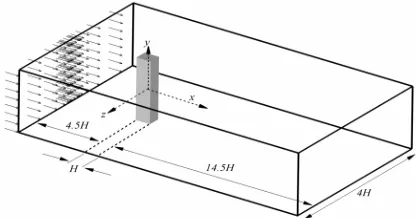
In this investigation, the computational domain, grid spacing and the average time were selected based on [24] (Figure 1). The minimum grid spacings used for this test case was 0.009H in x and 0.008H in y direction with grid expansion ratio of 1.08 and uniform grid in spanwise direction with 0.1H grid spacing. The number of grid points is 144×156×41. The average time in the simulation was 150H/Uinlet, where H is the cube height and Uinlet the velocity at the inlet.
Another test case, which is a challenging test case for numerical simulation, is turbulent flow over a low aspect ratio cylinder confined in a channel. Nakagawa et al. [25] investigated the effect of rectangular cylinder aspect ratio (b/H) on the flow pattern around a cylinder confined in a channel. Their studies showed that the global flow parameters such as Strouhal number and lift and drag coefficients change with aspect ratio and its effect is not negligible. Based on their flow visualization study, it is found that for aspect ratios 2 and 3, the separated flows at the leading edge reattach to the side walls of the cylinder, while for aspect ratio 0.5 they do not reattach and are entrained immediately behind the cylinder.
Figure 1. Geometry of flow over a square cylinder in free stream
CS CS
CSM E F F
Q F
The flow pattern is very complex around the low aspect ratio cylinder; therefore, this case can be a challenging case for numerical simulation. The domain, grid spacing and the average time is based on Nourolahi et al. [26] (Figure 2). The minimum grid spacing used for this test case was 0.009H in x and 0.008H in y direction with grid expansion ratio of 1.08 and uniform grid in spanwise direction with 0.1H grid spacing. The number of grid points is 144×156×41. The average time in the simulation was 150H/Uinlet, where H is the cube height and Uinlet the velocity at the inlet. Simulation was done using a computer with inter CPU with 7 cores and 4G memory.
4. COMPUTATIONAL METHOD AND BOUNDARY CONDITION
The governing equations presented in the preceding section were discretized using a finite volume method with the staggered grid. The convective terms were discretized using QUICK scheme. As described by Farhadi et al. [24-27]. However, the QUICK scheme has deficiencies such as large numerical dissipation, as compared with the Central Difference (CD) scheme, but QUICK scheme can achieve better results for simulation of turbulent flow over obstacles. In addition, instability problem decreases by using QUICK scheme instead of central difference scheme. A semi-implicit fractional step method (SIMPLE family algorithm) was used for solving the governing equations. A third order Runge-Kutta algorithm is used for unsteady term. At wall boundaries, no-slip boundary condition was considered and at outlet boundary condition convective boundary was supposed as follows:
0.0
C
u u
U
t x
¶ + ¶ =
¶ ¶ (17)
where UC is mean velocity or bulk velocity of inflow. At the inlet, uniform flow was considered. In addition, for simulation of flow over a low aspect ratio cylinder confined in the channel, the inlet intensity was produced by white noise equal to 6% based on data of Nakagawa et al. (1990).
5. RESULTS
The results of MSF, CSM and SF models for the mentioned test cases are represented in this section and compared to experimental data.
5. 1. Square Cylinder As mentioned in pervious sections, a detailed experimental analysis has been done by Lyn et al. [23] for Re=21400. The results of CSM,
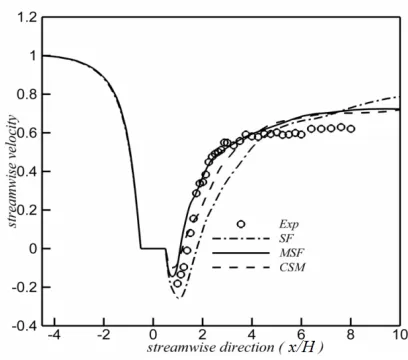
MSF and SF model were compared with Lyn et al. (1995). Figure 3 shows distribution of the time-mean velocity along the centerline at plane z=0. The MSF and CSM exhibited small differences with experiment in the downstream region, while previous works of other researchers show a great variance in this region [24]; most of them predict the recovery region with higher values than those of experiments.
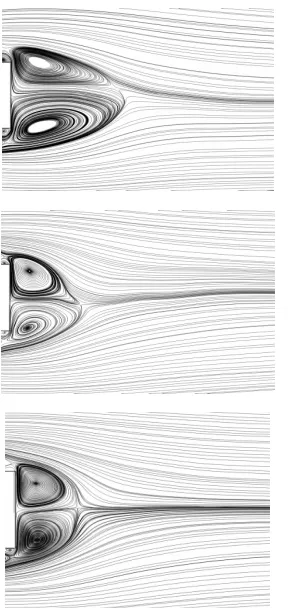
The Streamlines behind the square cylinder is exhibited in Figure 4. As shown in this figure, the SF model miscalculated the size and shape of recirculation zones behind the cylinder. Moreover, CSM model could not correctly simulate the saddle point in the end of recirculation zone in comparison to MSF model. It should be noted that using both strain rate and rotation rate in computing the subgrid scale viscosity increases the stability and capability of the model.
Figure 2. Geometry of flow over a low aspect ratio cylinder confined in a channel
SF
CSM
MSF
Figure 4. Time-averaged stream line around the square cylinder in the free stream
Length of recirculation zone behind the cylinder, Strouhal number and drag and lift coefficients are compared in Table 1. As presented, all LES model could acceptably predict the main parameters of simulation. However, SF model overestimated the length of the wake region. Figure 5 shows distributions of time-averaged velocity components and velocity fluctuations at plane z=0 at different streamwise locations of x/H ranging from 0.0 to 4.0. Results of
MSF and CSM models could follow the trend of experimental data with reasonable accuracy, however, there are some discrepancies.
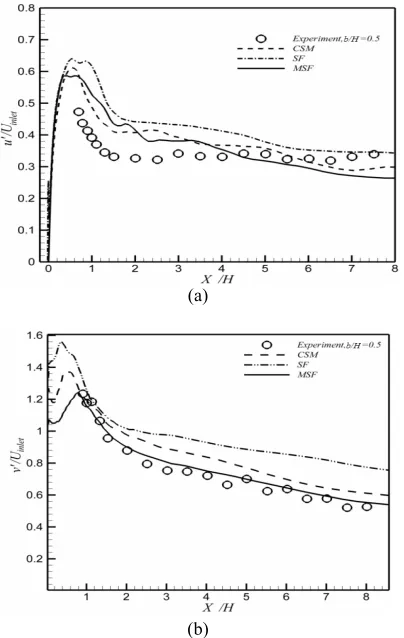
Figure 6 shows time-averaged components of turbulent kinetic and intensities among the centerline at plane z=0. As shown in this figure, the computed values of the streamwise turbulent intensity, u'u' obtained with QUICK scheme show considerable difference with experimental data in the near wake region downstream of the cylinder for all models, However, the MSF discrepancies are less than those of other models and this discrepancy reduces for larger distances downstream of the cylinder. As mentioned by Rodi et al. [19], the underprediction of the separation length causes increased turbulent intensities in the recirculation region. This is the reason that the cross stream component of turbulent intensity v'v' for MSF is higher than other models. The cascade of energy for MSF is shown in Figure 7. As shown in this figure the MSF model can correctly predict the transfer of energy from large scales to subgrid scales.
5. 2. Low Aspect Ratio The results of numerical simulations were compared to data by Nakagawa et al. [25]. Figure 8 shows the variations of time-averaged streamwise velocity at the centerline of the channel. CSM and MSF models overestimated the length of recirculation zone behind the obstacle, but SF model underestimated this region. In fact, SF model could not predict this recirculation zone correctly. As shown in Figure 9 this model could not show the reattachment of flow behind the obstacle. In addition, MSF could simulate the behavior of flow behind the cylinder better than CSM. The effect of time average on the simulation of different models was investigated, but the results did not change. It should be mentioned that the MSF model exhibited small differences with experiment in the downstream region in comparison to other models.
TABLE 1. Comparison Results of Different LES Subgrid Scale Modeling from this study and other works
Contribution St LR/H CD CDrms CLrms
SF 0.075 1.813 2.394 0.153 0.808
CSM 0.092 1.358 2.444 0.178 1.038
MSF 0.097 1.14 2.577 0.254 1.068
Rodi et al. [19] 0.09-0.15 0.94-1.68 2.02-2.77 0.14-0.27 0.64-1.68
Voke [20] 0.13-0.161 1.02-1.44 2.05-2.79 0.12-0.36 1.01-1.68
Sohankar et al. [22] 0.126-0.132
»
1 2.03-2.32 0.16-0.20 1.23-1.54(a)
(b)
(c)
Figure 6. Distribution of time-averaged velocity characteristics on the centerline compared to experiment [23] a) Streamwise velocity b) streamwise c) normal turbulent intensity
Figure 7. Power spectrum of streamwise velocity behind the square for simulation of MSF model
Figure 9. Time-averaged streamlines around low aspect ratio cylinder by standard SF model
(a)
(b)
Figure 10. Distribution of time-averaged velocity characteristics on the centerline compared to experiment [25] a) Streamwise b) Normal turbulent intensity
Figure 10 shows the distributions of u¢ and v¢ on the centerline of channel at plane z=0. The maximum of streamwise and normal turbulent intensities occur near the rear stagnation point of the recirculation zone. This phenomenon also was seen in the previous test case for simulation of flow over a square cylinder. The length of vortex formation is defined as distance between cylinder
and the downstream position of cylinder which the maximum of u¢ occur. MSF model showed same vortex formation length in comparison to experiment. It should be mentioned that the length of recirculation zone and vortex formation length are small in this case because vortices shedding are strong and recovery of the velocity defects are slow [25]. As shown in this figure the MSF model follow the trend of experiment better than SF and CSM models.
Figure 11 shows the profiles of streamwise and normal time-averaged velocities, and streamwise and normal turbulent intensities at x /H =2. The profile of the streamwise velocity (Figure 10a) shows velocity defects near the centerline of the channel and this reduction is less for MSF model in comparison to other models. The reason is that this method simulates the behavior of the flow in downstream of obstacle almost accurately. In addition, the experimental normal velocities (Figure 10b, experimental data) have positive values indicating that the flow is entrained in the near the wake, but the results of SF and CSM cannot show this phenomenon. As shown in Figures 10c and d, the normal turbulent intensities are larger in comparison to the streamwise turbulent intensities. This is as a result of anisotropic nature of the wake and strong vortex shedding [25]. It is also seen from this figure that the maximum value of v¢is on the centerline, because the separated shear layers are entrained alternately across the centerline of the channel [25].
(a)
(c)
(d)
Figure 11. Profile of time-averaged characteristics of at x/H=2 compared to experiment [25] a) Streamwise velocity b) Normal velocity c) Streamwise d) Normal turbulent intensity
The turbulent intensities and the Reynolds shear stress are large over the cross section of the channel in this case because the shedding of stronger vortices from the cylinder occurs in this area. It is expected that the turbulent intensities of numerical simulation become more than experimental data due to more decline streamwise and normal time-averaged velocities. As shown in this figure MSF model could calculate turbulent statistic better than other models. It is observed that the numerical data follows the trend of measurement data with reasonable accuracy, especially for turbulent characteristics. However, some disparities exist between numerical and experimental data. These errors are due to difficulty of this case for numerical simulation because of anisotropic flow field and strong vortex shedding behind the low aspect ratio cylinder.
6. CONCLUDING REMARKS
In this paper the constant coefficient of standard structure function model was computed locally in space and time by coherent structure procedure. The ability of this Modified Structure Function was investigated for complex flow over obstacles and compared with SF model and CSM. Results show that by computing the
constant coefficient of SF model locally, the accuracy of simulation is improved in comparison to standard SF model. In addition, by using both strain and rotation rates in MSF model, the stability and capability of model improved in comparison to CSM for these test cases.
7. REFERENCES
1. Zhou, D. and Ball, K., "Turbulent drag reduction by spanwise wall oscillations", International Journal of Engineering Transactions A Basics, Vol. 21, No. 1, (2008), 85.
2. Moosavi, R. and Nassab, S. G., "Application of the schwarz-christoffel transformation in solving two-dimensional turbulent flows in complex geometries", International Journal of Engineering-Transactions A: Basics, Vol. 21, No. 4, (2008), 397.
3. Heidarinejad, G. and Delfani, S., "Direct numerical simulation of the wake flow behind a cylinder using random vortex method in medium to high reynolds numbers", International Journal of Engineering, Vol. 13, No. 3, (2000), 33-50.
4. Breuer, M., "Large eddy simulation of the subcritical flow past a circular cylinder: Numerical and modeling aspects",
International Journal for Numerical Methods in Fluids, Vol. 28, No. 9, (1998), 1281-1302.
5. Sagaut, P., "Large eddy simulation for incompressible flows: An introduction", Springer, (2005).
6. Voke, P. R., Gao, S. and Leslie, D., "Large‐eddy simulations of plane impinging jets", International Journal for Numerical Methods in Engineering, Vol. 38, No. 3, (1995), 489-507. 7. Clark, R. A., Ferziger, J. H. and Reynolds, W., "Evaluation of
subgrid-scale models using an accurately simulated turbulent flow", Journal of Fluid Mechanics, Vol. 91, No. 1, (1979), 1-16.
8. Deardorff, J. W., "A numerical study of three-dimensional turbulent channel flow at large reynolds numbers", Journal of Fluid Mechanics, Vol. 41, No. 2, (1970), 453-480.
9. Germano, M., Piomelli, U., Moin, P. and Cabot, W. H., "A dynamic subgrid‐scale eddy viscosity model", Physics of Fluids A: Fluid Dynamics, Vol. 3, No., (1991), 1760.
10. Meneveau, C., Lund, T. S. and Cabot, W. H., "A lagrangian dynamic subgrid-scale model of turbulence", Journal of Fluid Mechanics, Vol. 319, No. 1, (1996), 353-385.
11. Ghosal, S., Lund, T. S., Moin, P. and Akselvoll, K., "A dynamic localization model for large-eddy simulation of turbulent flows",
Journal of Fluid Mechanics, Vol. 286, No. 1, (1995), 229-255. 12. Piomelli, U. and Liu, J., "Large‐eddy simulation of rotating
channel flows using a localized dynamic model", Physics of Fluids, Vol. 7, No., (1995), 839.
13. Terracol, M. and Sagaut, P., "A multilevel-based dynamic approach for subgrid-scale modeling in large-eddy simulation",
Physics of Fluids, Vol. 15, No., (2003), 3671.
14. Nicoud, F. and Ducros, F., "Subgrid-scale stress modelling based on the square of the velocity gradient tensor", Flow, Turbulence and Combustion, Vol. 62, No. 3, (1999), 183-200. 15. Lesieur, M. and Metais, O., "New trends in large-eddy
16. Kobayashi, H., "The subgrid-scale models based on coherent structures for rotating homogeneous turbulence and turbulent channel flow", Physics of Fluids, Vol. 17, (2005), 045104. 17. Kobayashi, H., Ham, F. and Wu, X., "Application of a local sgs
model based on coherent structures to complex geometries",
International Journal of Heat and Fluid Flow, Vol. 29, No. 3, (2008), 640-653.
18. Métais, O. and Lesieur, M., "Spectral large-eddy simulation of isotropic and stably stratified turbulence", Journal of Fluid Mechanics, Vol. 239, No. 1, (1992), 157-194.
19. Breuer, M. and Pourquie, M., "First experiences with les of flows past bluff bodies", in Proc. of the 3rd Int. Symp. of Eng. Turbulence Modelling and Measurements. Heraklion-Crete, Greece, (1996), 177-186.
20. Voke, P. R., "Flow past a square cylinder- test case les 2", Direct and Large-Eddy Simulation II, (1997), 355-373.
21. Rodi, W., "Comparison of les and rans calculations of the flow around bluff bodies", Journal of Wind Engineering and Industrial Aerodynamics, Vol. 69, (1997), 55-75.
22. Sohankar, A., Davidson, L. and Norberg, C., "Large eddy simulation of flow past a square cylinder: Comparison of different subgrid scale models", Journal of Fluids Engineering, Vol. 122, No. 1, (2000), 39-47.
23. Lyn, D. A., Einav, S., Rodi, W. and Park, J., "A laser-doppler velocimetry study of ensemble-averaged characteristics of the turbulent near wake of a square cylinder", Journal of Fluid Mechanics, Vol. 304, No. 12, (1995), 285-319.
24. Farhadi, M. and Rahnama, M., "Three-dimensional study of separated flow over a square cylinder by large eddy simulation",
Proceedings of the Institution of Mechanical Engineers, Part G: Journal of Aerospace Engineering, Vol. 219, No. 3, (2005), 225-234.
25. Nakagawa, S., Nitta, K. and Senda, M., "An experimental study on unsteady turbulent near wake of a rectangular cylinder in channel flow", Experiments in fluids, Vol. 27, No. 3, (1999), 284-294.
26. Nourollahi, M., Farhadi, M. and Seighi, K., Simulation flow over a low aspect ratio square cylinder confined in a channel by using a local sgs model based on coherent structures", in 9th Iranian Aerospace Society Conference, Iran, (2010)
27. Farhadi, M. and Rahnama, M., "Large eddy simulation of separated flow over a wall-mounted cube", Scientia Iranica, Vol. 13, No. 2, (2006), 124-133
.
Modified Structure Function Model Based on Coherent Structures
M. Nourollahi, M. Farhadi, K. Sedighi
Faculty of Mechanical Engineering, Babol University of Technology, Babol, Islamic Republic Islamic of Iran.
P A P E R I N F O
Paper history:
Received 31 October 2012
Recivede in revised form 24 December 2012 Accepted 24 January 2013
Keywords:
Structure Function Coherent Structure Square Cylinder Large Eddy Simulation Adapted Coefficient
هﺪﯿﮑﭼ
ﻬﺘﻓﺎﯾدﻮﺒﻬﺑلﺪﻣﻪﻌﻟﺎﻄﻣﻦﯾارد
ﯽ
ﺖﺳاهﺪﺷﻪﯾارايرﺎﺘﺧﺎﺳﻊﺑﺎﺗ
.
لﺎﯿﺳناﺪﯿﻣنﺎﺴﻤﻫرﺎﺘﺧﺎﺳسﺎﺳاﺮﺑلﺪﻣﺐﯾﺮﺿ،لﺪﻣﻦﯾارد
ﺑ ﻪ
ﺪﯾدﺮﮔﻪﺒﺳﺎﺤﻣﯽﮑﯿﻣﺎﻨﯾدترﻮﺻ
.
ﻪﺘﻓﺎﯾدﻮﺒﻬﺑلﺪﻣﺖﯿﻠﺑﺎﻗ
ي
هﺪﯿﭽﯿﭘنﺎﯾﺮﺟرديرﺎﺘﺧﺎﺳﻊﺑﺎﺗ
ی
يورﺮﺑلﺎﯿﺳ
ﻪﻧاﻮﺘﺳا ﻣ ﯽﻌﺑﺮ رد
ودازآنﺎﯾﺮﺟ
ا ﻪﻧاﻮﺘﺳ
ﺖﺳاﻪﺘﻓﺮﮔراﺮﻗﯽﺳرﺮﺑدرﻮﻣلﺎﻧﺎﮐﮏﯾﻞﺧادردﮏﭼﻮﮐضﺮﻋﻪﺑلﻮﻃﺖﺒﺴﻧيارادﻊﻄﻘﻣﺢﻄﺳﺎﺑ
.
ﻪﺒﺳﺎﺤﻣياﺮﺑﯽﮑﯿﻣﺎﻨﯾدشورزاﻪﮐنﺎﺴﻤﻫرﺎﺘﺧﺎﺳلﺪﻣويرﺎﺘﺧﺎﺳﻊﺑﺎﺗدراﺪﻧﺎﺘﺳالﺪﻣ،ﯽﻫﺎﮕﺸﯾﺎﻣزآﺮﯾدﺎﻘﻣﺎﺑﯽﺗﺎﺒﺳﺎﺤﻣﺞﯾﺎﺘﻧ
ی
ﺮﺑﯽﮑﺴﻨﯾﺮﮔﻮﻤﺳاشورﺐﯾﺮﺿ
ﯽﻣهدﺎﻔﺘﺳالﺎﯿﺳناﺪﯿﻣنﺎﺴﻤﻫرﺎﺘﺧﺎﺳسﺎﺳا
ﺖﺳاﻪﺘﻓﺮﮔراﺮﻗﻪﺴﯾﺎﻘﻣدرﻮﻣ،ﺪﻨﮐ
.
ﺞﯾﺎﺘﻧ
ﯽﻣنﺎﺸﻧ
ﻪﺘﻓﺎﯾدﻮﺒﻬﺑلﺪﻣﻪﮐﺪﻫد
ی
يرﺎﺘﺧﺎﺳﻊﺑﺎﺗ
ﺮﻈﻧزا
يراﺪﯾﺎﭘوﺖﻗد
زا
رﺎﺘﺧﺎﺳلﺪﻣويرﺎﺘﺧﺎﺳﻊﺑﺎﺗدراﺪﻧﺎﺘﺳالﺪﻣ
نﺎﺴﻤﻫ
ﺖﺳاﺮﺘﻬﺑ
.
![Figure 5. Time-averaged velocity and turbulent quantities profiles at different position at plane z=0 compared with experimental [23]](https://thumb-us.123doks.com/thumbv2/123dok_us/236406.2018298/6.595.59.536.105.713/averaged-velocity-turbulent-quantities-profiles-different-position-experimental.webp)
![Figure 6. Distribution of time-averaged velocity characteristics on the centerline compared to experiment [23] a) Streamwise velocity b) streamwise c) normal turbulent intensity](https://thumb-us.123doks.com/thumbv2/123dok_us/236406.2018298/7.595.325.526.480.729/distribution-characteristics-centerline-experiment-streamwise-streamwise-turbulent-intensity.webp)
![Figure 11. Profile of time-averaged characteristics of at x/H=2 compared to experiment [25] a) Streamwise velocity b) Normal velocity c) Streamwise d) Normal turbulent intensity](https://thumb-us.123doks.com/thumbv2/123dok_us/236406.2018298/9.595.69.274.106.383/characteristics-experiment-streamwise-velocity-velocity-streamwise-turbulent-intensity.webp)
