VOLUME NO.3(2013),ISSUE NO.03(MARCH) ISSN 2231-5756
A Monthly Double-Blind Peer Reviewed (Refereed/Juried) Open Access International e-Journal - Included in the International Serial Directories
Indexed & Listed at:
VOLUME NO.3(2013),ISSUE NO.03(MARCH) ISSN 2231-5756
INTERNATIONAL JOURNAL OF RESEARCH IN COMMERCE, IT & MANAGEMENT
CONTENTS
CONTENTS
CONTENTS
CONTENTS
Sr.No.
TITLE & NAME OF THE AUTHOR (S)
Page No. 1. EXTENT OF ABSOLUTE POVERTY IN RURAL SECTOR OF HIMACHAL PRADESH: A MEASURE OF UNEMPLOYMENT
RAMNA
1 2. THE ENTREPRENEURSHIP CORE COMPETENCES FOR DISTRIBUTION SERVICE INDUSTRY
SU-CHANG CHEN, HSI-CHI HSIAO, JEN-CHIA CHANG, CHUN-MEI CHOU, CHIN-PIN CHEN & CHIEN-HUA SHEN
5 3. THE RELATIONSHIP BETWEEN MACROECONOMIC VARIABLES AND CEMENT INDUSTRY RETURNS: EMPIRICAL EVIDENCE FROM PAKISTANI CEMENT
INDUSTRY
MUHAMMAD IMRAN & QAISAR ABBAS
10
4. OUTLOOK OF MANAGEMENT STUDENTS TOWARDS EFFICIENCY OF ONLINE LEARNING-A CASE STUDY OF SHIVAMOGGA CITY, KARNATAKA STATE
SANDHYA.C, R. HIREMANI NAIK & ANURADHA.T.S
17 5. TRAFFIC RELATED MORTALITY AND ECONOMIC DEVELOPMENT
MURAT DARÇIN
21 6. SUBSCRIBER’S PERCEPTION TOWARDS CUSTOMER CARE SERVICE IN MOBILE TELECOMMUNICATION WITH SPECIAL REFERENCE TO TUTICORIN
CITY
S. ANTHONY RAHUL GOLDEN. & DR. V. GOPALAKRISHNAN
27
7. A STUDY OF WAVELET BASED IMAGE COMPRESSION ALGORITHMS
CHETAN DUDHAGARA & DR. KISHOR ATKOTIYA
31 8. A STUDY OF CONSUMER’S IMPULSE BUYING BEHAVIOUR WITH REFERENCE TO EFFECT OF PROMOTIONAL TOOL IN THE OUTLETS OF
CHHATTISGARH
DR. MANOJ VERGHESE & POOJA G. LUNIYA
37
9. STUDY OF CONSUMER BEHAVIOR IN CELL PHONE INDUSTRY
DR. ARUNA DEOSKAR
41 10. ANOTHER APPROACH OF SOLVING UNBALANCED TRANSPORTATION PROBLEM USING VOGEL’S APPROXIMATION METHOD
DILIP KUMAR GHOSH & YASHESH ZAVERI
45 11. PROBLEM OF NON-PERFORMING ASSETS OF STATE BANK OF INDIA: A CASE STUDY OF NAGPUR DISTRICT
DR. N. K. SHUKLA & M. MYTRAYE
49 12. INVESTMENT STRATEGY OF LIC OF INDIA AND ITS IMPACT ON PROFITABILITY
T. NARAYANA GOWD, DR. C. BHANU KIRAN & DR. CH. RAMAPRASADA RAO
59 13. PREDICTION OF DHAKA TEMPERATURE BASED ON SOFT COMPUTING APPROACHES
SHIPRA BANIK, MOHAMMAD ANWER & A.F.M. KHODADAD KHAN
65 14. SET THEORETIC APPROACH TO FUNDS FLOW STATEMENTS – A STUDY WITH REFERENCE TO STATE BANK OF INDIA
DR. PRANAM DHAR
71 15. STRATEGIES FOR THE SUCCESS OF BRAND EXTENDED PRODUCT : AN ANALYTICAL STUDY OF DEHRADUN DISTRICT WITH SPECIAL REFERENCE TO
FMCG
DR. AMIT JOSHI, DR.SAURABH JOSHI, DR. PRIYA GROVER & PARVIN JADHAV
80
16. VALUE ADDED TAX AND ECONOMIC GROWTH: THE NIGERIA EXPERIENCE (1994 -2010)
DR. OWOLABI A. USMAN & ADEGBITE TAJUDEEN ADEJARE
85 17. CORPORATE SOCIAL RESPONSIBILITY INITIATIVES BY POWER GRID CORPORATION OF INDIA LIMITED: A STUDY
DR. S. RAGHUNATHA REDDY & MM SURAJ UD DOWLA
90 18. METADATA MANAGEMENT IN DATA WAREHOUSING AND BUSINESS INTELLIGENCE
VIJAY GUPTA & DR. JAYANT SINGH
93 19. QUALITY OF WORK LIFE - A CRITICAL STUDY ON INDIAN HOSPITALS
B.UMA RANI & M. SARALA
97 20. BUSINESS ETHICS: WAY FOR SUSTAINABLE DEVELOPMENT OF ORGANISATION
DR. SATYAM PINCHA & AVINASH PAREEK
105 21. USE OF ICT TOOLS IN HIGHER EDUCATION
SANDEEP YADAV & KIRAN YADAV
108 22. CONSTRUCTING CONFIDENCE INTERVALS FOR DIFFERENT TEST PROCEDURES FROM RIGHT FAILURE CENSORED NORMAL DATA
V. SRINIVAS
111 23. RECOGNISING CUSTOMER COMPLAINT BEHAVIOUR IN RESTAURANT
MUHAMMAD RIZWAN, MUHAMMAD AHMAD ATHAR, MUBASHRA WAHEED, ZAINAB WAHEED, RAIMA IMTIAZ & AYESHA MUNIR
116 24. SOCIO-CULTURAL EFFECTS OF ALCOHOL CONSUMPTION BEHAVIOUR OF YOUNG COMMERCIAL DRIVERS IN SOUTH WEST NIGERIA
DR. ADEJUMO, GBADEBO OLUBUNMI
123 25. MEAN-SHIFT FILTERING AND SEGMENTATION IN ULTRA SOUND THYROID IMAGES
S. BINNY
126 26. E-TAILING, ONLINE RETAILING ITS FACTORS AND RELATIONS WITH CUSTOMER PERSPECTIVE
WASIMAKRAM BINNAL
131 27. THE KNOWLEDGE MANAGEMENT AND THE PARAMETERS OF THE TECHNOLOGICAL INNOVATION PROCESS: APPLICATION IN THE TUNISIAN CASE
MLLE MAALEJ RIM & HABIB AFFES
134 28. THE RELATIONSHIP BETWEEN CORPORATE SOCIAL RESPONSIBILITY AND CORPORATE FINANCIAL PERFORMANCE: META-ANALYSIS
ASMA RAFIQUE CHUGHTAI & AAMIR AZEEM
139 29. AN EMPIRICAL STUDY ON STRESS SYMPTOMS OF ARTS, ENGINEERING AND MANAGEMENT STUDENTS IN TIRUCHIRAPALLI DISTRICT, TAMIL NADU
S. NAGARANI
144 30. PURCHASE INTENTION TOWARDS COUNTERFEIT PRODUCT
MUHAMMAD RIZWAN, SYEDA RABIA BUKHARI, TEHREEM ILYAS, HAFIZA QURAT UL AIN & HINA GULZAR
152
VOLUME NO.3(2013),ISSUE NO.03(MARCH) ISSN 2231-5756
CHIEF PATRON
CHIEF PATRON
CHIEF PATRON
CHIEF PATRON
PROF. K. K. AGGARWAL
Chancellor, Lingaya’s University, Delhi
Founder Vice-Chancellor, Guru Gobind Singh Indraprastha University, Delhi
Ex. Pro Vice-Chancellor, Guru Jambheshwar University, Hisar
FOUNDER
FOUNDER
FOUNDER
FOUNDER PATRON
PATRON
PATRON
PATRON
LATE SH. RAM BHAJAN AGGARWAL
Former State Minister for Home & Tourism, Government of Haryana
Former Vice-President, Dadri Education Society, Charkhi Dadri
Former President, Chinar Syntex Ltd. (Textile Mills), Bhiwani
CO
CO
CO
CO----ORDINATOR
ORDINATOR
ORDINATOR
ORDINATOR
AMITA
Faculty, Government M. S., Mohali
ADVISORS
ADVISORS
ADVISORS
ADVISORS
DR. PRIYA RANJAN TRIVEDI
Chancellor, The Global Open University, Nagaland
PROF. M. S. SENAM RAJU
Director A. C. D., School of Management Studies, I.G.N.O.U., New Delhi
PROF. M. N. SHARMA
Chairman, M.B.A., Haryana College of Technology & Management, Kaithal
PROF. S. L. MAHANDRU
Principal (Retd.), Maharaja Agrasen College, Jagadhri
EDITOR
EDITOR
EDITOR
EDITOR
PROF. R. K. SHARMA
Professor, Bharti Vidyapeeth University Institute of Management & Research, New Delhi
CO
CO
CO
CO----EDITOR
EDITOR
EDITOR
EDITOR
DR. BHAVET
Faculty, Shree Ram Institute of Business & Management, Urjani
EDITORIAL ADVISORY BOARD
EDITORIAL ADVISORY BOARD
EDITORIAL ADVISORY BOARD
EDITORIAL ADVISORY BOARD
DR. RAJESH MODI
Faculty, Yanbu Industrial College, Kingdom of Saudi Arabia
PROF. SANJIV MITTAL
University School of Management Studies, Guru Gobind Singh I. P. University, Delhi
PROF. ANIL K. SAINI
Chairperson (CRC), Guru Gobind Singh I. P. University, Delhi
DR. SAMBHAVNA
VOLUME NO.3(2013),ISSUE NO.03(MARCH) ISSN 2231-5756
INTERNATIONAL JOURNAL OF RESEARCH IN COMMERCE, IT & MANAGEMENT
DR. MOHENDER KUMAR GUPTA
Associate Professor, P. J. L. N. Government College, Faridabad
DR. SHIVAKUMAR DEENE
Asst. Professor, Dept. of Commerce, School of Business Studies, Central University of Karnataka, Gulbarga
ASSOCIATE EDITORS
ASSOCIATE EDITORS
ASSOCIATE EDITORS
ASSOCIATE EDITORS
PROF. NAWAB ALI KHAN
Department of Commerce, Aligarh Muslim University, Aligarh, U.P.
PROF. ABHAY BANSAL
Head, Department of Information Technology, Amity School of Engineering & Technology, Amity
University, Noida
PROF. A. SURYANARAYANA
Department of Business Management, Osmania University, Hyderabad
DR. SAMBHAV GARG
Faculty, Shree Ram Institute of Business & Management, Urjani
PROF. V. SELVAM
SSL, VIT University, Vellore
DR. PARDEEP AHLAWAT
Associate Professor, Institute of Management Studies & Research, Maharshi Dayanand University, Rohtak
DR. S. TABASSUM SULTANA
Associate Professor, Department of Business Management, Matrusri Institute of P.G. Studies, Hyderabad
SURJEET SINGH
Asst. Professor, Department of Computer Science, G. M. N. (P.G.) College, Ambala Cantt.
TECHNICAL ADVISOR
TECHNICAL ADVISOR
TECHNICAL ADVISOR
TECHNICAL ADVISOR
AMITA
Faculty, Government M. S., Mohali
FINANCIAL ADVISORS
FINANCIAL ADVISORS
FINANCIAL ADVISORS
FINANCIAL ADVISORS
DICKIN GOYAL
Advocate & Tax Adviser, Panchkula
NEENA
Investment Consultant, Chambaghat, Solan, Himachal Pradesh
LEGAL ADVISORS
LEGAL ADVISORS
LEGAL ADVISORS
LEGAL ADVISORS
JITENDER S. CHAHAL
Advocate, Punjab & Haryana High Court, Chandigarh U.T.
CHANDER BHUSHAN SHARMA
Advocate & Consultant, District Courts, Yamunanagar at Jagadhri
SUPERINTENDENT
SUPERINTENDENT
SUPERINTENDENT
SUPERINTENDENT
SURENDER KUMAR POONIA
VOLUME NO.3(2013),ISSUE NO.03(MARCH) ISSN 2231-5756
CALL FOR MANUSCRIPTS
CALL FOR MANUSCRIPTS
CALL FOR MANUSCRIPTS
CALL FOR MANUSCRIPTS
Weinvite unpublished novel, original, empirical and high quality research work pertaining to recent developments & practices in the area of Computer, Business, Finance, Marketing, Human Resource Management, General Management, Banking, Insurance, Corporate Governance and emerging paradigms in allied subjects like Accounting Education; Accounting Information Systems; Accounting Theory & Practice; Auditing; Behavioral Accounting; Behavioral Economics; Corporate Finance; Cost Accounting; Econometrics; Economic Development; Economic History; Financial Institutions & Markets; Financial Services; Fiscal Policy; Government & Non Profit Accounting; Industrial Organization; International Economics & Trade; International Finance; Macro Economics; Micro Economics; Monetary Policy; Portfolio & Security Analysis; Public Policy Economics; Real Estate; Regional Economics; Tax Accounting; Advertising & Promotion Management; Business Education; Management Information Systems (MIS); Business Law, Public Responsibility & Ethics; Communication; Direct Marketing; E-Commerce; Global Business; Health Care Administration; Labor Relations & Human Resource Management; Marketing Research; Marketing Theory & Applications; Non-Profit Organizations; Office Administration/Management; Operations Research/Statistics; Organizational Behavior & Theory; Organizational Development; Production/Operations; Public Administration; Purchasing/Materials Management; Retailing; Sales/Selling; Services; Small Business Entrepreneurship; Strategic Management Policy; Technology/Innovation; Tourism, Hospitality & Leisure; Transportation/Physical Distribution; Algorithms; Artificial Intelligence; Compilers & Translation; Computer Aided Design (CAD); Computer Aided Manufacturing; Computer Graphics; Computer Organization & Architecture; Database Structures & Systems; Digital Logic; Discrete Structures; Internet; Management Information Systems; Modeling & Simulation; Multimedia; Neural Systems/Neural Networks; Numerical Analysis/Scientific Computing; Object Oriented Programming; Operating Systems; Programming Languages; Robotics; Symbolic & Formal Logic and Web Design. The above mentioned tracks are only indicative, and not exhaustive.
Anybody can submit the soft copy of his/her manuscript anytime in M.S. Word format after preparing the same as per our submission guidelines duly available on our website under the heading guidelines for submission, at the email address: [email protected].
GUIDELINES FOR SUBM
GUIDELINES FOR SUBM
GUIDELINES FOR SUBM
GUIDELINES FOR SUBMISSION OF MANUSCRIPT
ISSION OF MANUSCRIPT
ISSION OF MANUSCRIPT
ISSION OF MANUSCRIPT
1. COVERING LETTER FOR SUBMISSION:
DATED: _____________
THE EDITOR
IJRCM
Subject: SUBMISSION OF MANUSCRIPT IN THE AREA OF .
(e.g. Finance/Marketing/HRM/General Management/Economics/Psychology/Law/Computer/IT/Engineering/Mathematics/other, please specify)
DEAR SIR/MADAM
Please find my submission of manuscript entitled ‘___________________________________________’ for possible publication in your journals.
I hereby affirm that the contents of this manuscript are original. Furthermore, it has neither been published elsewhere in any language fully or partly, nor is it under review for publication elsewhere.
I affirm that all the author (s) have seen and agreed to the submitted version of the manuscript and their inclusion of name (s) as co-author (s).
Also, if my/our manuscript is accepted, I/We agree to comply with the formalities as given on the website of the journal & you are free to publish our contribution in any of your journals.
NAME OF CORRESPONDING AUTHOR:
Designation:
Affiliation with full address, contact numbers & Pin Code: Residential address with Pin Code:
Mobile Number (s): Landline Number (s): E-mail Address: Alternate E-mail Address:
NOTES:
a) The whole manuscript is required to be in ONE MS WORD FILE only (pdf. version is liable to be rejected without any consideration), which will start from
the covering letter, inside the manuscript.
b) The sender is required to mention the following in the SUBJECT COLUMN of the mail:
New Manuscript for Review in the area of (Finance/Marketing/HRM/General Management/Economics/Psychology/Law/Computer/IT/
Engineering/Mathematics/other, please specify)
c) There is no need to give any text in the body of mail, except the cases where the author wishes to give any specific message w.r.t. to the manuscript. d) The total size of the file containing the manuscript is required to be below 500 KB.
e) Abstract alone will not be considered for review, and the author is required to submit the complete manuscript in the first instance.
f) The journal gives acknowledgement w.r.t. the receipt of every email and in case of non-receipt of acknowledgment from the journal, w.r.t. the submission
of manuscript, within two days of submission, the corresponding author is required to demand for the same by sending separate mail to the journal.
2. MANUSCRIPT TITLE: The title of the paper should be in a 12 point Calibri Font. It should be bold typed, centered and fully capitalised.
3. AUTHOR NAME (S) & AFFILIATIONS: The author (s) full name, designation, affiliation (s), address, mobile/landline numbers, and email/alternate email address should be in italic & 11-point Calibri Font. It must be centered underneath the title.
4. ABSTRACT: Abstract should be in fully italicized text, not exceeding 250 words. The abstract must be informative and explain the background, aims, methods,
VOLUME NO.3(2013),ISSUE NO.03(MARCH) ISSN 2231-5756
INTERNATIONAL JOURNAL OF RESEARCH IN COMMERCE, IT & MANAGEMENT
5. KEYWORDS: Abstract must be followed by a list of keywords, subject to the maximum of five. These should be arranged in alphabetic order separated by commas and full stops at the end.
6. MANUSCRIPT: Manuscript must be in BRITISH ENGLISH prepared on a standard A4 size PORTRAIT SETTING PAPER. It must be prepared on a single space and
single column with 1” margin set for top, bottom, left and right. It should be typed in 8 point Calibri Font with page numbers at the bottom and centre of every page. It should be free from grammatical, spelling and punctuation errors and must be thoroughly edited.
7. HEADINGS: All the headings should be in a 10 point Calibri Font. These must be bold-faced, aligned left and fully capitalised. Leave a blank line before each
heading.
8. SUB-HEADINGS: All the sub-headings should be in a 8 point Calibri Font. These must be bold-faced, aligned left and fully capitalised.
9. MAIN TEXT: The main text should follow the following sequence:
INTRODUCTION
REVIEW OF LITERATURE
NEED/IMPORTANCE OF THE STUDY
STATEMENT OF THE PROBLEM
OBJECTIVES
HYPOTHESES
RESEARCH METHODOLOGY
RESULTS & DISCUSSION
FINDINGS
RECOMMENDATIONS/SUGGESTIONS
CONCLUSIONS
SCOPE FOR FURTHER RESEARCH
ACKNOWLEDGMENTS
REFERENCES
APPENDIX/ANNEXURE
It should be in a 8 point Calibri Font, single spaced and justified. The manuscript should preferably not exceed 5000 WORDS.
10. FIGURES & TABLES: These should be simple, crystal clear, centered, separately numbered & self explained, and titles must be above the table/figure. Sources of data should be mentioned below the table/figure. It should be ensured that the tables/figures are referred to from the main text.
11. EQUATIONS: These should be consecutively numbered in parentheses, horizontally centered with equation number placed at the right.
12. REFERENCES: The list of all references should be alphabetically arranged. The author (s) should mention only the actually utilised references in the preparation
of manuscript and they are supposed to follow Harvard Style of Referencing. The author (s) are supposed to follow the references as per the following:
•
All works cited in the text (including sources for tables and figures) should be listed alphabetically.•
Use (ed.) for one editor, and (ed.s) for multiple editors.•
When listing two or more works by one author, use --- (20xx), such as after Kohl (1997), use --- (2001), etc, in chronologically ascending order.•
Indicate (opening and closing) page numbers for articles in journals and for chapters in books.•
The title of books and journals should be in italics. Double quotation marks are used for titles of journal articles, book chapters, dissertations, reports, workingpapers, unpublished material, etc.
•
For titles in a language other than English, provide an English translation in parentheses.•
The location of endnotes within the text should be indicated by superscript numbers.PLEASE USE THE FOLLOWING FOR STYLE AND PUNCTUATION IN REFERENCES: BOOKS
•
Bowersox, Donald J., Closs, David J., (1996), "Logistical Management." Tata McGraw, Hill, New Delhi.•
Hunker, H.L. and A.J. Wright (1963), "Factors of Industrial Location in Ohio" Ohio State University, Nigeria. CONTRIBUTIONS TO BOOKS•
Sharma T., Kwatra, G. (2008) Effectiveness of Social Advertising: A Study of Selected Campaigns, Corporate Social Responsibility, Edited by David Crowther &Nicholas Capaldi, Ashgate Research Companion to Corporate Social Responsibility, Chapter 15, pp 287-303. JOURNAL AND OTHER ARTICLES
•
Schemenner, R.W., Huber, J.C. and Cook, R.L. (1987), "Geographic Differences and the Location of New Manufacturing Facilities," Journal of Urban Economics,Vol. 21, No. 1, pp. 83-104. CONFERENCE PAPERS
•
Garg, Sambhav (2011): "Business Ethics" Paper presented at the Annual International Conference for the All India Management Association, New Delhi, India,19–22 June.
UNPUBLISHED DISSERTATIONS AND THESES
•
Kumar S. (2011): "Customer Value: A Comparative Study of Rural and Urban Customers," Thesis, Kurukshetra University, Kurukshetra.ONLINE RESOURCES
•
Always indicate the date that the source was accessed, as online resources are frequently updated or removed.WEBSITES
VOLUME NO.3(2013),ISSUE NO.03(MARCH) ISSN 2231-5756
QUALITY OF WORK LIFE - A CRITICAL STUDY ON INDIAN HOSPITALS
B.UMA RANI
ASST. PROFESSOR
DEPARTMENT OF MBA
TEEGALA KRISHNA REDDY ENGINEERING COLLEGE
HYDERABAD
M. SARALA
ASST. PROFESSOR
DEPARTMENT OF MBA
TEEGALA KRISHNA REDDY ENGINEERING COLLEGE
HYDERABAD
ABSTRACT
Quality of work life (QWL) programs can improve employee morale and organizational effectiveness. But implementing a successful QWL effort in a healthcare setting is not easy because of the unique administrative structure and inherent complexities of modern hospitals. In India, 80% of all the healthcare expenditure is borne by the patients. Expenditure borne by the state is 12%. The expenditure covered by insurance claims is 3%. As a result the price sensitivity is quite high. India faces a huge need gap in terms of availability of number of hospital beds per 1000 population. With a world average of 3.96 hospital beds per 1000 population India stands just a little over 1.2 hospital beds per 1000 population. Moreover, India faces a shortage of doctors, nurses and paramedics that are needed to propel the growing healthcare industry. India is now looking at establishing academic medical centers (AMCs) for the delivery of higher quality care with leading examples of The Manipal Group & All India Institute of Medical Sciences (AIIMS) already in place. This article describes a joint union-management quality of work life program that was carried out in a large urban medical center. The study involves employees of all the departments in selected hospitals in order to understand their point of view with respect to Quality of Work Life. Primary data was collected by administered a structured questionnaire to 690 employees of selected hospitals in the vicinity of Hyderabad & Secunderabad on the factors that have impact of the quality of work life. The questionnaire was monitored to some selected employees in different departments of the hospitals in a random order. The secondary data available in the form of organization and industry literature like record books, manual annual reports and journals Despite employee enthusiasm for the program and a major commitment of financial and human resources over its three-and-a-half-year course, the program failed to achieve long-term changes in the hospital. The shortcomings of the QWL program are analyzed and recommendations for future practice are described. Considering all the above facts and the massive growth in the healthcare industry, huge investments would offer several opportunities for Indian companies to create 'win-win' situations and there would be emerging opportunities for professionals as well in the near future.
KEYWORDS
Hospitals, Quality, work, Life, satisfaction, Healthcare
I INTRODUCTION
igh quality of work life exists when democratic management practices are used, employee’s jobs are enriched, employees are treated with dignity and safe working conditions exist. Companies interested in enhancing employees Quality of Work Life generally try to instill in employees the feelings of security, equity, pride, internal democracy, ownership, autonomy, responsibility and flexibility. Employee Productivity is what every organization is looking at while promoting or demoting an employee.
Productive employees are assets for an organization. However, it is a give and take relation. In simple terms, an employee would be productive if his working conditions are ergonomically good and his life trouble free, which has now been a responsibility of employers. We are talking about a term called "Quality of work Life", in short, QWL.
In the earlier years, working environment of the organizations was given least considerations. Employees used to work under adverse working conditions. But with the passage of time, research evidence indicated that even very small variations in temperature, noise, and lighting can considerably affect the employee performance. Today's aspirations for an improved work life, however goes well beyond salary benefits and working conditions. The QWL in its broader sense seeks to achieve integration among the employee and organizational demands, which are often contradictory and conflicting. QWL is not a theory and it doesn't advocate for particular technique for application. It is more concerned with the overall work culture and its impact on organizational productivity. Some people consider Q.W.L as the existence of a certain set of original conditions and practices. They agree that high Q.W.L exists when
1. Democratic management practices are prevalent in the organization
2. When employees’ jobs are enriching
3. They are treated with dignity and safe working conditions are present
DEFINITIONS
Q.W.L is any conscious effort for improving working conditions, work content, and its safety, security, wages and benefits, etc. Q.W.L can be said to be all the original inputs which aim at improving the employees’ satisfaction and enhancing organizational effectiveness In simpler terms, it’s about having a work environment where an employee’s activities become more important. This means implementing procedures or policies that make the work less routine and more rewarding for the employee. These procedures or policies include autonomy, recognition, belongingness, development and external rewards. Indicators of QWL are Job satisfaction, Job involvement, Work role ambiguity, Work role conflict, Work role overload, Job stress, Organizational commitment and Turn-over intentions.
Thus, Quality of work Life is the sum total of physical (working conditions), psychological and economic factors which affect the job.
A. HEALTH CARE INDUSTRY IN INDIA
The health care industry involves providing health care services to those who need medical care. This industry can take many forms, including pharmaceutical companies, health care real estate investment trusts (REIT's), for profit hospitals, medical device makers, home health aides, and over-the-counter drugs. These industries are often heavily regulated and require compliance with a number of different agencies.
The Indian healthcare industry, unlike other industries, stands untouched by recession. There had been a steady growth in this sector, revenues from the healthcare sector accounts for 5.2% of the GDP, making it the third largest growing sector in India, and further the healthcare sector is projected to grow to nearly 180,000 crores by year 2012 and a compounded annual growth rate (CAGR) of 15-17 percent for at least the next 7-10 years.
VOLUME NO.3(2013),ISSUE NO.03(MARCH) ISSN 2231-5756
INTERNATIONAL JOURNAL OF RESEARCH IN COMMERCE, IT & MANAGEMENT
B. INDIAN HEALTHCARE SECTOR STRUCTURE / MARKET SIZEThe sector comprises hospital and allied sectors that include:
1. Medical care providers that includes physicians, Specialists, Clinics, Nursing homes and Hospitals. 2. Diagnostic service centers and pathology laboratories.
3. Medical research organizations and pharmaceutical manufacturers. 4. Medical equipment manufacturers
5. Third party support service providers. In India, 80% of all the healthcare expenditure is borne by the patients. Expenditure borne by the state is 12%. The expenditure covered by insurance claims is 3%. As a result the price sensitivity is quite high. The high level healthcare facilities are out of reach for the patients. Among the top five therapeutic segments, gastro-intestinal and cardiac are experiencing both high volume and value growth. Opthologicals, cardiovascular, anti-diabetic and neurological drugs continue to top the growth list. The anti-infective, neurology, cardiovascular and anti-anti-diabetic segments have witnessed a high number of new product launches in recent years.
India faces a huge need gap in terms of availability of number of hospital beds per 1000 population. With a world average of 3.96 hospital beds per 1000 population India stands just a little over 1.2 hospital beds per 1000 population. Moreover, India faces a shortage of doctors, nurses and paramedics that are needed to propel the growing healthcare industry. India is now looking at establishing academic medical centers (AMCs) for the delivery of higher quality care with leading examples of The Manipal Group & All India Institute of Medical Sciences (AIIMS) already in place.
A recent survey conducted by HarNeedi.com, gives an outlook on the roles that are in great demand, Specialist doctors such as, Cardiologists, Cardiothoracic surgeons, Interventional Cardiologists, Orthopedics, Emergency Medicine Specialists, Oncologists, Radiologists, Ophthalmologists, Neurologists, Neuro-surgeons, Gynecologists, Urologists, Duty doctors etc… are in great demand.
Some of the other profiles that are in great demand are that of experienced nurses and technicians who can handle various specialties such as ICU’s, Cath labs, Operation Theaters, Emergency Departments etc. Technicians, like Radiographers, CT Technician, Radiotherapy technicians, emergency medical technicians etc.
are also in great demand. Considering all the above facts and the massive growth in the healthcare industry, huge investments would offer several
opportunities for Indian companies to create 'win-win' situations and there would be emerging opportunities for professionals as well in the near future.
II OBJECTIVES OF THE STUDY
1. To find out the quality of work life of the employees in Hospitals.
2. To help the organization know the level of satisfaction of the workers and employees at all hierarchical levels.
3. To find out employee’s view of their work culture in the organization.
4. To review the total environment, including working conditions to bring in positive change for betterment of QWL of employees.
5. To analyze the satisfaction levels among employees.
III SCOPE OF THE STUDY
The Scope of the study covers employees of all the departments in selected hospitals in order to understand their point of view with respect to Quality of Work Life. The scope also includes the response of the employees to the various measures taken by the management of different hospitals to make the employees comfortable at the work place. The scope is also widened to find out the expectations of the employees from the management with respect to the above concept.
IV METHODOLOGY OF THE STUDY
For the study undertaken on quality of work life the sample size has been taken at 690 members. Sample methodology used for the study is random method. Sampling was done as follows:
S.No Category No. of Respondents
1 Managerial level (DMO,PRO, Sr. Manager,doctors) 120
2 Nursing staff 170
3 Lab technicians 090
4 Housekeeping Staff 050
5 Intensive care unit staff 030
6 Radiology Staff 050
7 Front office executives 040
8 Pharmacists 030
9 Miscellaneous (Admin, Ins, IP-OP,Office boy,Typist, Hospitality, Lift boy) 100
10 TOTAL 690
Primary data was collected by administered a structured questionnaire to 690 employees of selected hospitals in the vicinity of Hyderabad & Secunderabad on the factors that have impact of the quality of work life. The questionnaire was monitored to some selected employees in different departments of the hospitals in a random order. The secondary data available in the form of organization and industry literature like record books, manual annual reports and journals is used for the purpose of understanding the standards prevailing in the organization
V LIMITATIONS OF THE STUDY
The data collected by me through primary source is constrained by the sample size which is only 690 employees. Report is subject to change with fast changing scenario. As the respondents were chosen at random, we cannot take it for granted that the data obtained are a representation of all the employees. Certain type of information which is deemed to be confidential was not given to me.
VI REVIEW OF LITERATURE
The term “quality of work life” (QWL) was first introduced in 1972 during an international labour relations conference. Quality of Work Life (QWL) received more attention after United Auto Workers and General Motors initiated a Quality of Work Life (QWL) program for work reforms.
Robbins (1989) defined Quality of Work Life (QWL) as “a process by which an organization responds to employees needs by developing mechanisms to allow them to share fully in making the decisions their design their lives at work”
VOLUME NO.3(2013),ISSUE NO.03(MARCH) ISSN 2231-5756
According to Walton (1975) proposed eight conceptual categories. They are as follows: Adequate and fair compensation ; Safe and healthy working conditions ; Immediate opportunity to use and develop human capacities ; Opportunity for continued growth and security Social integration in the work organization Work and the total life span The social relevance of work life .Taylor (1979) more pragmatically identified the essential components of Quality of working life He suggested that a number of other aspects could be added, including; individual power, Employee participation in the management, Fairness and equity, Social support, Use of one’s present skills and Self-development. Warr and colleagues (1979), in an investigation of Quality of working life, considered a range of apparently relevant factors, including In particular, Warr et al. found evidence for a moderate association between total job satisfaction and total life satisfaction and happiness, with a less strong, but significant association with self-rated anxiety. Thus, whilst some authors have emphasized the workplace aspects in Quality of working life, others have identified the relevance of personality factors, psychological well being, and broader concepts of happiness and life satisfaction. Baba and Jamal explored routinisation of job content, suggesting that this facet should be investigated as part of the concept of quality of working life. More recently, work-related stress and the relationship between work and non-work life domains (Loscocco & Roschelle, 1991) have also been identified as factors that should conceptually be included in Quality of Working Life.Bearfield, (2003)used 16 questions to examine quality of working life, and distinguished between causes of dissatisfaction in professionals, intermediate clerical, sales and service workers, indicating that different.
Worrall and Cooper (2006) recently reported that a low level of well-being at work is estimated to cost about 5-10% of Gross National Product per annum, yet Quality of Working Life as a theoretical construct remains relatively unexplored and unexplained. Some of the factors used to measure quality of working life pick up on things that don’t actually make people feel good, but which seem to make people feel bad about work if those things are absent. For example, noise – if the place where someone works is too noisy, they might get frequent headaches, or find they cannot concentrate, and so feel dissatisfied. But when it is quiet enough they don’t feel pleased or happy - they just don’t feel bad. This can apply to a range of factors that affect someone's working conditions.
VII DATA ANALYSIS & INTERPRETATION
Data analysis has multiple facets and approaches, encompassing diverse techniques. In this chapter, information collected through questionnaire is inspected and appropriate statistical methods are used to transform data for easy comprehension.
1. How do you feel working with Hospitals?
(a) Excellent (b) Good (c) Satisfactory (d) Poor
TABLE 4.1: WORKING WITH HOSPITALS
Category Respondents Percentage
Excellent 140 20.29
Good 350 50.72
Satisfactory 140 20.29
Poor 060 8.70
Total 690 100
INTERPRETATION
The survey depicts that 50.72%of the employees feel good working in Hospitals and 20.29%of the employees feel excellent and 20.29%feel satisfactory about working in Hospitals. The survey depicts that most of the employees (50.72%) feel good about working with hospitals. So the company should ensure that this percentage increases by providing promising environment. Hence should show a little more care and concern.
2. What do you like the most about your job in the hospital?
(a) Job Profile (b) Work environment (c) Growth Opportunities (d) Compensation & Benefits
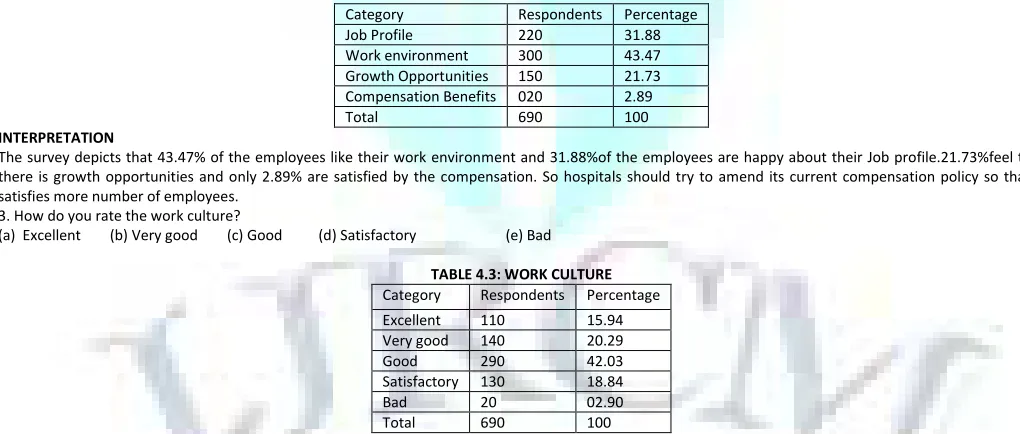
TABLE 4.2: LIKE MOST ABOUT HOSPITALS
Category Respondents Percentage
Job Profile 220 31.88
Work environment 300 43.47
Growth Opportunities 150 21.73
Compensation Benefits 020 2.89
Total 690 100
INTERPRETATION
The survey depicts that 43.47% of the employees like their work environment and 31.88%of the employees are happy about their Job profile.21.73%feel that there is growth opportunities and only 2.89% are satisfied by the compensation. So hospitals should try to amend its current compensation policy so that it satisfies more number of employees.
3. How do you rate the work culture?
(a) Excellent (b) Very good (c) Good (d) Satisfactory (e) Bad
TABLE 4.3: WORK CULTURE
Category Respondents Percentage
Excellent 110 15.94
Very good 140 20.29
Good 290 42.03
Satisfactory 130 18.84
Bad 20 02.90
Total 690 100
INTERPRETATION
The survey depicts that 42.03% of the employees feel that the work culture is good at Hospitals. 15.94% and 20.29% feel the work culture to be Excellent and very good respectively. Only a meager portion of employees are not happy with the work culture. This shows that most of the employees at Hospitals feel that they have good work culture and are confident about it.
4. Your main satisfaction in life comes from your work.
(a) Strongly agree (b) Agree (c) Disagree (d) strongly Disagree
TABLE 4.4: WORK SATISFACTION
Category Respondents Percentage
Strongly agree 200 28.99
Agree 430 62.32
Disagree 40 5.80
strongly Disagree 20 2.90
VOLUME NO.3(2013),ISSUE NO.03(MARCH) ISSN 2231-5756
INTERNATIONAL JOURNAL OF RESEARCH IN COMMERCE, IT & MANAGEMENT
INTERPRETATIONThe survey depicts that 62.32%of the employees feel that their main satisfaction in life comes from work and 28.99%strongly agree with the same. Only 5.80% and 2.90% of the respondents disagree and strongly disagree with the fact that their main satisfaction in life is derived from work. This concludes that most of the employees at Hospitals are highly satisfied with their work.
5. How hard is it to take time off during your work to take care of personal or family matters? (a) Not at all hard (b) Not too hard (c) Somewhat hard (d) Very hard
TABLE 4.5: TIME FOR FAMILY
Category Respondents Percentage
Not at all hard 170 24.63
Not too hard 200 28.99
Somewhat hard 230 33.33
Very Hard 090 13.04
Total 690 100
INTERPRETATION
The survey depicts that 24.64%of the employees feel that it is not at all hard to take care of family matters and 28.22% feel that it is not too hard whereas 33.33% find it somewhat hard to take time for personal and family matters. 13.04% of the employees find it very difficult to manage work and family as they come from far off places. Survey depicts that most of the employees are able to manage both work and family matters efficiently.
6. In general, how would you describe relations in your work place between management and employees? (a) Very good (b) Quite good c) Neither good nor bad (d) Quite bad (e) Very bad
TABLE 4.6: RELATIONS BETWEEN MANAGEMENT AND EMPLOYEES
Category Respondents Percentage
Very good 200 28.98
Quite good 370 53.62
Neither good nor bad 100 14.49
Quite bad 10 1.45
Very bad 10 1.45
Total 690 100
INTERPRETATION
The survey depicts that 53.62% of the employees feel that relation between management and employee is good and 28.99% feel it to be very good. 14.49% are indifferent and 2.90% feel the relation between management and employees to be bad.
This depicts that majority of employees are of the opinion that there is a good relation between management and employees which is a very healthy sign of a good organization.
7. How are the career development activities in your organization? (a) Excellent (b) Very good (c) Average (d) Satisfactory (e) Poor
TABLE 4.7: CAREER DEVELOPMENT ACTIVITIES
Category Respondents Percentage
Excellent 90 13.04
Very good 140 20.29
Average 210 30.43
Satisfactory 100 14.49
Poor 50 7.25
Total 690 100
INTERPRETATION
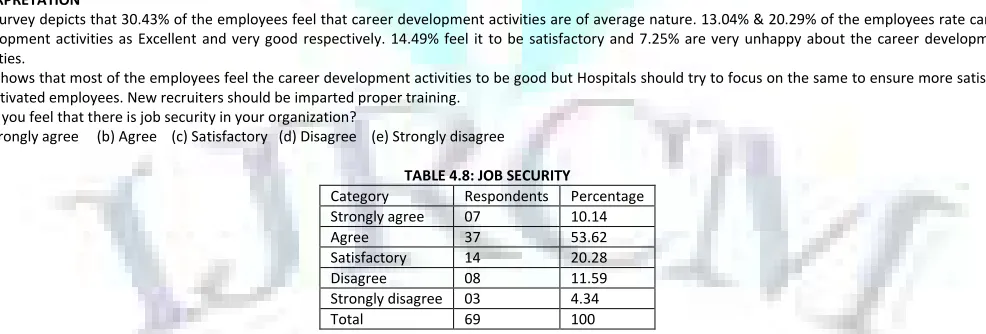
The survey depicts that 30.43% of the employees feel that career development activities are of average nature. 13.04% & 20.29% of the employees rate career development activities as Excellent and very good respectively. 14.49% feel it to be satisfactory and 7.25% are very unhappy about the career development activities.
This shows that most of the employees feel the career development activities to be good but Hospitals should try to focus on the same to ensure more satisfied & motivated employees. New recruiters should be imparted proper training.
8. Do you feel that there is job security in your organization?
(a) Strongly agree (b) Agree (c) Satisfactory (d) Disagree (e) Strongly disagree
TABLE 4.8: JOB SECURITY
Category Respondents Percentage
Strongly agree 07 10.14
Agree 37 53.62
Satisfactory 14 20.28
Disagree 08 11.59
Strongly disagree 03 4.34
Total 69 100
INTERPRETATION
The survey depicts that 53.62% of the employees agree that there is job security in most of hospitals. 10.14% strongly agree whereas 20.29% feel the job security to be satisfactory. 11.59% and 4.35% disagree & strongly disagree when asked about job security in the hospitals. Most of the employees feel secure working in Hospitals.
VOLUME NO.3(2013),ISSUE NO.03(MARCH) ISSN 2231-5756 TABLE 4.9: MONITORING OF PERFORMANCE
Category Respondents Percentage
Yes 48 69.56
Could be 12 17.39
Don’t know 09 13.04
Total 69 100
INTERPRETATION
The survey depicts that 69.57% of the employees say that their performance is being monitored periodically. 17.39% are not sure about their performance being monitored and 13.04% don’t know if their performance is at all monitored. Most of the employees say that their performance is being regularly monitored. This shows that the organization is keen on appraising employees on a regular basis.
10. What could improve the quality of your work life? (a) More suitable working hours
(b) Better pay and conditions (c) Better development/promotional activities (d) Better management
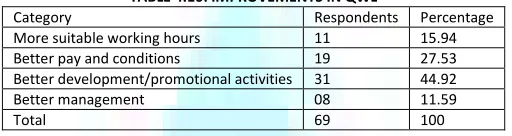
TABLE 4.10: IMPROVEMENTS IN QWL
Category Respondents Percentage
More suitable working hours 11 15.94
Better pay and conditions 19 27.53
Better development/promotional activities 31 44.92
Better management 08 11.59
Total 69 100
INTERPRETATION
The survey depicts that 15.94% of employees feels that more suitable working hours could improve their quality of work life. 27.54% feel t better pay & 44.93% are of the opinion that better development activities will improve quality of work life. 11.59% feel that better management will improve their quality of work life. From the above information, most of the employees feel that better development and promotional activities improve quality of work life. Hence hospitals should concentrate on promoting employees while appraising them.
11. How do you feel about the work load?
(a) Relaxed (b) Normal (c) Over burden (d) Satisfactory
TABLE 4.11: WORK LOAD
Category Respondents Percentage
Relaxed 06 8.70
Normal 31 44.93
Over burden 18 26.09
Satisfactory 14 20.29
Total 69 100
INTERPRETATION
The survey depicts that 44.93% of employees feels the work l.oad to be normal and only 8.70% of employees say that work is relaxing. 26.09% feel over burdened and 20.29% feel the work load to be satisfactory. This shows that most of the employees feel the work load to be normal but hospitals should try to reduce the work load by proper distribution of work so that most of the employees are happy at their work place.
12. Do you think Communication and information flow between the departments is satisfactory? (a)Yes (b) No
TABLE 4.12: COMMUNICATIONS AND INFORMATION FLOW
Category Respondents Percentage
Yes 540 78.26
No 150 21.73
Total 690 100
INTERPRETATION
The survey depicts that 78.26% of employees feels that the communication and information flow between departments is satisfactory whereas 21.73% feel the contrary. Majority of the employees are satisfied with the communication and Information flow in hospital.
13. Does the top management involve employees in the management decisions? (a)Yes (b) No
TABLE 4.13: EMPLOYEE PARTICIPATION IN DECISION MAKING
Category Respondents Percentage
Yes 490 71
No 200 29
Total 690 100
INTERPRETATION
The survey depicts that 71% of employees feels that management involves employees in decision making whereas 29 % that they have no say in management decisions. As per above, majority of the employees feel that they are involved in decision making by management.
14. Which factor motivates you the most?
(a) Salary increase (b) Promotion (c) Leave (d) Motivational talk (e) Recognition
TABLE 4.14: EMPLOYEE MOTIVATIONS
Category Respondents Percentage
Salary increase 250 36.23
Promotion 140 20.28
Leave 10 1.44
Motivational talk 130 18.84
Recognition 160 23.18
VOLUME NO.3(2013),ISSUE NO.03(MARCH) ISSN 2231-5756
INTERNATIONAL JOURNAL OF RESEARCH IN COMMERCE, IT & MANAGEMENT
INTERPRETATIONThe survey depicts that 36.23% of employees feels that salary increase motivates them whereas 20.28% feel that promotion is the important factor for motivation. 18.84% support motivational talk and 23.18% vouch for recognition.1.44% feel proper leaves motivate them in better performance.
Organization should consider various options to keep the employees motivated, especially considering proper compensation. 15. How do you rate the leave policy of the company?
(a) Fair (b) Satisfactory (c) Dissatisfactory
TABLE 4.15: LEAVE POLICY OF COMPANY
Category Respondents Percentage
Fair 160 23.18
Satisfactory 470 68.11
Dissatisfactory 060 8.69
Total 690 100
INTERPRETATION
The survey depicts that 68.11% of employees feels that leave policy of the company to be satisfactory and 23.18% feel it to be fair enough. 8.69% of the employees are dissatisfied with the company’s leave policy. Majority of the employees are satisfied with the existing leave policy in the organization.
16. Please rate your overall satisfaction level with the current work life management policy of the organization?
(a) Highly satisfactory (b) Satisfactory (c) Average (d) Poor
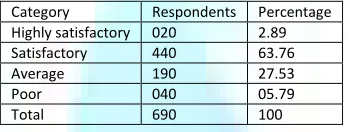
TABLE 4.16: SATISFACTION LEVEL AMONG EMPLOYEES
Category Respondents Percentage
Highly satisfactory 020 2.89
Satisfactory 440 63.76
Average 190 27.53
Poor 040 05.79
Total 690 100
INTERPRETATION
The survey depicts that 63.76% of employees are satisfied with the current work life management policy of the organization and 2.89% are highly satisfied. 27.53% feel the management policy to be average and 5.79% find the policies to be poor. As per above, Majority of the employees are satisfied with the existing management policy of the hospitals but hospitals should try to improve and revise the policies to cater to the needs of dissatisfied employees.
17. Does the company take care of employees working in night shifts? (a) Yes (b) No
TABLE 4.17: CARE FOR EMPLOYEES IN SHIFTS
Category Respondents Percentage
Yes 530 76.81
No 160 23.18
Total 690 100
INTERPRETATION
The survey depicts that 76.81% of employees feel that the employees working in night shifts are taken care of. 23.18 % feel that company does not take care of employees working in night shifts. Though majority says that hospitals take care of employees working in night shift, they should still make an effort to provide proper motivation to overcome with the feeling they have regarding working in night shifts.
18. Do the employees share experience to help each other? (a) Yes (b) No
TABLE 4.18: EXPERIENCES SHARING AMONG EMPLOYEES
Category Respondents Percentage
Yes 640 92.75
No 050 7.24
Total 690 100
INTERPRETATION
The survey depicts that 92.75 % of employees feel that the employees share experiences to help each other. Only 7.24% feel that there is no experience sharing. Majority of the employees are satisfied by the way employees share experiences while at work in Hospitals. Sharing of experience not only relaxes employees but also gives them a sense of belongingness and should be encouraged.
19. Does the company provide training for enriching the skills of employees? (a) Yes (b) No
TABLE 4.19: TRAINING OPPORTUNITIES FOR SKILLS IMPROVEMENT
Category Respondents Percentage
Yes 600 86.95
No 090 13.04
Total 690 100
INTERPRETATION
The survey depicts that 86.95 % of employees feel that company provide training for enriching the skills of employees whereas 13.04% feel that sufficient training is not provided. The organization should focus on training needs of employees at all levels as properly trained employees are an asset to the organization and plays an important role in value addition of Hospitals.
20. Do you have more pressure of work in the organization or it is equally distributed? (a) Have Pressure (b) Work is equally distributed
TABLE 4.20: WORK PRESSURE
Category Respondents Percentage
Have Pressure 25 36.23
Work is equally distributed 44 63.76
Total 69 100
INTERPRETATION
VOLUME NO.3(2013),ISSUE NO.03(MARCH) ISSN 2231-5756
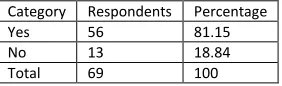
21. Do you feel free to offer comments and suggestions?
(a) Yes (b) No
TABLE 4.21: EMPLOYEE SUGGESTIONS
Category Respondents Percentage
Yes 56 81.15
No 13 18.84
Total 69 100
INTERPRETATION
The survey depicts that 81.15 % of employees feel that they are free to offer comments and suggestions whereas 18.84% of the employees feel that they are not free to offer any suggestions. It has been observed that employees at hospitals have participative kind of environment and are confident that their suggestions are considered.
22. I am satisfied with the working conditions provided by Hospitals?
(a) Strongly agree ( b) Agree (c) Disagree (d) Strongly Disagree
TABLE 4.22: WORKING CONDITIONS
Category Respondents Percentage
Strongly agree 05 7.24
Agree 57 82.60
Disagree 03 4.34
Strongly Disagree 04 5.79
Total 69 100
INTERPRETATION
The survey depicts that 82.6 % of employees are satisfied with the working conditions provided by hospitals. 7.24% are extremely satisfied with working condition and 4.34% employees are not very happy with the working condition. 5.79% of employees are extremely disappointed by the working conditions. As per above, most of the employees at hospitals are confident that working condition is satisfactory however, they should try to make the working conditions more conducive for better productivity of employees.
23. How do you rate the employee welfare programs in your organization? (a) Excellent (b) Very good (c) Good (d) Average (e) Poor
TABLE 4.23: EMPLOYEE WELFARE PROGRAMMES
Category Respondents Percentage
Excellent 06 8.69
Very good 19 27.53
Good 25 36.23
Average 12 17.39
Poor 07 10.14
Total 69 100
INTERPRETATION
The survey depicts that 8.69% of employees feel the employee welfare programs to be excellent and 27.53% of them feel it to be very good. 36.235 say that the welfare programs are good, 17.39% average and 10.14% find it to be poor. It implies to continue the same and improve it if there is any scope.
VIII FINDINGS & SUGGESTIONS
1. Most of the employees covered under my study are found to be feeling content working with its leave policy and also the working conditions.
2. Employees are not satisfied when it comes to compensation and Welfare programmes.
3. Majority of employees are happy with work culture and they have work satisfaction.
4. The relation between employees and management is appreciable.
5. Employees, however, find it hard to balance their work life and family/ personal matters and also find the work load to be high.
6. Most of the respondents feel that there is job security, Proper information flow between departments and they are involved in decision making by the
management.
7. As per the responses, an increase in salary is one factor which employees feel will help them in motivating them further.
8. Equal and fair work distribution of work will contribute to the betterment of their work life.
It is better to keep employees aware of the company goals, vision, and mission and keep them informed of all the changes taking place in the company then it would definitely go a long way in the efficiency of the employees. There should be no communication gap between the Head of the departments and members. The communication flow must be smooth to maintain cordial relations in the organization. It is better to take timely preventive measures that the work would not be overloaded and maintain better Quality of Work Life. The efforts to further improve the work culture in the organization should be continued. The training and development programs can also be more effectively planned and implemented.
IX CONCLUSION
From the study conducted, following conclusion can be made.
Overall satisfaction levels and work culture is really good in most of the hospitals. HR dept is playing an important role for the successful development of the organization. At the same time the practices which are followed by the private hospitals are really good. Quality of Work Life was not considered as important factor in India until recently as there were important impending factors like resource deficiency, environmental threats and some services of financial problems. Quality of Work Life programme has become important in work place for the following reasons:
1. Increase demands at work
2. Loss of long term employee guarantees
3. The need for enhanced work place skills
4. Greater competition for talent
5. Increased women in work fore
VOLUME NO.3(2013),ISSUE NO.03(MARCH) ISSN 2231-5756
INTERNATIONAL JOURNAL OF RESEARCH IN COMMERCE, IT & MANAGEMENT
X REFERENCES
1. BiswajeeetPattanaya, Human Resource Management, PHI-2201
2. BiswajeetPattanayak:Human resource and personnel management, , PHI,2005.
3. CS. Venkataratnam: PersonnelManagement and Human Resources, , Tata McGraw Hill, 2009.
4. David A. Decenzo and Stephen P. Robbins: Fundamentals of Human resource and personnel management, 8/e, , Wiley,2009.
5. Decenzo& Robbins – Human Resource Management, Johnwilley 1998
6. Edwin B. Flippo, Personnel management, McGraw Hill, 2009.
7. Fisher: Human resource and personnel management,Cengage. 2009.
8. Gary Dessler:Human resource and personnel management,10/e, , Pearson, 2009.
9. Gomez-Mejia Managing Human Resources, , PHI, 2009.
10. http://en.wikipedia.org/wiki/Quality_of_working_life
11. http://jhv.sagepub.com/content/5/2/135.abstract
12. http://www.authorstream.com/Presentation/9703234545-1080145-quality-of-work-life/
13. http://www.businessdictionary.com/definition/quality-of-worklife.html
14. http://www.chrmglobal.com/Articles/183/1/Quality-of-Work-Life.html
15. http://www.harneedi.com/index.php/healthcare-articles/1738-indian-healthcare-industry-overview-and-trends-2010
16. John M. Ivancevich:Human resource and personnel management, ,TataMc.Graw Hill, 2009.
17. K Aswathappa:Human resource and personnel management, Tata McGraw Hil,2009.
18. Lepak: Human resource and personnel management, -Pearson-2009
19. Mirza S Saiyadain - Human Resource Management, TMH-2001
20. P.Subbarao - Human resource Management, HPH-2003
21. Saiyadain: Human resource and personnel management, 4/e, Tata McGraw Hill, 2009.
22. Subbarao: Human resource and personnel management, HPH., 2009.
VOLUME NO.3(2013),ISSUE NO.03(MARCH) ISSN 2231-5756
REQUEST FOR FEEDBACK
Dear Readers
At the very outset, International Journal of Research in Commerce, IT and Management (IJRCM)
acknowledges & appreciates your efforts in showing interest in our present issue under your kind perusal.
I would like to request you to supply your critical comments and suggestions about the material published
in this issue as well as on the journal as a whole, on our E-mail i.e.
for further
improvements in the interest of research.
If you have any queries please feel free to contact us on our E-mail
.
I am sure that your feedback and deliberations would make future issues better – a result of our joint
effort.
Looking forward an appropriate consideration.
With sincere regards
Thanking you profoundly
Academically yours
Sd/-
VOLUME NO.3(2013),ISSUE NO.03(MARCH) ISSN 2231-5756