www.adv-radio-sci.net/10/99/2012/ doi:10.5194/ars-10-99-2012
© Author(s) 2012. CC Attribution 3.0 License.
Radio Science
A comparison of minimum norm and MUSIC for
a combined MEG/EEG sensor array
H. Ahrens, F. Argin, and L. Klinkenbusch
Institut f¨ur Elektrotechnik und Informationstechnik, Christian-Albrechts-Universit¨at zu Kiel, Germany Correspondence to: H. Ahrens ([email protected])
Abstract. Many different algorithms for imaging neuronal activity with magnetoencephalography (MEG) or electroen-cephalography (EEG) have been developed so far. We vali-date the result of other authors that a combined MEG/EEG sensor array provides smaller source localisation errors than a single MEG or single EEG sensor array for the same total number of sensors. We show that Multiple Signal Classifi-cation (MUSIC) provides smaller localisation errors than an unweighted minimum norm method for activity located in the cortical sulcus regions. This is important for many medi-cal applications, e.g. the lomedi-calisation of the origin of epileptic seizures (focal epilepsy) that can be located very deep in the cortical sulcus.
1 Introduction
Imaging of neuronal activity can be very helpful in medical applications, e.g. before a resection surgery of brain areas in-cluding the origin of epileptic seizures (Pataraia et al., 2002). Functional Magnetic Resonance Imaging (fMRI) measures the oxygen consumption due to synaptic activity and pro-vides a high spatial resolution of the order of a few mil-limeters but due to the slow haemodynamic response a rel-atively low temporal resolution of the order of one second (Baillet et al., 2001). In contrast MEG or EEG directly mea-sure the magnetic field or electrostatic scalp potential pro-duced by neuronal currents outside the brain and provide a much higher temporal resolution of a few milliseconds but a lower spatial resolution of a few centimeters. Today in MEG the magnetic fields of the order of a few femtotesla are mea-sured with Superconducting Quantum Interference Devices (SQUIDs) and in EEG the potential is measured with elec-trodes directly at the scalp. With future uncooled and
un-shielded magnetoelectric sensors developed by the research project SFB 855 of the Deutsche Forschungsgemeinschaft maybe also the magnetic field can be measured with sensors directly at the scalp. This could provide on one hand a higher SNR, on the other hand a better alignment of the head to the sensor array for applications in MEG/EEG video monitoring of epileptic seizures. It has been shown before (Sharon et al., 2007; Liu et al., 2002) that a combined SQUID-MEG/EEG sensor array provides smaller source localisation errors than single SQUID-MEG or single EEG sensor arrays for the same total number of sensors. In Sect. 5 we affirm these results with a simulation for a combined MEG/EEG sen-sor array with MEG magnetometers located directly at the scalp. EEG electrodes and MEG sensors contain different information of the primary currents and for a spherical con-ductor model even complementary information (Dassios et al., 2007; Dassios, 2008). Due to the non-uniqueness of the solution of the inverse problem (Fokas et al., 2004) lots of different algorithms for the localisation of neuronal activity have been developed in the last decades (Baillet et al., 2001). In Sect. 6 we compare the localisation accuracy of an un-weighted minimum norm method and the MUSIC (Mosher et al., 1992) beamforming technique for a focal activity lo-cated at the cortical gyrus and in the cortical sulcus region of the brain. We show that the localisation error for the cortical sulcus activity is smaller for the MUSIC algorithm than for the unweighted minimum norm method.
2 Realistic head model
100 H. Ahrens et al.: A comparison of minimum norm and MUSIC for a combined MEG/EEG sensor array
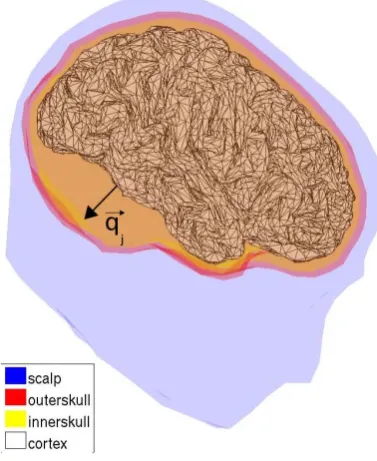
Fig. 1. Realistic head geometry extracted from MRI. Number of
dipolesqjon the cortical meshn=15 010.
to vertex distance of the order of 1 mm. Figure 1 shows the used layers. The cortical mesh contains 15 010, the inner-skull surface 642, the outerinner-skull surface 642 and the scalp surface 1082 vertices. The MRI geometries were provided by Sabine Meunier (Hˆopital de la Salpˆetri`ere, Paris) as part of the tutorial dataset distributed with the BrainStorm pro-gram (Tadel et al., 2011).
3 Forward model
The total current densityj present in the brain can be sep-arated into a primary current density jp that corresponds to the synaptic activity and a volume current density jV that corresponds to the passive response currents to fulfil the charge conservation∇ ·j=0:
j=jp+jV (1)
To calculate the magnetic field and the electrostatic potential at the sensor positions we use current dipolesqj fixed at the verticesrj of the cortical mesh to model the primary current density (distributed model):
jp(r)= n X
j=1
qjδ(r−rj) (2)
We choose dipole orientations normal to the cortical surface (Baillet et al., 2001, p. 16) and consider n dipoles on the cor-tical mesh and p sensors. We use a piecewise homogeneous
and isotropic conductor model with the 4 conductivity do-mains brain, skull, scalp and air separated by the 3 layers in-nerskull, outerskull and scalp as shown in Fig. 1. We use the default conductivity parameters of the BrainStorm program 1 (brain), 0.0125 (skull), 1 (scalp) and 0 (air). The magnetic field and electrostatic potential at the sensor positions is cal-culated with the Boundary Element Method (BEM) taking into account the contributions of both primary and volume currents (Mosher et al., 1999, p. 246). For the numerical solution of the BEM we use the forward modeling program OpenMEEG (Gramfort et al., 2010; Kybic et al., 2005). The signal of the MEG sensor is proportional to the magnetic flux through the sensor that can be calculated with the superposi-tion principle:
ϕi=
n X
j=1
GB,ijqj (3)
For a data time seriest1,...,tT the time dependent dipole am-plitude matrix Q is defined by
Q=
q1(t1) ... q1(tT) ..
. . .. ... qn(t1) ... qn(tT)
(4)
and the time dependent data matrixφBis defined by
φB=
ϕ1(t1) ... ϕ1(tT) ..
. . .. ... ϕp(t1) ... ϕp(tT)
(5)
Inserting Eqs. (4) and (5) into Eq. (3) yields a system of linear equations
φB=GBQ (6)
with a(p×n)gain matrix GB.
4 Forward model for combined MEG/EEG
Using the superposition principle we can derive an analogue system of linear equations for the EEG signal:
φV=GVQ (7)
whereV denotes the electrostatic scalp potential and an ana-logue system of linear equations for a combined MEG/EEG data matrix: φ= φB φV = GB GV
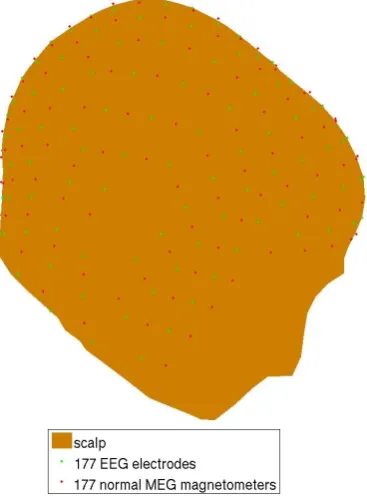
Fig. 2. Combined MEG/EEG sensor array with 177 normal MEG
magnetometers and 177 EEG electrodes. In the single MEG simula-tion the EEG electrodes are substituted by MEG magnetometers, in the single EEG simulation the MEG magnetometers are substituted by EEG electrodes.
5 Comparison of the crosstalk errors for a single EEG, single MEG and combined MEG/EEG sensor array
5.1 Sensor arrays
Figure 2 shows the combined MEG/EEG sensor array that is used in the simulations. The MEG magnetometers (red) measure just the component of the magnetic field normal to the scalp, the EEG electrodes (green) measure the electro-static potential at the scalp. Both MEG and EEG sensors are considered as point sensors without noise.
5.2 Crosstalk error
The most simple solution of the inverse problem is the un-weighted minimum norm solution
ˆ
Q=G†φ (9)
giving the solution with the smallest norm || ˆQ||. In a forward-inverse-simulation we can insert φ=GQ into Eq. (9) and getQˆ =G†GQ. Ifqjdenotes the given amplitude of thej-th dipole, qˆi=Pj(G†G)ijqj is the reconstructed
Fig. 3. Crosstalk error map for 354 EEG sensors.C=0.032.
amplitude of thei-th dipole. The crosstalk error (Liu et al., 2002)
C(i)=1
n n X
j=1
|(G†G)ij|2 |(G†G)
ii|2
(10)
measures how the reconstructed amplitude of the dipole at position i depends on the given dipole amplitudes at other positionsj. So the crosstalk error quantifies the mis-localisation of activity. The cortical average of the crosstalk error is given by
C=1
n n X
i=1
C(i) (11)
5.3 Results
Figures 3, 4 and 5 show the crosstalk localisation error plot-ted on a flat representation of the right cortex for a single EEG, single MEG and a combined MEG/EEG sensor array, respectively. The localisation errors are smallest for the com-bined MEG/EEG sensor array, especially in the cortical sul-cus regions (black arrow). Also the averaged crosstalkCis smallest in the case of the combined MEG/EEG sensor array.
6 Comparison of minimum norm and MUSIC
6.1 MUSIC
102 H. Ahrens et al.: A comparison of minimum norm and MUSIC for a combined MEG/EEG sensor array
Fig. 4. Crosstalk error map for 354 MEG sensors.C=0.038.
Fig. 5. Crosstalk error map for 177 MEG and 177 EEG sensors. C=0.020.
active areasrcan be estimated from the rank of the data ma-trixr≈rank(φ)(Mosher and Leahy, 1998). The positionsli of ther active areas can be found as ther zero points of a cost functionu:
u(li)=
||P⊥g(l i)||2
||g(li)||2 =0 for i=1,...,r (12) whereg(li)are the column vectors of G and P⊥ is a rank (p−r)orthogonal projector that can be calculated with a Singular Value Decomposition (SVD) of the data matrixφ
(Mosher et al., 1992). In praxis the reciprocal of the cost functionuis plotted on the cortex and the positions of the ractive areas can be found asr sharp peaks in the MUSIC-map. In our simulations we consider the number of active areas to be known as one.
6.2 Results
6.2.1 Activation in cortical sulcus
Figures 6 and 7 show the results of the simulation in the combined MEG/EEG sensor array with 177 MEG and 177 EEG sensors for the minimum norm and MUSIC, respec-tively. The given activity is represented by a cortical patch of 8 dipoles activated in the cortical sulcus normally to the cortex with maximum activity at the white dot in the middle. The localisation error is shown with a white double-arrow and is defined as the distance between the maximum of the given activity and the maximum of the reconstructed activ-ity. The localisation error of the minimum norm solution is 1.8 cm (Fig. 6), the localisation error of the MUSIC-map is 0.4 cm (Fig. 7). The MUSIC-map provides a smaller locali-sation error than the minimum norm solution.
6.2.2 Activation in cortical gyrus
Figures 8 and 9 show the results of the simulation in the combined MEG/EEG sensor array with 177 MEG and 177 EEG sensors for the minimum norm and MUSIC, respec-tively. The given activity is located at the cortical gyrus. The localisation error of the minimum norm solution is 0.5 cm (Fig. 8), the localisation error of the MUSIC-map is 0.7 cm (Fig. 9). The difference between the localisation errors of the minimum norm and the MUSIC solution for a cortical gyrus activation is smaller than for a cortical sulcus activation. For a cortical gyrus activation minimum norm and MUSIC pro-vide comparable localisation errors.
7 Conclusions
Fig. 6. Minimum norm solution (colored) for a given activity in the cortical sulcus and the combined MEG/EEG sensor array from Fig. 2.
Left: reconstructed dipole amplitudes plotted in MRI-Scan. Right: activity plotted on a flat representation of the cortex.
Fig. 7. MUSIC-map (colored) for a given activity in the cortical sulcus and the combined MEG/EEG sensor array from Fig. 2. Left:
MUSIC-map plotted in MRI-Scan. Right: activity plotted on a flat representation of the cortex.
Acknowledgements. This work was supported by the SFB 855 Magnetoelectric Composites – Future Biomagnetic Interfaces of the
Deutsche Forschungsgemeinschaft.
References
Baillet, S., Mosher, J. C., and Leahy, R. M.: Electromagnetic brain mapping, IEEE Signal Proc. Mag., 18, 14–30, 2001.
Dassios, G.: Neuronal currents and EEG-MEG fields, Math. Med. Biol., 25, 133–139, 2008.
Dassios, G., Fokas, A. S., and Hadjiloizi, D.: On the complemen-tarity of electroencephalography and magnetoencephalography, IOP Science Inverse Problems, 23, 2541–2549, 2007.
Fokas, A. S., Kurylev, Y., and Marinakis, V.: The unique determi-nation of neuronal currents in the brain via
magnetoencephalog-raphy, Institute of Physics Publishing, Inverse Probl., 20, 1067– 1082, 2004.
Gramfort, A., Papadopoulo, T., Olivi, E., and Clerc, M.: Open-MEEG: opensource software for quasistatic bioelectromagnet-ics, Biomed. Eng. Online, 9, 45, doi:10.1186/1475-925X-9-45, 2010.
Kybic, J., Clerc, M., Abboud, T., Faugeras, O., Keriven, R., and Papadopoulo, T.: A common formalism for the integral formula-tions of the forward EEG problem, IEEE T. Med. Imaging, 24, 12–28, 2005.
Liu, A. K., Dale, A. M., and Belliveau, J. W.: Monte Carlo Sim-ulation Studies of EEG and MEG Localization Accuracy, Hum. Brain Mapp., 16, 47–62, 2002.
104 H. Ahrens et al.: A comparison of minimum norm and MUSIC for a combined MEG/EEG sensor array
Fig. 8. Minimum norm solution (colored) for a given activity at the cortical gyrus and the combined MEG/EEG sensor array from Fig. 2.
Left: reconstructed dipole amplitudes plotted in MRI-Scan. Right: activity plotted on a flat representation of the cortex.
Fig. 9. map (colored) for a given activity at the cortical gyrus and the combined MEG/EEG sensor array from Fig. 2. Left:
MUSIC-map plotted in MRI-Scan. Right: activity plotted on a flat representation of the cortex.
Mosher, J. C., Lewis, P. S., and Leahy, R. M.: Multiple Dipole Mod-eling and Localization from Spatio-Temporal MEG Data, IEEE T. Bio-Med. Eng., 39, 541–557, 1992.
Mosher, J. C., Leahy, R. M., and Lewis, P. S.: EEG and MEG: Forward Solutions for Inverse Methods, IEEE T. Bio-Med. Eng., 46, 245–259, 1999.
Pataraia, E., Baumgartner, C., Lindinger, G., and Deecke, L.: Mag-netoencephalography in presurgical epilepsy evaluation, Neuro-surg. Rev., 25, 141–159, 2002.
Sharon, D., H¨am¨al¨ainen, M. S., Tootell, R. B., Halgren, E., and Bel-liveau, J. W.: The advantage of combining MEG and EEG: com-parison to fMRI in focally stimulated visual cortex, Neuroimage, 36, 1225–1235, 2007.