Volume 02, No. 4, April 2016
P
age
26
Multi-Objective Optimization of End-Milling Process Parameters
Using Grey-Taguchi Approach
Chitrasen Samantra*, Debasish Santosh Roy**, Amit Kumar Saraf***, &
Bikash Kumar Dehury****,
*Assistant Professor, Department of Mechanical Engineering, Gandhi Institute of Engineering and Technology, Gunupur, Rayagada Odisha, India
**B.Tech Mechanical Students, Gandhi Institute of Engineering and Technology, Gunupur, Rayagada Odisha, India
***B.Tech Mechanical Students, Gandhi Institute of Engineering and Technology, Gunupur, Rayagada Odisha, India
****B.Tech Mechanical Students, Gandhi Institute of Engineering and Technology, Gunupur, Rayagada Odisha, India
ABSTRACT
The present work analyses different parameters of end milling to minimize the surface roughness for AISI D2 steel. D2 Steel is generally used for stamping or forming dies, punches, forming rolls, knives, slitters, shear blades, tools, scrap choppers, tyre shredders etc. Surface roughness is one of the main indices that determines the quality of machined products and is influenced by various cutting parameters. In machining operations, achieving desired surface quality by optimization of machining parameters, is a challenging job. In case of mating components the surface roughness become more essential and is influenced by the cutting parameters, because, these quality structures are highly correlated and are expected to be influenced directly or indirectly by the direct effect of process parameters or their interactive effects (i.e. on process environment). In this work, the effects of selected process parameters on surface roughness and subsequent setting of parameters with the levels have been accomplished by Taguchi’s parameter design approach. The experiments have been performed as per the combination of levels of different process parameters suggested by L16 orthogonal array. Experimental investigation of the end milling of AISI D2 steel with carbide tool by varying feed, speed and depth of cut and the surface roughness has been measured using surface roughness tester. Analyses of variance have been performed for mean and signal-to-noise ratio to estimate the contribution of the different process parameters on the process.
Keywords: End milling process, Grey relational Analysis, Taguchi Approach..
1. INTRODUCTION
Volume 02, No. 4, April 2016
P
age
27
process dependent; it is difficult to calculate surface roughness value through theoretical analysis. Therefore, usually most of machine operators applied “trial and error” approaches to set- up milling machine cutting conditions in order to achieve the desired surface roughness. However, it is not effective and efficient and the success rate for repetitive desirable value is very low. The dynamic nature and widespread usage of milling operations in practice have raised a need for a systematic approach that can help to set-up milling operations in comparatively lesser time and also achieve the desired surface roughness quality. Due to high tolerances and good surface finish values that milling can deal, it is ideal for adding precision features to a part whose basic shape has already been formed.
Fig. 1 End Millling Operation On AISI D2 Steel
The Taguchi parameter design had been done in order to identify the optimum surface roughness performancewith a particular combination of cutting parameters in an end-milling operation. Taguchi optimization methodology was employed to optimize cutting parameters in end milling while machining AISI D2 steel with CVD coated carbide insert tool with TiAlN coating, under semi-finishing and finishing conditions of high speed cutting considering the milling parameters - cutting speed, feed rate and depth of cut. Grey-Taguchi method combined the orthogonal array (OA) design of experiments (DOE) with grey-relational analysis(GRA), which enabled the determination of the optimal combination of milling parameters for multiple process responses.
Grey relational analysis was performed to combine the multiple responses in to one numerical score, rank these scores, anddetermine the optimal machine parameter settings. Confirmation tests were performed by using experiments. ANOVA wasperformed to investigate the more influencing parameters on the multiple performance characteristics.
2. LITERATURE REVIEW
Tsai et al. [1] stated that the feed rate, cutting speed, depth of cut, cutter geometry, and cutter
Volume 02, No. 4, April 2016
P
age
28
using Taguchi design . Ghani et al. [3] conducted a study to optimize cutting conditions for hardened steel under semi-finish and finish conditions. Applying cutting speed, feed rate, and depth as control factors, they used measured responses (i.e., surface roughness and resultant cutting force) and their calculated signal-to-noise ratio to determine the optimal cutting condition.Bouzid et al. [4] did research to obtain optimal cutting parameters such as cutting speed, feed per tooth, and cutting depth for surface roughness in down face milling operations by using duplex stainless steel and carbon steel compositions as samples.Lakshmi and
Venkata Subbaiah [5] conducted experimental investigations on surface finish and material
removal rate during the high speed end milling of EN24 alloy steel in order to develop an appropriate roughness prediction model and optimize the cutting parameters using RSM.
Jaya Krishna et al.[6] adopted principal component analysis (PCA) based neural networks
for predicting the surface roughness in CNC end milling of P20 mould steel.Babu and
Sunny [7] conducted study with a view to determine optimal machining parameters in
drilling of GFRP composite materials.Palanikumar et al.[8] studied the effect of cutting parameters on surface roughness on machining of GFRP composites by Polycrystalline Diamond (PCD) tool by developing a second order model for predicting the surface roughness average.
From the exhaustive literature review, it has been observed that there is a need of finding the optimal machining parameter setting at which the MRR is maximum and both surface roughness and parallelism are minimum for machining of AISI D2 steel using end milling process. Therefore, in this paper, an attempt has been made to optimize the end milling process parameters using Grey-Taguchi approach.
3. EXPERIMENTATION
Volume 02, No. 4, April 2016
P
age
29
The calculation of S/N ratio depends on the quality characteristics of the product or process to be optimized. The equation for calculating S/N ratios for “larger is better” (HB), “smaller is better” (LB) and “nominal is best” (NB) types of characteristics are as follows:
The signal-to-noise (S/N) ratio for each level of process parameters are computed. The optimum setting of the process parameters contributes the minimization of the effect of noise. It means that the level of process parameters with the highest S/N ratio corresponds to the optimum level of process parameters.
3.1Design of Experiment
In this work, four levels and three factors such as speed. Feed and depth of cut are considered for the experiment. The factors and levels are shown in Table 1.
Table 1Factors and Levels
Factors Level 1 Level 2 Level 3 Level 4
Speed(rpm) 2700 2900 3100 3300
Feed(mm/min) 1000 1150 1300 1450
Depth of
cut(mm)
Volume 02, No. 4, April 2016
P
age
30
Table 2L16 Orthogonal Array
Experimental Runs Factor 1 Factor 2 Factor 3
1 1 1 1
2 1 2 2
3 1 3 3
4 1 4 4
5 2 1 2
6 2 2 1
7 2 3 4
8 2 4 3
9 3 1 3
10 3 2 4
11 3 3 1
12 3 4 2
13 4 1 4
14 4 2 3
15 4 3 2
16 4 4 1
3.2 Data Pre-processing
The application of GRA is carried out in the following steps:
Volume 02, No. 4, April 2016
P
age
31
If the original data has the quality characteristic as „smaller- the-better than the original data is pre-processed as „smaller- the-best‟:
Here is the value after grey relational generation, min is the smallest value of
for the response, and max is the largest value of for the response.
3.3 Deviation Sequencing
Deviation sequencing is calculated for the obtained pre- processing data by considering ideal value 1. Deviation sequencing can be calculated by using the following formula:
Where
= Deviation sequencing for the process data
= pre-process value
3.4 Calculation of Grey Relational Coefficient
In the next step coefficient ξi is calculated for all the obtained deviational sequencing data individually, Grey relational coefficient ξi(k) is calculated using the following formula:
3.5 Computation of Grey Relational Grade
Grey relational grade is calculated by the following formula:
Volume 02, No. 4, April 2016
P
age
32
The higher value of grey relational grade corresponds to intense relational degree between the reference sequence x0(k) and the given sequence xi(k). The reference sequence x0(k) represents the best process sequence; therefore, higher grey relational grade means that the corresponding parameter combination is closer to the optimal.
4. RESULT AND ANALYSIS
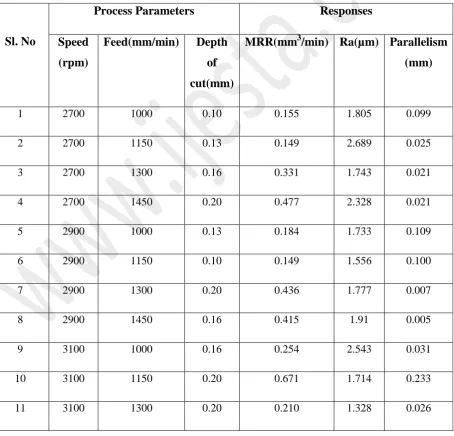
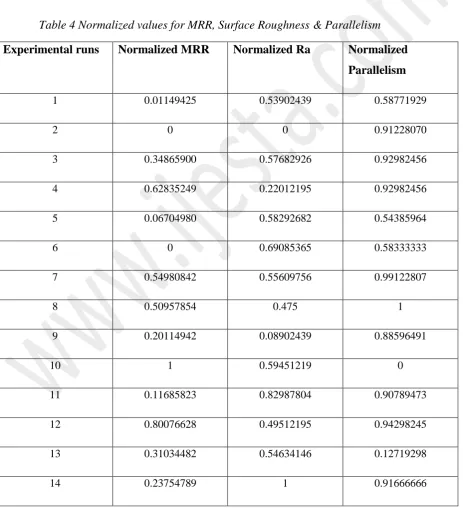
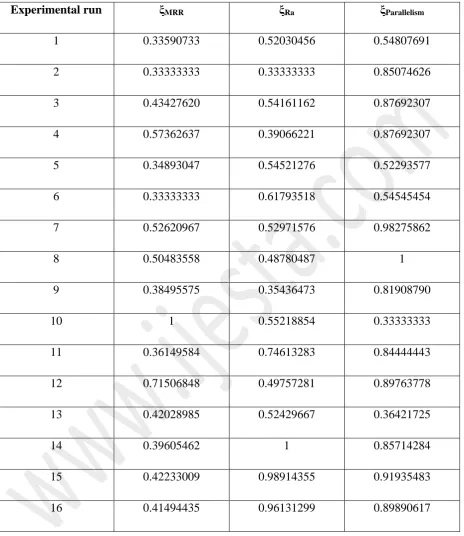
The following results have been obtained using Grey-Taguchi method. Table 3 shows the computed values of MRR, surface roughness and parallelism. Table 4 shows the Normalized values for MRR, surface roughness and parallelism. Grey relational loss and grey relational co-efficient have been calculated and presented in Table 5 and Table 6 respectively. Consequently, the overall grey relational grade of each experimental run are computed and the obtained values are shown in Table 7.
Table 3 Experimental runs for MRR, Surface Roughness and Parallelism
Sl. No
Process Parameters Responses
Speed
(rpm)
Feed(mm/min) Depth
of
cut(mm)
MRR(mm3/min) Ra(µm) Parallelism
(mm)
1 2700 1000 0.10 0.155 1.805 0.099
2 2700 1150 0.13 0.149 2.689 0.025
3 2700 1300 0.16 0.331 1.743 0.021
4 2700 1450 0.20 0.477 2.328 0.021
5 2900 1000 0.13 0.184 1.733 0.109
6 2900 1150 0.10 0.149 1.556 0.100
7 2900 1300 0.20 0.436 1.777 0.007
8 2900 1450 0.16 0.415 1.91 0.005
9 3100 1000 0.16 0.254 2.543 0.031
10 3100 1150 0.20 0.671 1.714 0.233
Volume 02, No. 4, April 2016
P
age
33
12 3100 1450 0.13 0.567 1.887 0.018
13 3300 1000 0.20 0.311 1.793 0.204
14 3300 1150 0.16 0.273 1.049 0.024
15 3300 1300 0.13 0.314 1.058 0.015
16 3300 1450 0.10 0.303 1.082 0.017
Table 4 Normalized values for MRR, Surface Roughness & Parallelism
Experimental runs Normalized MRR Normalized Ra Normalized
Parallelism
1 0.01149425 0.53902439 0.58771929
2 0 0 0.91228070
3 0.34865900 0.57682926 0.92982456
4 0.62835249 0.22012195 0.92982456
5 0.06704980 0.58292682 0.54385964
6 0 0.69085365 0.58333333
7 0.54980842 0.55609756 0.99122807
8 0.50957854 0.475 1
9 0.20114942 0.08902439 0.88596491
10 1 0.59451219 0
11 0.11685823 0.82987804 0.90789473
12 0.80076628 0.49512195 0.94298245
13 0.31034482 0.54634146 0.12719298
Volume 02, No. 4, April 2016
P
age
34
15 0.31609195 0.99451219 0.95614035
16 0.29501915 0.97987804 0.94736842
Table 5Grey relational loss
Experimental runs ΔMRR ΔRa ΔParallelism
1 0.98850575 0.46097561 0.41228071
2 1 1 0.0877193
3 0.651341 0.42317074 0.07017544
4 0.37164751 0.77987805 0.07017544
5 0.9329502 0.41707318 0.45614036
6 1 0.30914635 0.41666667
7 0.45019158 0.44390244 0.00877193
8 0.49042146 0.525 0
9 0.79885058 0.91097561 0.11043509
10 0 0.40548781 1
11 0.88314177 0.17012196 0.09210527
12 0.19923372 0.50487805 0.05701755
13 0.68965518 0.45365854 0.87280702
14 0.76245211 0 0.08333334
15 0.68390805 0.0054878 0.04385965
Volume 02, No. 4, April 2016
P
age
35
Table 6Grey relational co-efficient
Experimental run ξMRR ξRa ξParallelism
1 0.33590733 0.52030456 0.54807691
2 0.33333333 0.33333333 0.85074626
3 0.43427620 0.54161162 0.87692307
4 0.57362637 0.39066221 0.87692307
5 0.34893047 0.54521276 0.52293577
6 0.33333333 0.61793518 0.54545454
7 0.52620967 0.52971576 0.98275862
8 0.50483558 0.48780487 1
9 0.38495575 0.35436473 0.81908790
10 1 0.55218854 0.33333333
11 0.36149584 0.74613283 0.84444443
12 0.71506848 0.49757281 0.89763778
13 0.42028985 0.52429667 0.36421725
14 0.39605462 1 0.85714284
15 0.42233009 0.98914355 0.91935483
Volume 02, No. 4, April 2016
P
age
36
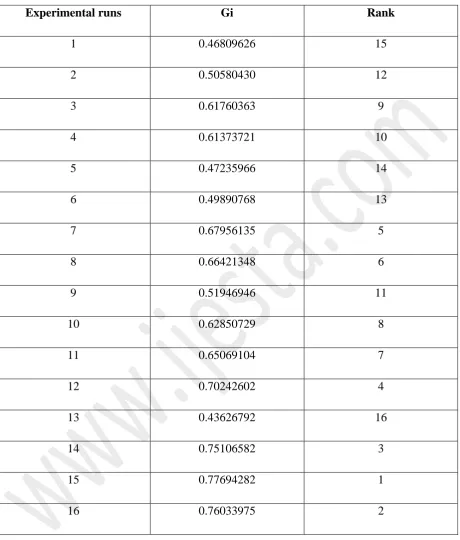
Table 7Grey relational grade
Experimental runs Gi Rank
1 0.46809626 15
2 0.50580430 12
3 0.61760363 9
4 0.61373721 10
5 0.47235966 14
6 0.49890768 13
7 0.67956135 5
8 0.66421348 6
9 0.51946946 11
10 0.62850729 8
11 0.65069104 7
12 0.70242602 4
13 0.43626792 16
14 0.75106582 3
15 0.77694282 1
16 0.76033975 2
Response Table for Means
Volume 02, No. 4, April 2016
P age
37
4 0.6812 0.6852 0.5895 Delta 0.1298 0.2111 0.0486 Rank 2 1 3
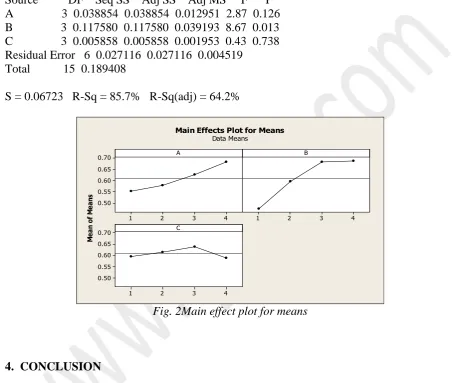
Analysis of Variance for Means R-Sq = 85.7% R-Sq(adj) = 64.2%
Source DF Seq SS Adj SS Adj MS F P A 3 0.038854 0.038854 0.012951 2.87 0.126 B 3 0.117580 0.117580 0.039193 8.67 0.013 C 3 0.005858 0.005858 0.001953 0.43 0.738 Residual Error 6 0.027116 0.027116 0.004519
Total 15 0.189408
S = 0.06723 R-Sq = 85.7% R-Sq(adj) = 64.2%
4 3 2 1 0.70 0.65 0.60 0.55 0.50 4 3 2 1 4 3 2 1 0.70 0.65 0.60 0.55 0.50 A M ea n of M ea ns B C
Main Effects Plot for Means Data Means
Fig. 2Main effect plot for means
4. CONCLUSION
Volume 02, No. 4, April 2016
P
age
38
Taguchi parameter design can provide a systematic procedure that can effectively and efficiently identify the optimum surface roughness in the process control of individual end milling machines. It also allows industry to reduce process or product variability and minimize product defects by using a relatively small number of experimental runs and costs to achieve superior-quality products. This research only demonstrates how to use Taguchi parameter design for optimizing machining performance for minimum surface roughness. This approach can be recommended for continuous quality improvement and off-line quality of any production process.
REFERENCES
i. Y. H. Tsai, J.C. Chen, and S.J. Lou (1999) In-process surface recognition system based on neural networks in end milling cutting operations, Int. J. Mach. Tool Manuf., vol. 39 (4).
ii. K. H. Fuh and C.F. Wu (1995) A proposed statistical model for surface quality prediction in end-milling of Al alloy, Int. J. Mach. Tool Manuf., vol. 35 (8), pp. 1187–1200.
iii. J. A. Ghani, I. A. Choudhury, and H. H. Hassan (2004) Application of Taguchi method in the optimization of end milling, J. Mater. Process. Tech., vol. 145 (1), pp. 84–92.
iv. W. Bouzid, A. Zghal, and L. Sai (2004) Taguchi method for design optimization of milled surface roughness, Mater. Technol., vol. 19 (3), pp. 159–162.
v. Lakshmi. V.V.K, Venkata Subbaiah.K (2012) Modelling and optimization of process parameters during end milling of hardened steel, International Journal of Engineering Research and Applications, Vol 2, No.2, 674-679p.
vi. Jaya Krishna.N, Sidda Reddy.B, Vijaya Kumar Reddy.K (2011) Modeling of machining parameters in CNC end milling using Principal component analysis based Neural networks , Innovative Systems Design and Engineering, Vo.2, No.3, 1-13pp.
vii. Babu.J and Sunny. T (2013), Optimization of process parameters in drilling of GFRP composites drilled by an end mill”, International Journal of Resent Development in Engineering and Technology, Vol.1, No. 1,16-23pp.