Drying and quality features of selected maize varieties dried in
commercial processing complexes
Md. Akhtaruzzaman
1, Mouluda Sohany
1, Mohammad Ali Basunia
2,
Md. Khaled.Hossain
3, Md. Sazzat Hossain Sarker
1*(1. Department of Food Engineering and Technology, Faculty of Engineering, Hajee Mohammad Danesh Science and Technology University, Dinajpur 5200, Bangladesh;
2. Department of Mechanical Engineering, Faculty of Engineering, Institut Teknologi Brunei (ITB), Brunei Darussalam;
3. Department of Microbiology, Faculty of veterinary and Animal Sciences, Hajee Mohammad Danesh Science and Technology University, Dinajpur 5200, Bangladesh)
Abstract: The drying status and quality aspects in terms of physical, nutritional, functional properties and microbial status of three common maize varieties (900M gold, pioneer 92 and kavri) dried in different drying complexes are presented in this paper. Total drying varied from18-20 h for drying of freshly harvested maize varieties in the complexes where sun drying method was used. The overall calculation reveled that drying cost in the mills ranged from US$11.5 to US$14.75 per ton of fresh maize (1 US$ equals 80 BDT). The dimensions of the maize varieties as length, width and thickness were found to be ranged from 12.62±0.34 to 14.54±0.32, 9.56±0.24 to 10.60±0.35, 6.38±0.28 to 7.3±0.41 mm, respectively. The 900M gold variety gave the highest bulk density of 575.84±3.8 kg m-3. The highest crude protein (8.75%±0.10%) and water solubility index (1.90±0.02 gm gm-1 of gel) were found in the dried samples of 900 M gold variety at 14% moisture content. The highest ash, fat and starch content were 2.01%±0.02%, 3.97%±0.09% and 76.33%±0.88%, respectively in pioneer 92 varieties at 14% moisture content. The highest microbial load was found at higher moisture dried grain (14%) than lower moisture dried samples. The quality of dried grain was found to be affected with the variation in final moisture content during storage. Therefore, maize should be dried at moisture content less than 14% to maintain quality and to keep free from microbial infestation for its future use as food and feed.
Keywords: maize drying, drying cost, physical properties, nutritional quality, moisture content, microbial load
Citation: Akhtaruzzaman, M., M. Sohany, M. A. Basunia, M. K. Hossain and M. S. H. Sarker. 2017. Drying and quality features of selected maizevarieties dried in commercial processing complexes. Agricultural Engineering International: CIGR Journal, 19(3): 148–155.
1 Introduction
Drying and management of maize is an important
issue in the present world. Because, it’s increased
production and versatile usage in food and feed industries
are increasing day by day whole over the world. The
average yield of this crop is higher than other crops
(Farnham et al., 2003). The world production was
Received date: 2016-08-31 Accepted date: 2016-12-01
* Corresponding author: Md. Sazzat Hossain Sarker, Department of Food Engineering and Technology, Hajee Mohammad Danesh Science and Technology University, Dinajpur 5200. Phone: +8801705950003, Email: [email protected]
1,014.02 million metric ton in 2014 to 2015 (USDA,
2016). It is extensively cultivated in several Asian
countries of the world including Thailand, China, India,
Pakistan and Bangladesh. The maize production was
2.23 million metric tons in Bangladesh during 2013-2014
(Bangladesh Bureau of Statistics [BBS], 2014).
Several varieties of maize including hybrid are
cultivated in this country. Maize is a good source of
important nutrients. It contains 11.2% protein, 66.2%
carbohydrate, 3.6% fat, 1.5% minerals and 2.7% fiber
(Gopalan et al., 1981). Additionally it contains carotene,
niacin, thiamine and riboflavin. Maize grain makes 60%
feed (Dalhke et al.,2001). The grain of maize gives the
highest conversation ratio to meat and eggs when
compared with other cereal grain because of its high
starch and low fiber content. In tropical countries greater
portion of yellow maize is more preferable for livestock
feed. Maize is an important industrial raw material in the
starch, feed and food industry. Maize provides greater
nutritional value when it is used as an ingredient in the
food processing and feeding industry (Ullah et al., 2010).
Sun drying (natural air drying) is the most common
farming and agricultural process in many countries like
Bangladesh, particularly where the open-air temperature
reaches 30°C or higher. Natural air drying is a method
used to dry maize by passing unheated (natural) air
through the grain mass until its moisture content reaches
equilibrium moisture content (EMC). The advantage of
drying grain in the sun is that it is an inexpensive and
easily manageable method. Open air natural sun drying
on mud-plastered or concrete floors is the conventional
method of drying grain. Unfavorable weather conditions
are likely to occur during the harvesting and drying
period thus quality degradation and microbial infestation
of the final product become common. The safe moisture
content for cereal grains is usually 12% to 14% on wet
basis (Bala, 1997).
Improper drying affects quality of dried grains.
Drying is practiced to maintain the quality of grain during
storage to prevent the growth of bacteria, fungi, insects
and mites. If grain is dried at high temperature,
discoloration and other kinds of heat damage may occur
(Foster, 1982). Maize kernel weight and germination
decreased if air temperature increased from 25°C to
100°C (Peplinski et al., 1994). During high temperature
drying, maize grains quality undergo alterations such as
stress crack (Gustafson et al., 1979) and protein
denaturation (Malumba et al., 2008). In addition to stress
cracking and breakage, the change in colour of the kernel
caused by thermal effects is also important, particularly
when drying involves very high temperatures.
Stress-cracking is the major quality problem caused by
high temperature drying and rapid cooling of grain.
Fractures in the maize endosperm lead to problems in
both storage and processing.
To ensure high quality during storage, maize should
be protected from weather, growth of microorganisms,
and insects (Oyekale et al., 2012). Lynch and Morey
(1989) investigated that ambient air maize drying offers
advantages in maize quality compared to high
temperature drying but the drying process takes place
over a much longer period of time. Mechanical drying of
maize requires high initial costs. Mechanical dryers is
faster and gives a better quality product but they are
expensive and requires substantial quantities of fuel or
electricity to operate, leading to high cost of drying (Ajay
et al., 2009).
Most of the commercially available dryers are
designed to suit the needs of the processing industry and
their output capacity is therefore far above the needs of
individuals, or even of farmer groups. Sun drying
methods are followed by the most of the maize farmers
and millers in Bangladesh which must be assessed for
suggesting efficient drying operation. Limited reviews are
found where the effect of final moisture content of dried
maize on grain quality during storage is reported. There is
inadequate information on the effect of varieties of maize
on quality of dried grain used for food and feed. This
study is important to find out the facts and figure of
commercial drying of maize so as to suggest for future
improved drying practices.
2 Materials and methods
2.1 Site selection and data collection
Five major maize growing areas of Dinajpur namely
Basher hat, Khesalpur, Dashmile, Teromile, and Birganj
were selected for data collection of this study. 10 maize
processing complexes from the above areas were selected
for data collection. A comprehensive questionnaire was
prepared to collect necessary data on maize drying. Data
were collected based on verbal report, interview and
some physical observations.
2.2 Moisture content determination
AOAC method 7.045 (2000) was used to determine
the moisture content of maize sample. 5 g grind sample
was taken in a clean, dry and pre-weighed crucible. Then
the powder was transferred to an oven and dried at 105°C
weighed. Again it was transferred to an oven and dried
until a constant weight was obtained. Finally it was
cooled and weighed.
Moisture content weight basis (wb) was calculated by
the following Equation (1):
1 2
Moisture (%) W W 100
W −
= × (1)
where, W1 = weight of sample with crucible, g; W2 =
weight of dried sample with crucible, g, and W = weight
of wet sample, g.
2.3 Drying time and drying cost calculation
Total drying time, number of labour required to
accomplish whole drying process for a batch were
recorded based on verbal report and physical observation.
Unit drying cost in Tk ton-1 was then calculated as
Equation (2): (Hellevang and Reff, 1987).
Cost of drying for one batch (Tk)
Cost/ton 1000
Amount of raw maize in one batch (kg)
= ×
(2)
While cost included (labour cost, drying floor cost,
packaging cost, transportation cost ,blowing cost and
others related to drying). The unit of cost was then
converted to US$/ton. It is noted that the drying cost was
similar in case of all varieties of raw maize.
2.3 Determining physical properties of maize
2.3.1 Sample collection
Three varieties of sun dried maize (900M gold,
pioneer-92, kavri-50) were collected from different
drying complexes. Because, these varieties are
extensively grown and covering large area.
2.3.2 Grain dimensions
25 kernels were selected randomly for determination
of kernel dimensions (Length, width and thickness) with
a vernier calliper according to the method of
Martinez-Herrera and Lachance (1979). All the
dimensions were taken in mm.
2.3.3 Bulk density
Bulk density was determined by weighing the amount
of grain in 50 cm3 calibrated beaker based on a
modification of the method used by Kikuchi et al. (1982).
An average of 5 measurements represented one
determination. Test Bulk density was expressed as mass
per unit volume (kg m-3).
2.4 Nutritional analysis
2.4. 1 Sample preparation
Dried maize of the three varieties at different moisture
content (14% and 12%) were used in this study. Samples
were initially grounded by a mortar and pestle and passed
through a 60 mesh sieve. The powdered samples of
particular moisture content were packed in high density
polyethylene (HDPE) package at room temperature until
further analysis.
2.4.2 Crude protein content determination
Crude protein content was determined by AOAC
official method (2000). Three stages were used to
determine protein content such as digestion, distillation
and titration.
i) Calculation for N2 content:
% of N2 = Burette reading × Normality of H2S04 ×
mL equivalent of N2
Here, Normality of H2S04=0.2; mL equivalent of N2=1.4.
ii) Calculation for protein content:
% Protein = % of N2×Protein factor
Here, Protein factor = 6.25.
2.4.3 Ash content determination
Ash content of maize sample was analyzed by AOAC
official method (2000). 5 g powdered sample was taken
in pre weighed crucible. Then it was placed in muffle
furnace at 550°C to 600°C for 5-6 h. After ashing, the
crucible was cooled and kept for some time in a
desiccator and weighed. From the weighs recorded the
present ash content was calculated by the following
Equation (3):
1 2
Ash (%) A A 100
A −
= × (3)
where, A1 = weight of ash with crucible, g; A2 = weight of
empty crucible, g, and A = weight of sample, g.
2.4.4 Fat content determination
AOAC method 7.045 (2000) was used to determine
the fat content of the grounded maize flour. Five grams
sample was taken into thimble. The thimble was attached
to the Soxhlet apparatus which was attached with a round
bottom flask containing 200 ml ether. The fat was
extracted for 5-6 h. After that ether was evaporated at
80°C until the flask completely dried.
1 2
Fat (%) F F 100
F −
= × (4)
where, F1 = weight of evaporated flask with sample, g;
F2 = weight of empty flask, g, and F = weight of sample
in g.
2.4.5 Starch determination
Onegram of oven dried powdered sample was taken
in an erlenmeyer flask and 50 mL of cold water was
added. The content of flask was allowed to stand for one
hour with occasional stirring. It was then filtered and the
residue was washed with 50 mL distilled water. The
sample was hydrolyzed with 10% HCl for 2.5 h under
reflux. The hydrolysate was neutralized with dilute
sodium hydroxide solution and filtered. The filtrate was
collected in a 100 mL volumetric flask and the volume
was made up to 100 mL.
The reducing sugar in the filtrate was determined by
Fehling’s titration method and the amount of glucose was
calculated as following Equation (5):
Starch (%) = glucose (%)×0.9 (5)
2.5 Functional properties
2.5.1 Water adsorption index (WAI)
WAI was determined according to the method
reported by Asaduzzaman et al.(2013). Powdered sample
(0.83 g) was suspended with 10 mL of water into a 30 mL
of tared centrifuge tube. The mixture was centrifuged for
30 min at 4000 rpm and the supernatant was poured
carefully into a tared dish. The residue was weighed.
Water absorption index was determined by following
Equation (6):
-1 1 2
WAI (gel g ) X X 100
X −
= × (6)
where, X1 = weight of tube with residue, g; X2 = weight of
the tube, g, and X = weight of sample, g.
2.5.2 Water solubility index (WSI)
WSI was also determined according to the method
reported by (Asaduzzaman et al., 2013) .Dried flour
(0.83 g) was suspended with 10 mL of water into a 30 mL
of tared centrifuge tube. The mixture was centrifuged for
30 min at 4000 rpm and the supernatant was poured
carefully into a tared dish. The supernatant was dried at
70°C until obtained a constant weight. Then it was cooled
and weighed.
WSI was finally calculated by following Equation (7):
1 2
WSI (%) S S 100
S −
= × (7)
where, S1 = weight of dish and dried sample, g; S2 =
weight of dish, g, and S = weight of dried sample, g.
2.6 Microbial load calculation
The dried maize samples were collected from three
mills. Then the samples were surface sterilized with 70%
ethanol and rinsed in peptone water according to the
methods of (Böltner et al., 2008). The samples were then
mashed with mortar and pestle to expose the microbes
inhabiting. One gram of the maize sample was dissolved
in 99mL distilled water and further serial dilution 10-5 to
10-7 for bacterial colonizers, using the pour plate methods
according to Orole and Aedjumo (2011). One gram of
bruffed peptone was dissolved in 999 mL of distilled
water. From the prepared peptone water serial dilution
was made 10-5 to 10-7 for bacterial isolation. 1ml of each
dilution was placed into petri dishes, using the pour plate
technique. The petri dishes were incubated at 37°C, 18 to
24 h for bacterial colony according to the method of
(Zinniel et al., 2002).
2.7 Statistical analysis
All measurements were carried out in triplicate for
each of the sample except particle dimensions (25 times)
for calculating average. Results are expressed as mean
values standard error mean. Data were analyzed using
statistical software (SPSS windows version 20). Mean
comparisons were performed using Duncan’s multiple
range tests for significant effect at least of p<0.05.
3 Results and discussion
3.1 Drying cost of maize in commercial processing
complexes
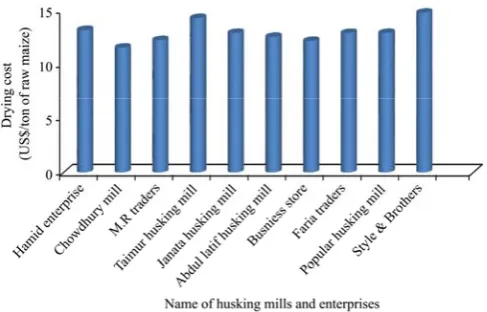
Drying cost was found to be ranged from US$11.5 to
US$ 14.75. The highest cost was obtained by Styles &
Brothers mill as shown in Figure 1. Similar drying cost
was exhibited by Taimur husking mill. The results
slightly varied with other mills such as Faria traders,
Hamid enterprise, and Janata husking mills respectively.
The lowest cost was obtained by Chowdury mills. The
drying cost varied between different grain processors due
and area of drying complexes. Transportation of products
generally contributes a significant portion of overall
harvest and drying cost variability (Curtin et al., 1980).
Figure 1 Drying cost of maize in different millers of Dinajpur district
3.2 Physical properties of maize
The grain dimensions (Length, Width, and Thickness)
are presented in Table 1. The highest frequency was
obtained at 12 mm length of pioneer variety as shown in
Figure 2 and the kernel length of this variety significantly
varied with the other varieties. Kernel length of 900M
gold was found in lowest frequency. Width of 900M gold
and pioneer maize varieties showed almost similar result
compared to the kavri variety as shown in Figure 3. The
thickness of maize kernel also varied with their varieties
as shown in Figure 4. Kernel (length, width and thickness)
ranged from 9mm to 17 mm, 7mm to 13 mm and 4mm to
10 mm respectively as shown in Figure 2, Figure 3 and
Figure 4. The knowledge of physical properties is
necessary to optimize the design of equipment’s for
post-harvest handling and processing of agricultural
products (Aviara et al., 1999).
Table 1 The physical properties of three maize varieties Name of
variety
Length, mm
Width, mm
Thickness, mm
Bulk density, kg m-3 900M gold 14.54±0.32b 10.24±0.21ab 6.74±0.28c 575.84±3.8c pioneer 92 12.98±0.39c 9.56±0.24c 7.3±0.41c 563.44±6.52c
kavri 50 12.62±0.34c 10.60±0.35b 6.38±0.28c 567.52±12.61c
Note: Values are mean ± Standard Error Mean of three replicates. (a-c) The test values along the same column carrying different superscripts for each composition are significantly different at least of (p<0.05).
The highest bulk density was found in 900M gold
variety. Even though there is no significant difference in
bulk density but slightly different results were obtained
from pioneer and kavri varieties. The bulk density of
grains is useful for the design of silos and storage bins
(Nalladulai et al., 2002). Hybrids for 900M gold and
kavri 50 would be more desirable for industrial dry
milling based on our test weight results.
Figure 2 Length frequency distributions for three maize varieties
Figure 3 Width frequency distributions of three maize varieties
Figure 4 Thickness frequency distributions of three maize varieties
3.3 Nutritional quality of dried maize
3.3.1 Crude protein content
The protein content of the three maize varieties was
found to be 8.75%, 7.99% and 7.72% (wb) at 14%
moisture content Table 2. The crude protein content for
12% moisture grain was found 7.99%, 7.58%, and 8.2 2%
on wet weight basis Table 3. The highest crude protein
values were found in 900M gold variety for 14%
moisture content. On the other hand the highest crude
protein values obtained in kavri variety at 12% moisture
content. Significant differences were observed between
samples at different moisture content (Table 2 and 3).
These values were also similar with (Rostagno, 1993). He
and 8.6% respectively. (D’ Agostini et al., 2004) also
found the minimum crude protein values of 7.3% wet
weight basis. This variation could be occurred due to
fertilizer application on maize field and environmental
conditions (Lima et al., 2000).
Table 2 Nutritional characteristics of dried maize at 14% moisture content
Sample Crude protein, % Ash, % Fat, % Starch, %
900 M Gold 8.75±0.10b 1.48±0.01c 3.15±0.12c 59.67±0.88c pioneer 92 7.99±0.21c 2.01±0.02b 3.97±0.09b 76.33±0.88c kavri 50 7.72±0.10c 1.53±0.11c 3.96±0.02b 69.00±0.58b
Note: Values are mean ± standard error mean of three replicates. (a-c) The test values along the same column carrying different superscripts for each composition content are significantly different at least of (p<0.05).
Table 3 Nutritional characteristics of dried maize at 12% moisture content
Sample Crude protein, % Ash, % Fat, % Starch, % 900 M Gold 7.99±0.21ab 1.61±0.01c 3.18±0.04c 56.16±0.15c
pioneer 92 7.58±0.06c 1.10±0.01c 4.28±0.04c 67.4±0.89c kavri 50 8.22±0.10b 1.24±0.02b 4.12±0.02b 60.68±0.36b Note: Values are mean ± standard error mean of three replicates. (a-c ) The test
values along the same column carrying different superscripts for each composition content are significantly different at least of (p<0.05).
3.3.2 Ash content
The ash content was found to be 1.48%, 2.01% and
1.53% respectively in 900M gold, pioneer 92 and kavri
50 at 14% moisture content as shown in Table 2. The
highest ash content was found in pioneer variety than
others. The ash content found in the present study was
1.61%, 1.10% and 1.24% for 900M gold, pioneer 92 and
kavri 50 for 12% moisture content respectively (Table 3).
The highest value was obtained in 900M gold variety.
These values are nearly similar to the value of 1.2%
which was found by Watt and Merrill (1950). The
variation in ash content in different varieties might be due
to the locality (Ocloo et al., 2010).
3.3.3 Crude fat content
The highest fat content was found in pioneer variety
compare to others as shown in Table 2. Maize sample of
12% moisture content found the fat content in the range
of 3.18% to 4.28% (Table 2). The percent of crude fat
obtained from dried maize in this study was consistent
and in agreement with other researchers (Aseiedu et al.,
1993).
3.3.4 Starch content
The amount of starch in different maize varieties
varied from 56.16% to 76.44% as shown in Table 2 and
Table 3. The highest starch percent was found in pioneer
92 varieties as mention in Table 2. So, it is found that
percent moisture has an effect on starch content. The
highest starch percent was found in pioneer 92 variety as
shown in Table 3. The variety and percent moisture had
an effect on starch content.
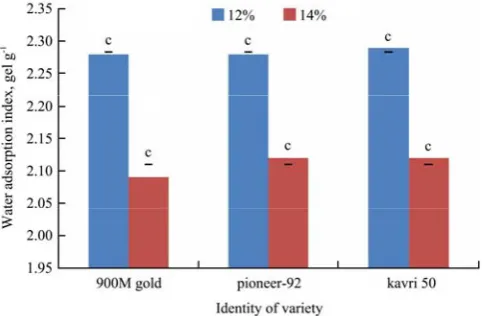
3.4 Functional properties
The functional properties of different varieties of
dried maize at particular moisture content are shown in
Figure 5 and Figure 6. The WAI in different varieties
varied between 2.09 gel g-1 to 2.12 gel g-1 and 2.28 gel g-1
to 2.29 gel g-1 at 14% and 12% moisture content
respectively. The highest value was found at 12%
moisture content while the lowest value of WAI at 14%
moisture content. Higher moisture content resulted in
lower WAI because it is a usual phenomenon. Since a
long period of drying breaks down the starch chains,
which generates sort chains, these chain retain a large
number of water molecule (Bello-Pèrez et al.,
2002).These might be attributed to loss of starch
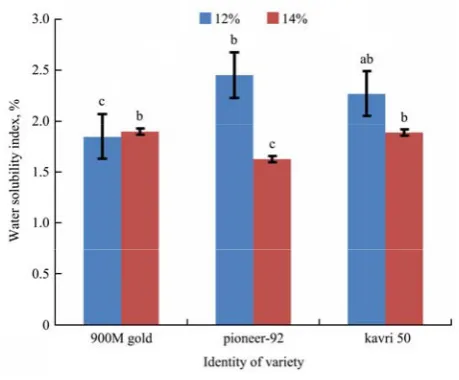
crystalline structure (Asaduzzaman et al., 2013). WSI in
different maize flour ranged between 1.63% and 1.90% at
14% moisture content whereas 1.85% to 2.45% at 12%
moisture content. The highest value obtained from
pioneer 92 at 12% moisture content and lowest value
from 900M gold at 14% moisture content. Water
solubility index can depend on the semi crystalline
structure and disruption of starch granule and water
molecules are bonded to the free hydroxyl groups of
amylose and amylopectin by hydrogen bonds (Eliasson
and Gudmundsson, 1996).
Figure 6 WSI of three maize varieties 3.5 Microbial status of dried maize
Microbial statuses of maize samples from selected
mills were presented in Table 4.
The bacterial load varied from mill to mill and then
variety to variety.
Table 4 Microbial status of dried maize Name and location of
drying unit
Variety of maize sample
Moisture content, %
Bacterial load, cfu g-1
14 24×105 Hamid enterprise,
Basherhat, Dinajpur kavri 50 12 2×10⁵
14 9×10⁵ Choudhury mills,
Khesulpur, Dinajpur 900M gold 12 8.2×10⁵
14 62×105
M.R. traders Dashmail,
Dinajpur pioneer 92 12 27×105
The higher bacterial load was found at 14% moisture
content from 9×10⁵ to 62×105 cfu g-1 whereas the lower
bacterial load was found in the low range of 2×10⁵ to
27×105 cfu g-1 at 12% moisture content as shown in Table
4. The bacterial load of different varieties fluctuated with
each other (Table 4). Orole and Adejumo (2011) found
bacterial count (cfu g-1) of dried yellow grains was 2×10⁵.
The similar result was obtained by (Böltner et al.,2008).
The variation of microbial growth occurred due to the
effect of grain moisture, their storage condition and also
drying floor. Reed et al. (2007) also reported that the
higher the initial moisture contents the greater the
infection of maize kernel. So, percent of moisture content
has a significant effect for growth of microbes.
4 Conclusions
This study investigated drying characteristics and
physical and nutritional quality of dried maize in
commercial processing complexes. Drying time was 18 to
20h. Drying cost was higher for Style and Brothers mill
and it was US$14.75. Significant differences were found
in kernel dimensions and bulk densities and nutritional
qualities among different varieties. The highest bacterial
load was found at 14% moisture content. It can be
recommended that dried maize of 900M gold can be used
as raw material in food and feed industries of Bangladesh
for preparing various value added products because of its
high nutritional quality. The overall results showed that
variety of pioneer 92 can be used as a good source of
starch as well as thickening and binding agent in food
system. Further work can be done to develop more
efficient drying method or dryer for drying of maize at
lower cost.
References
Ajay, C., K. S. Sunil, and D. P. Deepak. 2009. Design of solar dryer with turboventilator and fireplace. In Proc. International Solar Food Processing Conf. Indore, India, 14-16 January. AOAC. 2000. Official Methods of Analysis of the Association of
Official Analytical Chemist. 17th ed. Washington D.C., Gaithersburg: Association of Analytical Communities.
Asaduzzaman, M., M. E. Haque, J. Rahman, S. K. Hasan, M. A. Ali, M. S. Akter, and M. Ahmed 2013. Comparisons of physiochemical, total phenol, flavonoid content and functional properties in six cultivars of aromatic rice in Bangladesh, African. Journal of Food Science, 7(8):198–203.
Aseiedu, M., R. Nilsen, Ø. Lie, and E. Lied. 1993. Effect of processing (sprouting and/or fermentation) on sorghum and maize. I: proximate composition, minerals and fatty acids. Food chemistry, 46(4): 351–353.
Aviara, N. A., M. I. Gwandzang, and M. A. Haque. 1999. Physical properties of guna seeds. Journal of Agricultural Engineering Research, 73(2): 105–111.
Bala, B. K. 1997. Drying and Storage of Cereal Grains. USA: Science Publishers, Inc.
Bangladesh Bureau of Statistics (BBS). 2014. Statistical Year Book of Bangladesh. 34th ed. Dhaka, Bangladesh: Bangladesh Bureau of Statistics, Planning Division, Ministry of Planning, Government of the People’s Republic of Bangladesh. Bello-Pérez, L. A., L. Sánchez-Hernández, E. Moreno-Damían and
J. F. Toro-Vazquez. 2002. Laboratory scale production of maltodextrins and glucose syrup from banana starch. Acta Cientifica Venezolana, 53(1): 1–9.
Rhizormediation of lindane by root-colonizing Sphingomonas. Microbial Biotechnology,1(1): 87–93.
Curtin, D. T., R. T. Brooks Jr, W. R. Forrester Jr, and J. G. Paul. 1980. Biomass harvesting system test and demonstration. United States: Tennessee Valley Authority, Norris (USA). Div of Land and Forest Resources.
D’Agostini, P., P. C. Gomes, L. F. T. Albino, H. S. Rostango, and L. M. Sá. 2004. Valores de composição química e energética de alguns alimentos para aves. Revista Brasileira de Zootecnia, 33(1): 128–134.
Dalhke, F., A. M. L. Ribeiro, A. M. Kessler, and A. R. Lima. 2001. Tamanho da partícula do milho e forma física da ração e seus efeitos sobre o desempenho e rendimento de carcaça de frangos de corte. Revista Brasileira Ciência Avícola, 3(3): 241–248.
Eliasson, A. C., and M. Gudmundsson. 1996. Starch: physicochemical and functional aspects. In Carbohydrates in Food, 2nd ed. A. C. Eliasson ed, ch. 10, 431–503.New York: Marcel DekkerInc.
Farnham, D. E., G. O. Benson, and R. B. Pearce 2003. Corn perspective and culture. In Corn: Chemistry and Technology, 2nd ed. eds. P. J. White and L. A. Johnson, ch. 1, 1–33. St. Paul, Minesota, USA: American Association of Cereal Chemicals Inc.
Foster, G. H. 1982. Drying cereal grains. In Storage of Cereal Grains and their Products. ed. C. W. Christensen, 79–116. St. Paul, MN: American Association of Cereal Chemists Inc. Gopalan, C. R. B. V., B. V. Rama Sastri, and S. C.
Balasubramanian. 1981. Nutritive Value of Indian Foods. Hyderabad, India: National institute of nutrition.
Gustafson, R. J., D. R. Thompson, and S. Sokhansanj. 1979. Temperature and stress analysis of corn kernel-finite element analysis. Transactions of ASAE, 22(4): 955–960.
Hellevang, K. J., and T. Reff. 1987. Calculating grain drying cost. AE-923, North Dakota State University Extension Service, April, 1987.
Kikuchi, K., I. Takatsuji, M. Tokuda, and K. Miyake. 1982. Properties and uses of honey and floury endosperms of corn. Journal of Food Science, 47(5): 1687–1692.
Lima, G. J. M. M., J. M. Singer, and A. L. Guinoni. 2000. Classificação do milho, quanto a composição em alguns nutrientes através do emprego de análises e conglomerados. Anais do Congresso Nacional de Milho e Sorgo, 23, 318. Uberlândia, Minas Gerais, Brasil: ABSM.
Lynch, B. E., and R. V. Morey. 1989. Control strategies for ambient air corn drying. Transactions of the ASAE, 32(5): 1727–1736.
Malumba, P., C. Vanderghem, C. Deroanne, and F. Béra. 2008.
Influence of drying temperature on the solubility, the purity of isolates and the electrophoretic patterns of corn proteins. Food Chemistry, 111(3): 564–572.
Martinez-Herrera, M. L., and P. A. Lachance. 1979. Corn (Zea mays L.) kernel hardness as an index of the alkaline cooking time for tortilla preparation. Journal of Food Science, 44(2): 377–380.
Nalladulai, K., K. Alagusundaram, and P. Gayathri. 2002. Airflow resistance of paddy and its byproducts. Biosyststems Engineering, 831(4): 67–75.
Ocloo, F. C. K., D. Bansa, R. Boatin, T. Adom, and W. S. Agbemavor. 2010. Physicochemical, functional and pasting characteristics of flour produced from jackfruits (Artocarpus heterophyllus) seeds. Agriculture and Biology Journal of North America,1(5): 903–908.
Orole, O. O., and T. O. Adejumo. 2011. Bacterial and fungal endophytes associated with grains and roots of maize. Journal of Ecology and the Natural Environment, 3(9): 298–303. Oyekale, K. O., I. O. Daniel, M. O. Ajala, and L. O. Sanni. 2012.
Potential longevity of maize seeds under storage in humid tropical seed stores. Nature and Science,10(8): 114–124. Peplinski, A. J., J. W. Paulis, J. A. Bietz, and R. C. Pratt. 1994.
Drying of high moisture corn: changes in properties and physical quality. Cereal Chemistry, 71(2): 129–133.
Reed, C., S. Doyungan, B. Ioerger, and A. Getchel. 2007. Response of storage molds to different initial moisture contents of maize (corn) stored at 25°C, and effect on respiration rate and nutrient composition. Journal of Stored Products Research, 43(4): 443–458.
Rostagno, H. S. 1993. Disponibilidade de nutrientes em grãos de má qualidade. Anais da Conferência Apinco Ciência e Tecnologia Avícolas, 129–129. Santos, São Paulo, Brasil. Ullah, I., M. Ali, and A. Farooqi. 2010. Chemical and nutritional
properties of some maize (Zea mays L.) varieties grown in NWFP, Pakistan. Pakistan Journal of Nutrition, 9(11): 1113–1117.
USDA. 2016. United States Department of Agriculture Foreign Agricultural Service Circular Series WAP. Available at: http://www.pecad.fas.usda.gov/. Accessed 11–16November. Watt, B. K., and A. L. Merrill. 1950. Composition of Foods Raw,
Processed, Prepared. Agriculture Handbook No. 8, USDA, Washington, D. C.