Application in Mixed Gas Identification
Chunsheng Kong, Wei Chen, Caihong Wei, and Min Pan
Department of Biomedical Engineering, Zhejiang University, China, HangzhouEmail: [email protected], [email protected]
Abstract—We promote a qualitative analysis algorithm to intelligently identify the ammonia, ethanol and their mixture. This work based on an electronic nose with a set of specific gas senor array building in a temperature controlled mini-cavity. A BP neural network has been trained for identification the samples inputs which preprocessed by principal component analysis (PCA) or linear discriminant analysis (LDA) method for dimension reduction. Results showed that ammonia, ethanol and different proportions of their mixture can be identified accurately. And the LDA performed better on dimension reduction in this case.
Index Terms—electronic nose, pattern recognition, neural network, gas qualitative analysis
I. INTRODUCTION
The electronic nose [1] is a simulation of artificial olfaction using the response of specific gas senor array to distinguish the gas, mainly used in catering industry, environment, agriculture, perfumes and medical industry [2], [3]. Such as the Digital odor analyzer of England, it has played a significant role in the evaluation of the UK whiskey and tobacco. Compared with the foreign commercialization of electronic nose system, the domestic research of electronic nose system is divided into two aspects, using the existing electronic nose system to do the further research and the homemade electronic nose system. The electronic nose can be described as having three main components: the vapor delivery system, the sensor array, and the pattern recognition algorithm, as is shown in Fig. 1. Obviously, pattern recognition algorithm has become a critical component in the successful implementation of gas sensor arrays and played an important role in odor measurement. A considerable number of pattern recognizers for classification or estimation have been used to identify gas types or predict their concentration. The most popular algorithm for gas qualitative analysis including k-NN (k-Nearest Neighbor) [4], CA(Cluster Analysis) [5], DA (Discriminant Analysis), PCA (Principal Component Analysis), ANN (Artificial Neural Networks), PNN (Probabilistic Neural Network) [6], LVQ (Learning Vector Quantization) [7], SOM (Self-Organizing Map) [8]. The performance of these algorithms is satisfied in gas qualitative analysis
Manuscript received January 5, 2015; revised April 22 2015.
especially to PCA and the variations of ANN, but the development for quantitative analysis is unsatisfactory [9]. Algorithms for quantitative analysis include linear regression method like MLR, PCR and the non-linear algorithm like ANN and Fuzzy-ART.
Figure 1. The main components of electronic nose
II. EXPERIMENTAL
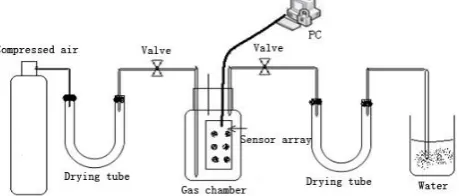
Composed by the experimental sample gas acquisition, sensor array, data acquisition, data processing and pattern recognition, the overall structure of the experimental system was as shown in Fig. 2. At first, preheat the sensor array, passing into the gas to clean the air chamber and making the measure baseline stability. Then injecting the experimental gas and collecting the response of the sensor array. At last, send the experimental data into the PC to process.
Considering that air chamber not only offered the measurement environment, but also was closely related to the density of the measurement gas, we should select the size of air chamber carefully before configuring the amount of the injected gas. The experimental gases used were different densities of ammonia, ethanol gas, and the mixture. Each gas was configured according to the volume of experimental equipment, ammonia was configured by the ammonia water that the density was 0.88g/ml, the content was 25%. As to the configuration of ethanol, taking a gas cylinder and adding 100ml anhydrous ethanol whose density was 0.79g/ml into the cylinder, then sealing the cylinder with rubber stopper and placing the cylinder into the 40°C water bath for 10 minutes. When the pressure of the upper half empty part of the bottle reached 18Kpa, ethanol left in the empty was the saturated ethanol gas. Then we could get the experimental gas after diluting the saturated ethanol gas.
and ensuring a certain degree of fault tolerance and scalability, the system selected seven different types of sensors mainly sensitive to ammonia gas and alcohols. The model and the performances of sensors were shown in Table II [10].
Figure 2. The structure of experimental system
TABLE I. THE CONCENTRATIONS OF MIXTURE
Gas Mixture (NH3/C2H5OH, ppm/ppm)
Mixture 40/30 60/50 70/60 80/70 100/90 110/100 120/110 140/130 150/140 160/150
TABLE II. MODEL AND PERFORMANCES
Model The main monitoring objects MQ3 Ethanol, gasoline, methane, hexane, propane, CO MQ137 Ammonia, hydrogen, ethanol
MQ138 Alcohols, ketones, aldehydes, aromatic compounds TGS826 Ammonia, alcohol, hydrogen
TGS832 Dichlorodifluoromethane, ethanol TGS2602 Ammonia, alcohol, hydrogen, hydrogen sulfide TGS2620 Ethanol, methane, CO
III. RECOGNITION
A. Data Preprocessing
Data preprocessing is processing the gas information collected by sensors, including filtering, switching signal and handling characteristics. Experiments show that the baseline of sensor response exist a certain difference in the same and repeated gas experiment, so we should first perform the baseline subtraction to process data. In addition to the interference caused by the sensor itself, the error caused by outside interference also has a great influence on the data. Sensor response is generally larger magnitude difference which is not conducive to recognition algorithm processing. Therefore, normalizing the data is a must, the formula as follow:
min max min i i i i i X V X V V
(1)
For “Xi ” is the response value at a certain time.
“ max
i
V ” is the maximum response value, “Vimin” is the minimum response value. Experiments show that data preprocessing not only makes the sensor response curve more smoothly so that can eliminate the effects of the environment and the sensor itself, but also minimize the environment factors to the least to improve the accuracy and repeatability of the electronic nose.
B. Feature Reduction
The amount of data collected by the sensor array is very large after preforming data acquisition for a period of time. As the sensor array used in the system included seven different sensors, after five minutes of sampling in the sampling frequency 1HZ, the dimensions of data obtained can be 300×7. When the test was repeated ten times, the data will be 3000×7 if put the data together. However, there often exists much irrelevant information and duplication of information in this high dimensional data set. In other words, there exists a large number of feature information that is very weakly correlated with the classification. Therefore, the feature reduction is a must, selecting the lower dimensional set of data from an initial high dimensional set of data to enhance the efficiency of a given work [11]. In this paper, the method of principal component analysis (PCA) and linear discriminant analysis (LDA) are used as the feature reduction before performing the BP neural network qualitative analysis [12].
PCA is the common method of feature reduction which can change the lots of relevant variables into less independent variables. And the first principal component represents variables as much as possible, the second principal component represents the remaining variables as much as possible, and so on. It is a useful statistical technique that has found application in fields such as face recognition and image compression, and is a common technique for finding patterns in data of high dimension. PCA is based on the characteristic vector of multiple parameters analysis. Its implementation can be regarded as is a certain perspective analysis of multidimensional data space, projection, to maximize his in low dimension space projection information. The algorithm flow chart of PCA is shown in Fig. 3.
LDA (Linear Discriminant Analysis) is also named as Fisher Linear Discriminant, is the classical algorithm in the field of pattern recognition. Its basic idea is that projecting the high-dimensional pattern to the best identify vector space, to extract the classification information and the compression feature space dimension, the effect of samples in the new subspace projection guarantee pattern with the maximize distance between the class and the minimum distance within the class. Therefore, it is a valid method of feature extraction, which can make the maximize model samples between with the scattering matrix, and make the minimum scattering matrix within class. LDA can ensure that the pattern of sample has the best class divisibility in space. The implementation step of LDA as follows:
At first, we defined that the sample is X X1, 2, ,Xm,
i
n is the number of sample i, U is average of all sample,
i
U is average of sample i.
For discrete matrix between class
1
( )( )
c
T
b i i i
i
S n U U U U
(2)1
(
)(
)
c
T
w i k i k
i Xk classi
S
U
X
U
X
(3)For a group of optimal identification of vector projection matrix
opt W
1 2
arg max , ,
T b
opt T d
w W S W
W w w w
W S W
(4)
To get the hyper-plane projection of sample X
T
Y
W X
(5)Figure 3. The algorithm flow chart of PCA
C. Neural Network Recognition
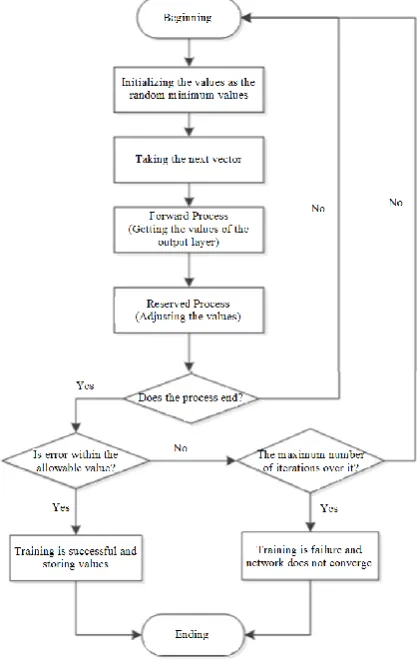
With the advantage of self-learning, associate storage and finding optimal solutions efficiently, Artificial Neural Networks has a wide range of applications in the field of pattern recognition, especially its application in the qualitative identification of gas [13]. The multilayer forward BP neural network can master the solving rule by itself through the study. Besides, the multilayer forward
BP neural network has lots of advantages including the large knowledge capacity, fast calculation, nonlinear approximation ability, the simplicity of algorithm [14]. As to the average gas qualitative issues, it can achieve recognition after a certain amount of sample learning. The flow chart of BP neural network is shown in Fig. 4.
Figure 4. The flow chart of BP neural network
IV. RESULTS AND DISCUSSION
Before the start of the experiment, preheat the sensor for 20 minutes. As to one concentration of gas configured, the experimental workflow was as follows: at first, cleaning the whole experimental system for three minutes, setting aside a certain amount of gas and injecting the gas into the chamber quickly. Then, after the gas was diffused into the all chamber and kept stabilized, heating the sensors and collecting the data for five minutes, the sampling frequency was 1HZ. At last, clean the gas chamber for three minutes after collecting the data.
Figure 5. The result of PCA
Figure 6. The result of LDA
Comparing the results of two methods, LDA method was optimal in qualitative judgment for distinguishing three different gases. The following combination with BP neural network gave the quantitative comparison. Considering the number of expected output, set the parameter of BP neural network. In the input layer, the number of neurons was 2; in the output layer, the number of neurons was 3; the number of neurons in the hidden layer was 5. Besides, selecting the S-tangent function as the transfer function of the intermediate layer neurons in BP network, and selecting S-logarithmic function as the transfer function of the output layer neurons [15]. After
setting that the error goals were 0.0001, train the network when the network parameters were set. The each number was 130, 130 and 100. Each density had ten data, taking the first seven data as training data, and the last 3 as testing data, then the testing set had 108 data, the result of test was shown in Table III.
TABLE III. RESULTS
Algorithm Number of errors Correct rate
PCA+BP 17 84.3%
V. CONCLUSION
This paper designed a special qualitative analysis algorithm to intelligently identify the ammonia, ethanol and their mixture. After collecting the data of the two single gas and mixtures of two gases, developing the data preprocessing firstly, then we could achieve qualitative identification combining with BP neural network algorithm. The experiment showed that the correct rate of the combination of PCA and BP network is 84.3%, the correct rate of combination of LDA and BP network is 100%. Furthermore, theoretically speaking, LDA was the most suitable method for classification and identification. Changing or adding the experimental gases could enhance the promotional of the algorithm and adding the interfering gases into the experiment could enhance the robust of the algorithm. Establishing a systematic workflow of configuring the gases, standardizing the gas could improve the accuracy of the algorithm. Besides, the algorithm was easy and could be transferred into some embedded systems.
ACKNOWLEDGMENT
The research work was supported by Key Projects in the National Science & Technology Pillar Program during the Twelfth Five-Year Plan Period under Grant No. 2012BAD35B03.
REFERENCES
[1] J. W. Gardner and P. N. Bartlett, “A brief history of electronic nose,” Sensors and Actuators B: Chemical, vol. 18, pp. 210-211, 1994.
[2] W. F. Wilkens and J. D. Hartman, “An electronic analog for the olfactory processes,” Journal of Food Science, vol. 29, no. 3, pp. 372-378, 1964.
[3] U. Weimar and W. Gpel, “Chemical imaging: II. Trends in practical multi-parameters sensor systems,” Sensors and Actuators B: Chemical, vol. 52, pp. 143-161, 1998.
[4] S. D. Kamath and K. K. Mahato, “Principal component analysis (PCA)-based k-nearest neighbor (k-NN) analysis of colonic mucosal tissue fluorescence spectra,” Photomedicine and Laser Surgery (Online), vol. 27, pp. 659-668, 2009.
[5] D. Scheibler and W. Schneider, “Monte Carlo tests of the accuracy of cluster analysis algorithms: A comparison of hierarchical and nonhierarchical methods,” Multivariate Behavioral Research, vol. 20, no. 3, pp. 283-304, 1985.
[6] T. C. Ahn and S. M. Ryu, “Fuzzy PNN algorithm and its application to nonlinear processes,” International Journal of General Systems, vol. 30, no. 4, pp. 463-478, 2001.
[7] P. Melin, J. Amezcua, F. Valdez, and O. Castillo, “A new neural network model based on the LVQ algorithm for multi-class classification of arrhythmias,” Information Sciences, vol. 279, pp. 483-497, 2014.
[8] E. López-Rubio and A. D. Ramos, “Grid topologies for the self-organizing map,” Neural Networks, vol. 56, pp. 35-48, 2014.
[9] C. Li, G. W. Krewer, P. Ji, et al., “Gas sensor array for blueberry fruit disease detection and classification,” Postharvest Biology and Technology, vol. 55, pp. 144-149, 2010.
[10] J. H. Cho, Y. W. Kim, K. J. Na, et al., “Wireless electronic nose system for real-time quantitative analysis of gas mixtures using micro-gas sensor array and neural-fuzzy network,” Sensors and Actuators B: Chemical, vol. 134, pp. 104-111, 2008.
[11] H. Li, W. Chen, and G. Zhu, “Special electronic nose system for banana quality detection,” Sensing Technology Journal, vol. 23, no. 11, pp. 1541-1545, 2010.
[12] H. K. Hong, H. W. Shin, H. S. Park, et al., “Gas identification using micro gas sensor array and neural-fuzzy network pattern recognition,” Sensors and Actuators B: Chemical,vol. 33, pp. 68-71, 1996.
[13] C. M. Weber, M. Cauchi, M. Patel, et al., “Evaluation of gas sensor array and pattern recognition for identification of bladder cancer from urine headspace,” Analyst, vol. 136, pp. 359-364, 2011.
[14] H. Tai, G. Xie, and Y. Jiang, “An artificial olfactory system based on gas sensor array and back-propagation neural network,” Advances in Neural Networks, vol. 3174, pp. 323-339, 2004. [15] N. H. Snow, “Head-Space analysis in modern gas
chromatography,” Trends in Analytical Chemistry, vol. 21, pp. 608-617, 2002.
Chunsheng Kong is a master in Biomedical Engineering in Zhejiang University. Nowadays, focus on the research of electronic nose and gas sensor.
Wei Chen is a Ph.D. Candidate in Biomedical Engineering in Zhejiang University. Nowadays, He focuses on CGM sensor studies and worked to industrialize a CGM sensor.
Caihong Wei is a master in Biomedical Engineering in Zhejiang University. Nowadays, focus on the research of electronic nose and gas sensor.