Vol.8 (2018) No. 5
ISSN: 2088-5334
Predicting the Amount of Digestive Enzymes Medicine Usage with
LSTM
Adhistya Erna Permanasari
#1, Abi Mahan Zaky
#2, Silmi Fauziati
#3, Ida Fitriana
* #Department of Electrical Engineering and Information Technology, Universitas Gadjah Mada, Yogyakarta, 55281, Indonesia E-mail: *[email protected]; [email protected]; [email protected]
*
Department of Pharmacology, Universitas Gadjah Mada, Yogyakarta, 55281, Indonesia E-mail: [email protected]
Abstract— Medicines are widely used to prevent or cure illness. One of the medicines, which often used to relieve stomach pain, is a
medicine that contains digestive enzymes. Hospitals and other health institutions much need this type of medicines. Hospitals and other health institutions should ensure the availability of medications for patients. This situation forces health institutions to deal with the uncertainty of medicine usage. Hospitals as one of the health institutions have some challenges. One of the challenges that must be faced is to ensure the availability of medicines for patients. The ability to predict can help ensure medicines availability in hospital. In this study will presents the forecasting model using Long Term Short Memory (LSTM) method to predict the need for medicines that contain digestive enzymes in the hospital. This method is chosen because it is known to have high accuracy to predict stationary data. One of the methods used in input identification for the LSTM method is by using the Autocorrelation Function (ACF) and Partial Autocorrelation Function (PACF). The results of this study indicate that the use of LSTM method suitable for time series forecasting in the historical dataset, with 12.733 Root Mean Square Error (RMSE) value.
Keywords— LSTM; forecasting; medicine; digestive enzymes; medicine usage.
I. INTRODUCTION
As we know, health is a very fundamental thing in life. Not only human life but also the life of all living things. Therefore, it is important to make efforts to create a good quality of health as a whole and sustainable. One way that can be done is to improve access and quality of health services. The availability of adequate medicine is an essential element in the maintenance and improvement of health service quality. Among the various options available, medicine-related issues are the most widely used in the pursuit of quality healthcare. Hence, it is necessary to control the availability of medicine by related parties.
Uncertainty over the use of medicine in a particular period is a challenge that is owned by related institutions. Hence, health institutions should conduct resource management, especially medicine resources [1]. In addition to improving the quality of health services, it can also affect the increasing competitiveness of the organization [2]. Therefore, proper forecasting can help stakeholders to identify the steps to be considered as existing resources [3].
Based on information from the World Health Organization (WHO), making predictions and calculations
made about medicines consumption, and forecasting can be used to consider in medicines purchases [4].
This paper is divided into several parts. Section I is an introduction to the research. Section II contains the theoretical basis of forecasting and LSTM method. Then Section III contains about research step, analysis, and result from the research. Moreover, the last part, the conclusion of this study will present in section IV.
II. MATERIAL AND METHOD
A. Forecasting
Forecasting is a challenging problem whose research is still evolving [13]. Forecasting of time series data consists of various types. If divided by time range, forecasting can be divided into short (between 1 day to a quarter of a year), medium (between a quarter of a year to forecast from year to year), and long-term (between one year to five years ahead). However, there is no explicit limit on health forecast horizons, and can’t be ascertained for all situations [14].
Based on data pattern, time series data is divided into four kinds of characteristics. There are seasonality, cyclical, horizontal, and trend pattern. Seasonality patterns are present in time series data sets that have seasonality factors, i.e., there is a repetition of patterns over a period. A cyclical pattern may occur if the dataset is affected by economic fluctuations. A horizontal pattern occurs when the dataset has a constant fluctuation. Moreover, the trend pattern occurs when the dataset has a rise or fall value in a long time. Also, there is also a time series dataset which is a composite of more than one pattern [15].
Based on the number of variables analyzed, the forecasting time series data is divided into two classes. The first is a univariate (one variable), the example of its forecasting method is Long Short-Term Memory (LSTM) and Autoregressive Integrated Moving Average (ARIMA) method [12]. The second is multivariate (some variables), the example of its forecasting method is Vector Autoregressive Integrated Moving Average and Vector Autoregressive (VAR) [16].
B. LSTM
Long Short-Term Memory (LSTM) method was first introduced in 1997 by scientists named Schmidhuber and Hochreiter as one of the more efficient Recurrent Neural Network (RNN) network architectures [17]. The motive in LSTM design is to converge to the optimum minimal attributed to the problem of vanishing gradients, which can successfully increase the accuracy of the model [18].
Unlike RNN that has a relatively simple hidden layer structure, LSTM has a hidden layer with a more complex structure. Each hidden layer in LSTM is known as memory cells. In this research, each memory cell is denoted by cj. cj receives input from gate inj, has output gate outj and net(c). We have
From the equation above, y(t) is the activation function at time t of inj or outj, and u is a representation of memory cells, input units, hidden units or gate units. At any time t, the output of icj is denoted by the following equation
For scj(0)=0 and t>0, it can be seen in the following equation
From the equation, equation (6) denotes h() is the function of measuring the memory cell output. And in equation (7), function g() is a differential function that squeeze net(cj(t)) [17]. In the LSTM method, for long-term forecasting, it is necessary to consider long-term dependencies between samples of training data. While on short-term forecasting, this is not necessary because RNN has good accuracy [19]. However, it still has to look for the best model to get better accuracy.
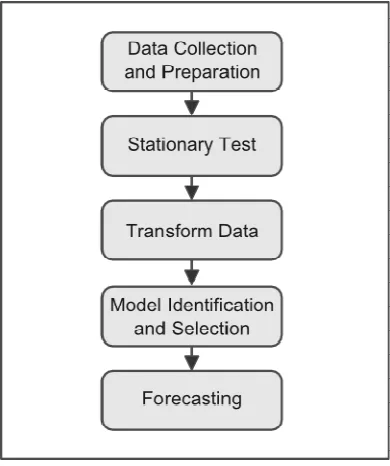
Fig. 1. Forecasting method
III.RESULTS AND DISCUSSION
A. Data Collection and Preparation
The dataset for this research is Enzyplex weekly usage at Hospital from January 2015 until December 2015 (52 weeks). Enzyplex is a digestive enzyme supplement that helps with proper digestion and helps to ensure optimal absorption of nutrients [20]. The dataset is separated into 80% training data (42 weeks) that were used for model identification and selection, and 20% test data (10 weeks) that were used to measure the error of the resulting model. Training data are shown in Figure 2. The y-axis represents the specific number of Enzyplex uses (gram) while the x-axis represents a particular week. Highest medicine use at week 26 with 94 grams.
Fig. 2. Training data
B. Stationary Test
In this section is to test whether the dataset is a stationary or not. The statistical methods used to test whether a stationary data or not are Kwiatkowski-Phillips-Schmidt-Shin (KPSS) test and Augmented Dickey-Fuller (ADF) test. In this study, we used the ADF test. In ADF test, if p-value is smaller or equal to 0.05 (p-value <= 0.05) then data is stationer. Whereas if p-value is greater than 0.05 (p-value > 0.05) then the data is non-stationer [21]. The p-value or calculated probability is the probability of results when the null hypothesis (H0) of the research question is correct [22].
Testing process using the Python programming language. We have used adfuller function in statsmodels package. After testing on the dataset, the following results are obtained
ADF Statistic: -4.891629 p-value: 0.000036
Critical Values: 1%: -3.566 5%: -2.920 10%: -2.598
From the data, the p-value of the dataset is 0.000036, and the ADF Statistic value is less than the 1% Critical Values. Then it can be concluded that the dataset is the data stationer with a confidence level of 99%. Therefore, there is no need for the differencing process to the dataset [23].
C. Transform Data
As used in other neural network methods, the dataset in the LSTM method must be at the scale of the activation function used by the network [24]. Hyperbolic tangent (tanh) is the default activation function used in the LSTM method. The output value is between the numbers -1 and 1. Therefore we must change the range in the dataset to match the expected output value of the LSTM method. In this paper, the process of transforming data using the MinMaxScaler function in the scikit-learn package with python programming language.
D. Model Identification and Selection
This section is to identify and select the model to be used for forecasting. For model development, we have used Keras package in python. The initial stage is to create an instance of the Sequential class. After that, we create a layer and add it in order to get them connected.
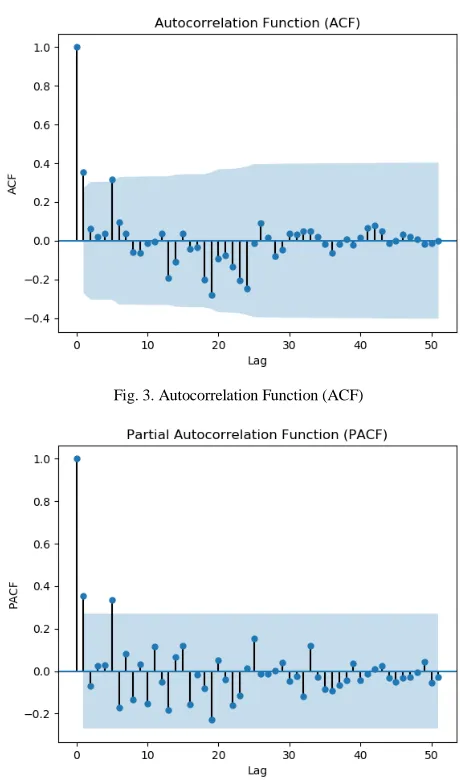
In this study, we used 1 batch size. A batch size of 1 is selected because we use walk-forward validation to perform one-step forecasts [12]. To update the network weight we have used Adam optimizer [25]. To determine the input for LSTM method, we look for significant lag on the dataset using Autocorrelation Function (ACF) and Partial Autocorrelation Function (PACF) plots.
In Figure 3 and Figure 4 shows that the most significant lag of the dataset are lag 1 and lag 5. According to Abolfazli [26], the selection of lag at the beginning of the ACF and PACF plots is preferable. Therefore lag 1 is used as input from the LSTM method. So to forecast at time t then selected input t-1.
E. Forecasting
The LSTM method is used to predict the next 10 weeks. In this research, forecasting experiments on LSTM method with 50 epoch, 100 epoch, and 500 epoch are used. Moreover, each epoch has neurons of 1, 2, 3, and 4. The forecast results can be seen in TABLE I
TABLEI THE FORECASTING RESULT
Epoch Neuron RMSE Processing Time (sec)
50 1 14.712 102.9
50 2 13.833 118.1
50 3 14.253 137.4
50 4 13.916 148.1
100 1 13.249 184.8
100 2 13.659 206.8
100 3 14.027 237.8
100 4 14.657 276.7
500 1 12.733 768.2
500 2 13.698 852.6
500 3 14.253 1020.5
500 4 15.924 1296.1
From the results of Table 1, it is known that the best forecast result is LSTM model with 500 epoch and 1 neuron with the smallest Root Mean Square Error (RMSE) value is 12.733. From these results can be analyzed that to forecast the existing dataset, the use of LSTM model with a larger epoch and the smaller number of neurons will produce a higher level of accuracy. However, if the larger epoch is used, it will take a longer processing time. Details forecast for the next 10 weeks with the best model LSTM can be seen in Table 2 and Figure 5.
TABLE II
THE FORECASTING RESULT (500EPOCH,1NEURON)
Week Predicted Values Expected Values
43 34.800179 51
44 38.872318 49
45 38.351711 24
46 31.065206 30
47 32.771734 51
48 38.865125 48
49 38.034233 31
50 33.092514 10
51 26.988665 21
52 30.159448 34
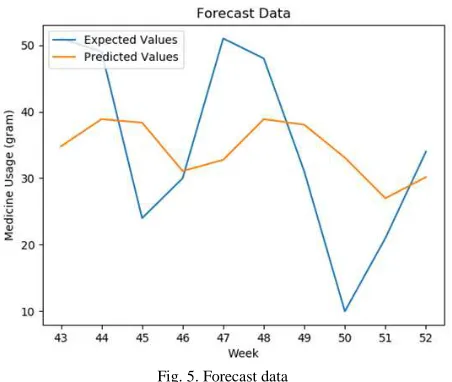
Fig. 5. Forecast data
Figure 5 is a graphical representation of data forecasting from week 43 to 52. The blue line represents the actual value of the data. The orange line represents the predicted value. From the graph it can be seen that the prediction value has a pattern that is almost similar to the actual value of the data. So it can be concluded that the results of the forecasting process quite successful.
IV.CONCLUSIONS
In this research, the LSTM method has been applied to predict the amount of medicine use that contains digestive enzymes (Enzyplex) at the hospital based on weekly data. The result shows that the LSTM method is suitable for forecasting on time series historical data. The results show the smallest RMSE value is 12.733 on the LSTM model with 500 epoch and 1 neuron.
Predictions of medicine use can be useful for stakeholders in hospitals or other health institutions to make decisions about managing medicine resources. For future research, it is still needed to compare to another LSTM model with the different number of epoch and neurons and then evaluate the result. Due to the LSTM method, the larger the epoch used will take longer for processing time. So, it can be compared with other forecasting methods that can forecast with faster processing time such as Gated Recurrent Unit (GRU) method.
ACKNOWLEDGMENT
The authors would like to acknowledge funding from DIKTI through the PDUPT program in 2018, Universitas Gadjah Mada.
REFERENCES
[1] M. Jalalpour, Y. Gel, and S. Levin, “Forecasting demand for health services : Development of a publicly available toolbox,” Oper. Res. Heal. Care, vol. 5, pp. 1–9, 2015.
[2] C. Qingkui and R. Junhu, “Study on the Demand Forecasting of Hospital Stocks Based on Data Mining and BP Neural Networks,” in International Conference on Electronic Commerce and Business Intelligence Study, 2009, pp. 284–289.
[3] Á. Lublóy, “Factors affecting the uptake of new medicines : a systematic literature review,” BMC Health Serv. Res., pp. 1–25, 2014.
http://www.who.int/medicines/areas/access/supply/en/index2.html. [Accessed: 10-Aug-2016].
[5] Robinson, John W. "Regression tree boosting to adjust health care cost predictions for diagnostic mix." Health services research 43.2 (2008): 755-772.
[6] Zhao, Y., A. S. Ash, R. P. Ellis, J. Z. Ayanian, G. C. Pope, B. Bowen, L. Weyuker. 2005. Predicting pharmacy costs and other medical costs using diagnoses and drug claims. Med. Care 43 34–43. [7] Bertsimas, Dimitris, et al. "Algorithmic prediction of healthcare
costs." Operations Research 56.6 (2008): 1382-1392.
[8] Gamboa, John Cristian Borges. "Deep Learning for TimeSeries Analysis." arXiv preprint arXiv:1701.01887 (2017).
[9] Tesauro, Gerald. "Practical issues in temporal difference learning." Advances in neural information processing systems. 1992.
[10] R. Ghousi, S. Mehrani, and M. Momeni, “Application of Data Mining Techniques in Drug Consumption Forecasting to Help Pharmaceutical Industry Production Planning,” in International Conference on Industrial Engineering and Operations Management, 2012, pp. 1162– 1167.
[11] F. A. Gers, J. Schmidhuber, and F. Cummins, “Learning to forget: Continual prediction with lstm,” Neural computation, vol. 12, no. 10, pp. 2451–2471, 2000.
[12] S. Kaushik, A. Choudhury, N. Dasgupta, S. Natarajan, L. A. Pickett, and V. Dutt, “Using LSTMs for Predicting Patient’s Expenditure on Medications”, in International Conference on Machine Learning and Data Science, 2017, pp. 120-127.
[13] L. B. Godfrey, M. S. Gashler, “Neural Decomposition of Time-Series Data”, in IEEE International Conference on Systems, Man, and Cybernetics (SMC), 2017, pp. 2796-2801.
[14] I. N. Soyiri and D. D. Reidpath, “An overview of health forecasting,” Environ. Health Prev. Med., vol. 18, pp. 1–9, 2013.
[15] S. Makridakis, S. C. Wheelwright, and V. E. McGee, Forecasting: Methods and Applications, 2nd ed. John Wiley & Sons Inc, 1983.
[16] J. G. De Gooijer and R. J. Hyndman, “25 years of time series forecasting,” Int. J. Forecast., vol. 22, no. 44, pp. 443–473, 2006. [17] S. Hochreiter and J. Schmidhuber, “Long short-term memory,”
Neural computation, vol. 9, no. 8, pp. 1735–1780, 1997.
[18] J. Zheng, C. Xu, Z. Zhang and X. Li, "Electric load forecasting in smart grids using Long-Short-Term-Memory based Recurrent Neural Network," 51st Annual Conference on Information Sciences and Systems (CISS), Baltimore, MD, pp 1-6, 2017.
[19] J. Vermaak, E. C. Botha, “Recurrent Neural Networks for Short-Term Load Forecasting”, IEEE Transactions on Power Systems, vol. 13, no. 1, pp. 126-132, February 1998.
[20] “Enzyplex Product Details” [Online]. Available: https://www.unilab.com.ph/products/enzyplex. [Accessed 18-Mar-2018].
[21] R. J. Hyndman and G. Athanasopoulos, “Stationarity and differencing.” [Online]. Available: https://www.otexts.org/fpp/8/1. [Accessed: 23-Mar-2018].
[22] “P Values (Calculated Probability) and Hypothesis Testing – StatsDirect” [Online]. Available: https://www.statsdirect.com/ help/basics/p_values.htm. [Accessed 18-Mar-2018].
[23] “Complete guide to create a Time Series Forecast (with Codes in Python)” [Online]. Available: https://www.analyticsvidhya.com/ blog/2016/02/time-series-forecasting-codes-python. [Accessed 18-Mar-2018].
[24] “Time Series Forecasting with the Long Short-Term Memory Network in Python - Machine Learning Mastery” [Online]. Available: https://machinelearningmastery.com/time-series-forecasting-long-short-term-memory-network-python. [Accessed 18-Mar-2018]. [25] Kingma, Diederik, and Jimmy Ba. "Adam: A method for stochastic
optimization." arXiv preprint arXiv:1412.6980 (2014).