ISSN 0975-928X
Research Note
Evaluation of quantitative traits of tossa jute (
Corchorus olitorius
l.) based
on principal component analysis
Ashutosh Sawarkar, Sonika Yumnam, S.G. Patil1 and S. Mukherjee
Department of Genetics and Plant breeding, Bidhan Chandra Krishi Viswavidyalaya, Mohanpur, Nadia, West Bengal-741252,
1
Agricultural College and Research Institute, Tamil Nadu Agricultural University, Killikulam-628252, Tamil Nadu
Email: [email protected]
(Received: 30 Sep 2014; Accepted:12 Feb 2015 )
Abstract
Thirty accessions of tossa jute (Corchorus olitorius L.) were evaluated on the basis of principal component analysis to assess the contribution of quantitative traits in genetic variability. The principal component analysis showed that first four principal components explained 99.19% of the total variation. The contribution of plant height, bark thickness, base diameter, green weight and stick weight in the PC leads to the conclusion that these traits contribute more to the total variation observed in the thirty accessions of C. olitorius would make good parental stock material. The genotypes OEX 29, OIN 990, OIN 791, OIN 937 and OIN 533 were the most dispersed and diverse of all the accessions considered. High level of variability existing within the accessions and the characters will make room for further improvement of the cultivars in breeding programs.
Keywords
C. Olitorius, germplasm, principal component analysis, cluster analysis.
Jute (Corchorus spp.) is a natural fiber crop and is second in the world after cotton in terms of global production, consumption and availability. In India, West Bengal occupies foremost place both in respect of area (73.5%) and production (82.26%) of jute. The two species (Corchorus capsularis L. and
Corchorus olitorius L.) are widely cultivated for
natural fiber in areas distributed throughout the tropical and sub-tropical regions of the world, particularly in Asia, Africa and Latin America (Hossain et al., 2002). In recent years, jute has been used for making pulp and papers in the paper industry (Mohiuddin et al., 2005). The two cultivated species of jute are different in terms of growth habitat, disease and pest resistance and characteristics related to fibre and seed yield (Kundu1951, Edmonds, 1990). For example, C.
olitorius is relatively tolerant to diseases and pests
and produces a stronger fiber than C. capsularis, whereas C. capsularis is more resistant to water logging and drought (Roy et al., 2006). Combining the desirable traits of the two species would be advantageous; however, these species cannot be crossbred, possibly because of the presence of a strong sexual incompatibility barrier between them (Patel et al., 1960). Moreover, advanced technologies such as somatic hybridization, chromosome doubling, embryo rescue and genetic transformation could be used to overcome the sexual incompatibility problems (Saha et al., 2001, Ghosh et al., 2002). If jute is to be genetically improved, the divergent genotypes must first be identified, the genetic variability characterized and the degree and nature of the associations of various traits with yield determined. Adequate analysis of
germplasm diversity is essential for proper understanding and utilization of genetic variability among accessions and their characters.
Multivariate methods such as principal component analysis (PCA) have proven to be useful for evaluating and classifying germplasm when a large number of accessions are assessed for several characteristics of agronomic importance (Badenes
et al., 2000). Therefore, the present study was
planned with the objective to evaluate(C. olitorius) tossa jute into most discriminating yield attributing traits and to identify the most divergent genotypes in terms of genetic variability for use in efficient breeding programs using principle component analyses based on seven yield attributing traits. Thirty accessions of tossa jute (Corchorus
olitorius L.) were collected from AINP jute and
allied fibres, Kalyani centre, BCKV through Central Research Institute for Jute and Allied Fibres, (CRIJAF) Barrackpore. The accessions include 18 indigenous, 8 accessions of International Jute Organisation (IJO) and 4 exotic accession shown in Table 1. The genotypes were sown in randomized block design with three replications having plot size of 3 m × 1.5 m for each genotype, at the Instructional Farm, Bidhan Chandra Krishi Viswavidyalaya, Jaguli, Nadia during pre-kharif
ISSN 0975-928X
weight (g/plant), stick weight (g/plant) and fibre weight (g/plant) were recorded from ten plants randomly selected from each genotype from each replication and was used for statistical analysis. The data were analyzed using R 3.0.3. The PC was used to determine the extent of genetic variation. Eigen-values were obtained from PC, which were used to determine the relative discriminative power of the axes and their associated characters. Ward method was used to group the accessions based on their genetic relationship.
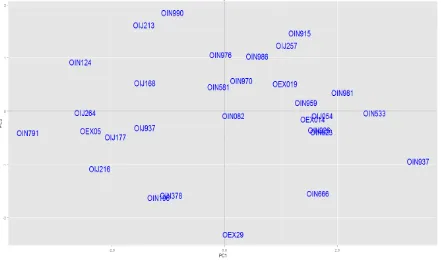
The relative discriminating capacity of the principal components (PC) is shown by their Eigen-values. Results from the PC presented in Table 2, indicates that only two of the seven PC had Eigen values greater than 1.0 and together accounted for over 85% of the total variability. The PC 1 had the highest discriminating power as revealed by its highest Eigen -value of 4.97 followed by PC 2 with Eigen value of 1.02. The first PC accounted for 71.02% of the total variation with an exception of days to 50% flowering (0.082) all the characters are contributed negatively. While the second PC 2 accounted for 14.70% of the total variation. Characters that are contributed to the variation include green weight (0.044), fibre weight (0.01), stick weight (0.007) and plant height (0.002). The third PC for 12.11% of the total variation in the population. Days to 50% flowering contributed the highest (0.54) followed by plant height (0.11) green weight (0.08) and fibre weight (0.07). Bark thickness (0.86) contributed more to the variation and remaining characters were negatively contributed in PC 4. The fifth PC accounted for 0.52% of the total variation with green weight (0.74) given the highest contribution. The plot of PC 1 and PC 2 is shown in Figure 1 shows the relationship among the observation per genotype. Result shows the accessions OEX 29, OIN 990, OIN 791, OIN 937 and OIN 533 were the most dispersed and diverse of all the accessions considered in this study. OIN 990 OIJ 213, OIN 915 and OIJ 257 are mostly described by the characters like days to 50% flowering, plant height, green weight, stick weight and fibre weight in PC 2, whereas characters in the PC 1 best described by OIN 937, OIN 533 OIN 981 and OIJ 054 as these genotypes loaded comparatively highest score on PC 1 than the other genotypes and also they were separately clustered (Figure 2).
The Ward's method is used for classifying the accessions into cluster (Figure 2) shows the similar results as principal component analysis was shown. The highest number of accessions was located in cluster I and II jointly with eight, cluster V had six whereas clusters III and IV each had four. Cluster V contained accessions with the highest value of
days to 50% flowering followed by II and III. Clusters IV contain the highest plant height at maturity. This was closely followed by accessions in cluster V, whereas, the lowest value was recorded in accessions found in cluster III is shown in Table 3.
Bark thickness was found to be the highest in accessions located in cluster IV and the lowest in accessions presented in cluster III. Meanwhile, base diameter was highest in accessions found in cluster V and lowest in accessions found in cluster II. The highest stick weight was recorded in accessions found in cluster IV, followed by V and lowest in III. The fibre weight, green weight were highest in accessions found in cluster IV followed by V, but lowest in accessions found in Cluster III. Accessions in cluster IV with high potential for maximum plant height, bark thickness, base diameter, green weight, stick weight and fibre weight would make good parental stock material and it would successfully be utilized in hybridization programme for getting promising elite lines and to create further variability in these characters.
The PC scree plot is shown Figure 3 clearly showed the highest variation in PC 1 followed by PC 2 and four components enough to explain maximum variation in the data set.
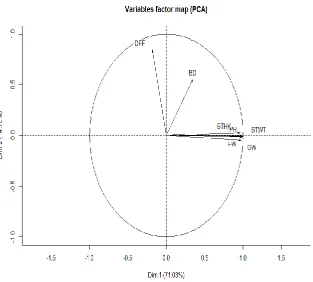
Thus, from the above investigation concluded that the relatively more variations was evident in fibre weight, stick weight, plant height, green weight, and bark thickness as loaded more on the first component among thirty accessions of C.olitorius, showed in Figure 4. Hence these characters can be used in discriminating among the accessions of C.
olitorius. Similar result also reported by
Olanrewaju et al. (2012). This suggests that any selection from any cluster group for higher yield must take into consideration these traits. This agreed with the report of Islam et al. (2002) in their report on C. olitorius. Furthermore, the PC 1 and PC 2 showed the degree of variation that exists within the components. High level of variability existing within the accessions and the characters will make room for further improvement of the cultivars in breeding programs.
Acknowledgement
Authors are thankful to CRIJAF, Barrackpore for providing the germplasm for study.
References
ISSN 0975-928X
Edmonds, J. M., 1990. Herbarium survey of African Corchorus species. Systematic and Ecogeographic Studies on Crop Genepools 4. International Board for Plant Genetic Resources, Rome.
Ghosh, M., Saha, T., Nayak, P., Sen. S. K., 2002. Genetic transformation by particle bombardment of cultivated jute, Corchorus capsularis L. Plant Cell Rep., 20: 936-942. Hossain, M.B., Haque, S., Khan, H., 2002. DNA
Fingerprinting of jute germplasm by RAPD. J. Biochem Mol Biol., 35: 414-419.
Islam, M. R., Islam, M. M., Akter, N., Ghosh, R.K., Al Rafique., Z. A Shahadat Hossain A.K.M., 2002. Genetic variability and performance of tossa jute (Corchorus olitorius L.) Pakistan J Biol Sci., 5(7): 744-745.
Kundu, B. C., 1951. Origin of jute. Ind. J. Genet., 11: 95-99.
Mohiuddin, G., Rashid, M., Rahman, M., Hasib, S. A., Razzaque, A., 2005. Biopulping of whole jute plant in soda-anthraqunion and kraft processes.
TAPPI J., 4: 23-27.
Olanrewaju, A., Denton., Cyril, C., Nwangburuka., 2012. Morphological diversity among
corchorus olitorius accessions based on single linkage cluster analysis and principal
component analysis. Jordan J. Biol.Sci., 5: 191-196.
Patel, G.I., and Datta, R.M., 1960. Interspecific hybridizationbetween Corchorus olitorius and
C. capsularis and the cytogenetical basis of incompatibility between them. Euphytica., 9: 89-110.
Roy, A., Bandyopadhyay, A., Mahaptra, A. K., Ghosh, S. K., Singh, N. K., Bansal, K. C., Koundal, K.R., Mohapatra, T., 2006. Evaluation of genetic diversity in jute (Corchorous species.) using STMS, ISSR and RAPD markers. Plant Breed., 125: 292-297.
Saha, T., Majumdar, S., Banerjee, N. S., Sen, S. K., 2001. Development of interspecific somatic hybrid cell lines in cultivated jute and their early characterization using jute chloroplast RFLP marker. Plant Breed., 120: 439-444.
Table 1. List of germplasm
Acc.N o.
Acc.Na me
Status Acc.No
.
Acc.Na me
Status Acc.No
.
Acc.Na me
Status
1 OIJ 213 (Intl.Jute org.) 11 OIJ 216 (Intl.Jute org) 21 OEX 019 (Exotic) 2 OIN 959 (Indigenous) 12 OIN 196 (Indigenous) 22 OIN 791 (Indigenous) 3 OIN 990 (Indigenous) 13 OIN 623 (Indigenous) 23 OIN 666 (Indigenous) 4 OIN 986 (Indigenous) 14 OIJ 937 (Intl.Jute org) 24 OIJ 177 (Intl.Jute org.) 5 OIJ 054 (Intl.Jute org) 15 OIN 533 (Indigenous) 25 OIN 926 (Indigenous) 6 OIN 124 (Indigenous) 16 OEX 014 (Exotic) 26 OEX 29 (Exotic) 7 OEX 05 (Exotic) 17 OIN 937 (Indigenous) 27 OIN 970 (Indigenous) 8 OIN 981 (Indigenous) 18 OIJ 264 (Intl.Jute org) 28 OIN 581 (Indigenous) 9 OIN 976 (Indigenous) 19 OIN 915) (Indigenous 29 OIJ 257 (Intl.Jute org.) 10 OIN 082 (Indigenous) 20 OIJ 168 (Intl.Jute org) 30 OIN 378 (Indigenous)
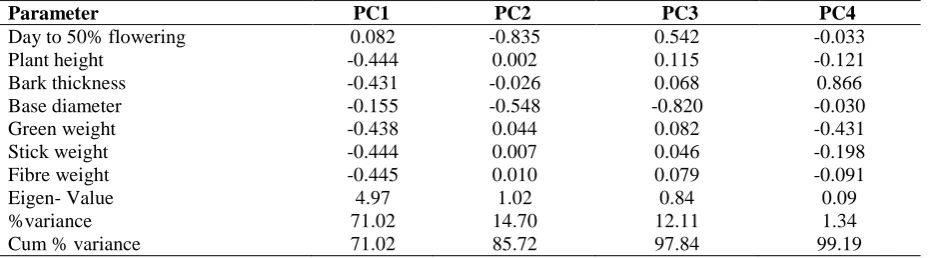
Table 2. Eigen value, factor scores and contribution of the first four principal component axes to variation in C.
olitorius germplasm
Parameter PC1 PC2 PC3 PC4
Day to 50% flowering 0.082 -0.835 0.542 -0.033
Plant height -0.444 0.002 0.115 -0.121
Bark thickness -0.431 -0.026 0.068 0.866
Base diameter -0.155 -0.548 -0.820 -0.030
Green weight -0.438 0.044 0.082 -0.431
Stick weight -0.444 0.007 0.046 -0.198
Fibre weight -0.445 0.010 0.079 -0.091
Eigen- Value 4.97 1.02 0.84 0.09
%variance 71.02 14.70 12.11 1.34
ISSN 0975-928X
Table 3. Group mean, standard deviation (sd) in parenthesis of five clusters with seven major characteristics patterns of 30 Corchorus olitorius accession
Fig 1. Configuration of Corchorus genotypes under PC 1and PC2
Fig 2 Dendrogram from Corchorus olitorius accessions
Character I II III IV V
Accession 1,3,4,9,10, 20,27,28
2,13,16,19,21, 23,25,29
ISSN 0975-928X
Fig 3. PCA scree plot against variance.
DFF= Days to 50% flowering, PH= Plant height, BTHK=Bark thickness, BD=Basal diameter, STWT= stick weight, FW= Fibre weight.