Accessible maps for the color vision deficient observers: past
and present knowledge and future possibilities
Anne Kristin Kvitle
a,ba The Norwegian Colour and Visual Computing Laboratory, Department of Computer Science, NTNU, [email protected] b The Norwegian Research Laboratory for Universal Design, Department of Manufacturing and Civil Engineering, NTNU
Abstract: Color is part of the visual variables in map, serving an aesthetic part and as a guide of attention. Impaired color vision affects the ability to distinguish colors, which makes the task of decoding the map colors difficult. Map reading is reported as a challenging task for these observers, especially when the size of stimuli is small. The aim of this study is to review existing methods for map design for color vision deficient users. A systematic review of research literature and case studies of map design for CVD observers has been conducted in order to give an overview of current knowledge and future research challenges. In addition, relevant research on simulations of CVD and color image enhancement for these observers from other fields of industry is included. The study identified two main approaches: pre-processing by using accessible colors and post-processing by using enhancement methods. Some of the methods may be applied for maps, but requires tailoring of test images according to map types.
Keywords: Cartography, accessible maps, color vision deficiency
1. Introduction
Being one of the visual variables proposed by Jacques Bertin (Bertin 1983), color is considered a key element in cartography. Further, color is considered to be an undoubted attribute to guide attention, helping the map reader extract features. However, people with color vision deficiencies (CVD) experience difficulties to recognize, extract and interpret objects when colors are used to code information. Map reading are among the tasks reported to be difficult for these observers. This paper gives an overview of existing methods, not only from the map industry but also from imaging industry, proposing methods that should be further investigated to be used in maps.
Innovations in technology may ironically enough make daily life of CVD observers harder than ever before as the advent of inexpensive color printing and the universal adoption of color computer monitors enable color to be more widely used for coding information and organizing complex visual displays. (Cole 2004). Observers with a CVD now encounter colored stimuli much more often than in the past.
The aim of this study is to review and evaluate existing methods for map design for CVD observers and, furthermore, unveil challenges that are yet to be conquered. A systematic review of literature and case studies of map design was conducted in order to give an overview of current knowledge and future research challenges.
The paper is organized as follows, first a background section is given covering topics concerning color, color vision deficiencies and how this relates to cartography and
map reading. Next, a section describing related work and methods to enhance accessibility of color coded images for CVD observers, followed by a discussion of existing knowledge and proposed work based on these findings.
2. Background and related work
This paper was prepared by performing a primary search in the online public access catalog ORIA ("ORIA") for scientific databases and Google Scholar for articles using the terms “colo(u)r vision deficiency” and “colo(u)r blindness”, combined with the terms “cartography” and “maps”. The search was further expanded using the “related articles” function. In addition, the proceedings and books from the International Cartography Conference were reviewed. Secondary sources were found from the references in the articles identified in the primary search. In addition, the authors’ personal archive of references was used, especially for the parts concerning simulations and daltonization methods.
This section provides a general summary of some of the basic concepts required to understand the methods discussed in the following sections. This include an overview of color used as a visual element, color vision and color vision deficiencies and how this affect the ability to read maps.
2.1 Color as a guide to attention and object recognition
message. Color is particularly applicable to graphic messages of a pedagogic nature”.
In a visual search task, the observer will look for a target among distracting elements. Different attributes are grouped into five groups (from “undoubted attributes” to “probable non—attributes”) according to the likelihood of being a guidance of attention (Wolfe and Horowitz 2004). Color is listed as one of the “Undoubted attributes” among motion, orientation and size.
The ability of discrimination or recognition of color is essential in tasks where color is an attribute of information. Color tasks can be classified (Cole 2004) into the following categories:
Comparative tasks (matching or differentiating colors).
Connotative tasks (decoding color information as signal lights, ripeness of fruit).
Denotative tasks (where color is used to mark out elements or to organize complex visual displays). Aesthetic (where color is used to create an
emotional response or convey a mood).
In maps, graphs and other information graphics, color is used both connotatively and denotatively.
2.2 Color vision and color vision deficiencies
Human color vision is referred to as trichromacy, i.e. the ability to perceive colors through three types of cones (L, M and S cone) responding to different wavelengths of the visible spectrum. Several factors affect our ability to perceive, recognize and distinguish colors. Color vision deficiencies include so-called situational-induced CVD (according to viewing conditions) and acquired CVD (due to injuries, age, medication etc.), which both are out of the scope of this paper. Inherited CVD is a condition caused by a lack of cones (protanopia, deuteranopia and tritanopia, depending of which of the cones are absent) or dysfunctional cones (protanomaly, deuteranomaly and tritanomaly).
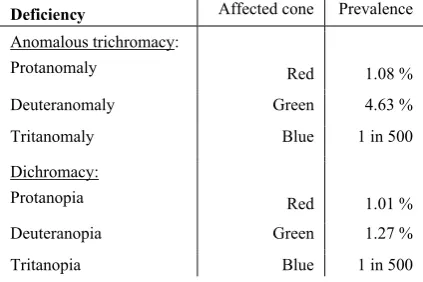
About 8 % of men and 0.4 % of women are affected by this condition. If a person is missing a cone, this is called dichromacy, and a dysfunction in general is titled anomalous trichromacy. Categories of CVD and prevalence are illustrated in Table 1.
Deficiency Affected cone Prevalence
Anomalous trichromacy:
Protanomaly Red 1.08 %
Deuteranomaly Green 4.63 %
Tritanomaly Blue 1 in 500
Dichromacy:
Protanopia Red 1.01 %
Deuteranopia Green 1.27 %
Tritanopia Blue 1 in 500
Table 1. Types of CVD and prevalence (Simunovic 2010)
The condition does not make the person “colorblind”, but the ability to recognize and discriminate colors is limited. As a person with normal color vision will perceive red and green as two different colors, a person with CVD may perceive red and green as similar or as a variation of the same color. People with CVD experience difficulties to see the difference between colors on the red - green axis (protan and deutan) or the blue - yellow axis (tritan). This is illustrated in Figure 1 by the so-called confusion lines, where the colors along these lines may be perceived as similar.
Fig. 1. Confusion lines for protanopes, deuteranopes and tritanopes in the CIEXYZ chromaticity diagram (Source: by courtesy of Daniel Flück, www.color-blindness.com)
2.3 Color as a cartographic element
The fact that color is used both aesthetically and as a conveyor of information in map design is well documented in literature (Bertin 1983; Brewer 2005; Krygier and Wood 2011; Slocum et al. 2009).
Color is one of the most difficult cartographic elements to use, as it easily draws attention away from the data and goals for the map when it is used poorly (Krygier and Wood 2011). It is also the one cartographic element that is most frequent misused. Some conventions are choosing colors that have a similarity to real life objects, like green and blue to represent land and water. Other conventions are to use strong colors to emphasize important objects, like the use of red to represent highways or cities. One major contribution to the art of cartography is the development of the visual variables proposed by Jacques Bertin (Bertin 1983). These graphic elements (i.e. position, size, color, orientation, shape, value, texture) were designed to utilize graphic information representation, and have been adopted as a language of cartography.
2.4 The challenge of map reading for color deficient observers
In cases where color is an attribute of the target object, or is used to organize the visual display, investigations show that CVD observers are slower and make more errors in a search task. Map reading is reported as challenging, and up to 60 % of the users with abnormal color vision reported problems in reading color coded charts, slides and prints (Cole 2004). This is supported by other studies (Carter and Silverstein 2010) reporting difficulties discriminating colors on weather, financial and other maps and charts, especially when the size of the objects is small. An experiment evaluating map colors in existing map products (Kvitle et al. 2016), revealed that the CVD observers made more errors in a color matching task as the size of the stimuli was reduced.
A review of visual usability for mapping products in Australia (Cartwright 2015) concludes that none of the maps in the review appeared to have been designed with CVD users in mind. To make the maps more accessible for these observers, alternative color schemes or monochrome maps should be provided. An evaluation of the OpenStreetMap Street Color Scheme using simulations of CVD (Kröger et al. 2013) reveals that the simulated street colors might give a false impression of a hierarchy based on the colors.
3. Accessible design for color vision deficient observers
The literature review described previously, identified two main approaches in accessible map design for CVD observers:
1) Selecting colors or color palettes that are distinguishable (pre-processing or pre-enhancement). 2) Post-processing or post-enhancement of existing
maps.
Pre-processing of maps include methods for simulation of CVD, but also involvement of CVD observers in order to select appropriate colors. Post-processing includes so-called daltonization methods for automatic enhancement of images for CVD observers. These methods are described in the following sub-sections.
3.1 Pre-processing methods
In order to identify challenging color combinations, simulations of CVD are often used as a guide for the designer or cartographer. Such simulations are made to give the designer with normal color vision an impression of how colors will appear for a CVD observer, as well as the opportunity to choose suitable colors. As the ability to perceive colors varies among type (protan, deutan and tritan) and severity (dichromat or anomalous trichromat), simulations are designed especially for each type.
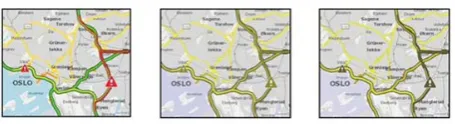
Simulations methods can be implemented as web based tools, like the COBLIS and Vischeck ("COBLIS" 2015; Vischeck) or built-in software (i.e. profiles in Photoshop etc.). The simulation methods proposed by Brettel et al. (Brettel et al. 1997; Mollon et al. 1999) form the basis for several of these tools. An example of such simulation is
illustrated in Figure 2, using simulations on a traffic information map service consisting of a static basemap and dynamic overlay. The simulations are created in Photoshop by profiles developed by the International Color Consortium (ICC) to simulate different types of CVD (Green and Nussbaum 2016; ICC 2010).
Fig. 2. Traffic flow illustrated by original (left), protanopian (middle) and deuteranopian simulation (right)
In the cartographic industry, simulations were included in the development of the color schemes for choropleth maps in ColorBrewer (Brewer 2003; Harrower and Brewer 2003). These color schemes, proposed for sequential, diverging and qualitative data, are later evaluated by CVD observers (Gardner 2005). Not only are the color schemes suitable for CVD observers, they also increase readability for normal observers. Another example of using simulations in map making are the ColorOracle (Jenny and Kelso 2007), a software based on confusion lines to simulate colors on computer display. In addition to give guidance to avoid confusing color combinations, the authors suggest the following rules to gain more accessible maps for the CVD observers:
1) Choose unambiguous color combinations 2) Use alternative visual variables
3) Directly annotating features
For instance, for point features, a combination of color and shape is suggested. For line features, color should be combined with line patterns and annotation.
on the theoretical limitations of the color vision, and do not take into account the individual differences between observers (Flatla and Gutwin 2010, 2012). Since the development of the first simulations in 1997, several new methods are developed. An evaluation of the most common methods, compared to target group (type of CVD) and application (type of images) were recently conducted (Simon-Liedtke and Farup 2016b).
3.2 Post-processing methods
Daltonization methods are automatic methods to enhance information in existing images to be recognized and distinguishable for CVD observers. These methods are named after the man who is acknowledged as the author of the very first scientific article on color vision deficiencies, John Dalton (Dalton 1798). Daltonization methods are categorized according to the enhancement method, including re-coloring, edge-enhancement, and pattern-superposition. As with the simulations methods, daltonization methods are designed and classified according to the characteristics of the observer and the image content. A proposed classification (Milić et al. 2015) includes content, processing area, target group, processing control and enhancement type.
Re-coloring methods change the colors in the original image to make the colors more distinguishable, and are categorized as
User assisted (taking user parameters as input). Palette based (taking pre-defined color palette as
input).
Projection based (projecting colors from original).
Optimization based (based on original image). Edge-enhancement methods increases the edge (or border) between adjacent areas with confusion colors, while the pattern-superposition methods adds additional information on top of the image.
A recent contribution on re-coloring maps, are the Orange-Grey-Azure (OGA) algorithm (Culp 2012). Based on existing colors in the image, the algorithm rotates the hue angle of the red and blue regions, and convert green to gray. The method is evaluated on choropleth maps by both normal and CVD observers.
Other contributions to the idea of re-coloring the map in the light of personalized maps-on-demand (Buard and Ruas 2009), as well as the COLorLEGend project (Christophe 2011). These projects relate to the idea of making personalized and original color choices in accordance with the intended interpretation of the map. Even though these projects were not aimed at CVD observers, results and methods from should be further investigated. Proposed color palettes for CVD or universal designed color schemes may be used as input for palette-based enhancement methods.
Several daltonizations methods exists, where many of them are designed for specific image types (natural images, scientific images, information graphics etc), and therefore tested on a limited series of test images. Even though such methods have existed for a while, a process
for evaluating them and a comparison of the different methods were not established until recently (Simon-Liedtke and Farup 2016a). Here, an evaluation based on different test images and proposed target images types is given. This research also revealed a need for guidelines for designing and evaluating such algorithms, and a proposed checklist (Simon-Liedtke et al. 2017) include requirements concerning preservation of color identification, customization for different types and severities of CVD, target image types and the emphasis on evaluating methods on real CVD observers.
4. Discussion
Review of existing research on accessible map design for CVD observers revealed that even though map reading is reported challenging for these observers, most maps are designed without regarding CVD. The efforts on designing with accessible colors are mostly limited to thematic maps such as choropleth maps. Combining color with other visual variables and the use of annotations are suggested in order to increase readability for the CVD, but still needs to be tested and verified by CVD observers. Simulations methods give the designer or cartographer an aid to avoid difficult color combinations. Simulations methods are often too general, as the color vision of the observers varies. Also, not all simulation methods are suitable for all applications. Maps and other information graphics may have special attributes, and different types of maps (general reference maps, thematic maps, topographical maps, navigation charts etc) may require different simulation methods.
Daltonization methods exist, where the OGA algorithm was developed for maps. Some of the methods are evaluated on scientific images (such as maps). However, the evaluation is limited to choropleth maps only. Proposed guidelines argue that daltonization methods must be tested on different types of images, and there are different requirements based on the target image types. Such testing of existing methods, and in case of development of new methods, demand designing test images of several map types.
Most of the contributions done for making colors accessible are developed for inherited CVD observers. Acquired CVD and situation-induced CVD are out of the scope of this paper, but should also be included research of accessible colors in map design.
5. Conclusion and future work
Some effort is done to design maps accessible for CVD observers, but most maps are still made without concern for this group of observers. Also, the small number maps that are designed for CVD observers are limited to a few maps types, like choropleth maps and similar.
Methods to increase accessibility in images for CVD observers exist, and may be applied for maps. However, it is necessary to design test map images in order to evaluate these methods. In addition, these test images needs to be targeted according to different map types.
design test images for maps for testing and evaluation of simulation and daltonization methods
examination of different map types
examination of color coding in the relation between the basemap and overlays
For future work, evaluation of results based on research of these proposed topics should include CVD observers.
6. Acknowledgements
This work is funded by the Research Council of Norway through Project No. 221073 “HyPerCept - Colour and quality in higher dimensions”.
7. References
Bertin, J. (1983). Semiology of graphics: University of Wisconsin Press.
Brettel, H., Viénot, F., & Mollon, J. D. (1997). Computerized simulation of colour apperance for dichromats. J.Opt. Soc Am A, 14, 2647-2655.
Brewer. (2003). A transition in improving maps: the ColorBrewer example. Cartography and Geographic Information Science(30).
Brewer. (2005). Designing better maps: a guide for GIS users. Redlands, Calif.: ESRI Press.
Brychtová, A., & Çöltekin, A. (2016). The effect of spatial distance on the discriminability of colors in maps. Cartography and Geographic Information Science, 1-17. Buard, E., & Ruas, A. (2009). Process for improving the
colours of topographic maps in the context of map-on-demand. Paper presented at the 24th ICA Conference, Santiage de Chile.
Carter, R. C., & Silverstein, L. D. (2010). Size matters: Improved color-difference estimation for small visual targets. Journal of the Society for Information Display, 18(1), 17-28. doi:10.1889/JSID18.1.17
Cartwright, W. (2015). Assessing Cartographic Products for Visual Usability. In J. Brus, A. Vondrakova, & V. Vozenilek (Eds.), Modern Trends in Cartography: Selected Papers of CARTOCON 2014 (pp. 269-279). Cham: Springer International Publishing.
Christophe, S. (2011). Creative Colours Specification Based on Knowlegde (COLorLEGend system). The Cartographic Journal, 48(2), 138-145. doi:http://dx.doi.org/10.1179/1743277411Y.000000001 2
COBLIS. (2015). Retrieved from http://www.color-blindness.com/coblis-color-blindness-simulator/ Cole, B. L. (2004). The handicap of abnormal colour
vision. Clinical and Experimental Optometry, 87(4-5), 258-275.
Culp, G. M. (2012). Increasing Accessibility for Map Readers with Acquired and Inherited Colour Vision Deficiencies: A Re-Colouring Algorithm for Maps. The Cartographic Journal, 49(4), 302-311. doi:10.1179/1743277412Y.0000000030
Dalton, J. (1798). Extraordinary Facts Relating to the Vision of Colours. Memoirs of the Manchester Literary and Philosophical Society, 5, 28-45.
Flatla, D. R., & Gutwin, C. (2010). Individual models of color differentiation to improve interpretability of information visualization. Paper presented at the Proceedings of the SIGCHI Conference on Human Factors in Computing Systems, Atlanta, Georgia, USA. Flatla, D. R., & Gutwin, C. (2012). "So that's what you see": building understanding with personalized simulations of colour vision deficiency. Paper presented at the Proceedings of the 14th international ACM SIGACCESS conference on Computers and accessibility, Boulder, Colorado, USA.
Gardner, S. D. (2005). Evaluation of the Colorbrewer Color Schemes for accommodation of map readers with impaired color vision. (Master thesis), The Pennsylvania State University.
Garlandini, S., & Fabrikant, S. I. (2009). Evaluating the effectiveness and efficiency of visual variables for geographic information visualization. Paper presented at the Proceedings of the 9th international conference on Spatial information theory, Aber Wrac'h, France. Geere, D. (2011). Ordnance Survey revamps its maps with
new colour scheme. Wired. Retrieved from
http://www.wired.co.uk/news/archive/2011-05/11/ordnance-survey-cvd-maps/viewgallery/267197 Green, P. (2015). Why simulations of colour for CVD
observers might not be what they seem. Paper presented at the Color Imaging XX: Displaying, Processing, Hardcopy, and Applications.
Green, P., & Nussbaum, P. (2016). Colour vision deficiency transforms using ICC profiles. Electronic Imaging, 2016(20), 1-5.
Harrower, M., & Brewer, C. A. (2003). ColorBrewer.org: An Online Tool for Selecting Colour Schemes for Maps. The Cartographic Journal, 40(1), 27-37.
ICC. (2010). Specification ICC.1:2010 (Profile version 4.3.0.0) Image technology colour management - Architecture, profile format, and data structure.
Itti, L., & Koch, C. (2001). Computational Modelling of Visual Attention. Nature Reviews Neuroscience, 2(194-203).
Itti, L., Koch, C., & Niebur, E. (1998). A Model of Saliency-Based Visual Attention for Rapid Scene Analysis. IEEE Transaction of Pattern Analysis and Machine Intelligence, 20(11), 1254-1259.
Jenny, B., & Kelso, N. V. (2007). Color Design for the Color Vision Impaired. Cartographic Perspectives(58), 61-67.
Krygier, J., & Wood, D. (2011). Making maps: a visual guide to map design for GIS. New York: Guilford Press. Kröger, J., Schiewe, J., & Weninger, B. (2013). Analysis
Kvitle, A. K., Pedersen, M., & Nussbaum, P. (2016). Quality of color coding in maps for color deficient observers. Electronic Imaging, 2016(20), 1-8.
Milić, N., Hoffmann, M., Tómács, T., Novaković, D., & Milosavljević, B. (2015). A Content-Dependent Naturalness-Preserving Daltonization Method for Dichromatic and Anomalous Trichromatic Color Vision Deficiencies. Journal of Imaging Science and Technology, 59(1), 10504-10501-10504-10510. Mollon, J. D., Viénot, F., & Brettel, H. (1999). Digital
video colourmaps for checking the legibility of displays by dichromats. Color: Research and applications, 24(4), 243-252.
Ordnance Survey. (2015). Ordnance Survey. Retrieved from http://www.ordnancesurvey.co.uk/ORIA. Retrieved from www.oria.no
Simon-Liedtke, & Farup, I. (2016a). Evaluating color vision deficiency daltonization methods using a behavioral visual-search method. Journal of Visual Communication and Image Representation, 35, 236-247. Simon-Liedtke, & Farup, I. (2016b). Using a Behavioral
Match-to-Sample Method to Evaluate Color Vision Deficiency Simulation Methods. Journal of Imaging Science and Technology, 60(5), 50409-50401-50409-50409.
Simon-Liedtke, Flatla, D. R., & Bakken, E. N. (2017). Checklist for Daltonization methods: Requirements and characteristics of a good recolouring method. Electronic Imaging, 2017(18), 21-27.
Simunovic, M. (2010). Colour vision deficiency. Eye, 24, 747-755.
Slocum, T. A., McMaster, R. B., Kessler, F. C., & Howard, H. H. (2009). Thematic cartography and geovisualization. Upper Saddle River, N.J.: Pearson Prentice Hall.
Steinrücken, J., & Plümer, L. (2013). Identification of optimal colours for maps from the web. The Cartographic Journal, 50(1), 19-32.
Štěrba, Z., & Bláha, J. D. (2015). The Influence of Colour on the Perception of Cartographic Visualizations. Paper presented at the AIC Tokyo.
Vischeck. Vischeck. Retrieved from
http://www.vischeck.com/