* Corresponding author. Tel.: +880 01913918621 E-mail: [email protected] (G. Kabir) © 2012 Growing Science Ltd. All rights reserved. doi: 10.5267/j.ijiec.2011.09.007
Contents lists available at GrowingScience
International Journal of Industrial Engineering Computations
homepage: www.GrowingScience.com/ijiec
Multiple criteria inventory classification using fuzzy analytic hierarchy process
Golam Kabir* and M. Ahsan Akhtar Hasin
Department of Industrial and Production Engineering, Bangladesh University of Engineering and Technology (BUET), Dhaka -1000, Bangladesh
A R T I C L E I N F O A B S T R A C T
Article history: Received 1 July 2011 Received in revised form September, 30, 2011 Accepted 30 September 2011 Available online
30 September 2011
A systematic approach to the inventory control and classification may have a significant influence on company competitiveness. In practice, all inventories cannot be controlled with equal attention. In order to efficiently control the inventory items and to determine the suitable ordering policies for them, multi-criteria inventory classification is used. In this paper, fuzzy analytic hierarchy process for multiple criteria ABC inventory classification has been proposed. Fuzzy Analytic Hierarchy process (Fuzzy AHP) is used to determine the relative weights of the attributes or criteria, and to classify inventories into different categories. To accredit the proposed model, it is implemented for the 351 raw materials of switch gear section of Energypac Engineering Limited (EEL), a large power engineering company of Bangladesh. In this approach, at first, related criteria have been selected (Unit price, last year consumption or annual demand, last use date, supplier, criticality, durability) and the weights of these criteria was determined using Fuzzy AHP. Then a score to each item was assigned for each criterion as triangular fuzzy number and the final normalized weighted score of each item using fuzzy set theory is calculate. Finally, Chang’s extent analysis was used for the comparison of fuzzy numbers and the final scores are compared with each other. Then all items were classified into three classes according to their final score.
© 2012 Growing Science Ltd. All rights reserved
Keywords:
Multicriteria inventory Classification
Fuzzy analytic hierarchy Process, Triangular fuzzy number
1. Introduction
124
relatively unimportant as a basis for a control scheme. Each category can and sometimes should be handled in a different way, with more attention being devoted to category A, less to B, and less to C (Nahmias, 2004).
Sometimes, only one criterion is not a very efficient measure for decision-making. Therefore, multiple criteria decision making methods are used (Flores & Whybark, 1986, 1987). Apart from other criteria like lead time of supply, part criticality, availability, stock out penalty costs, ordering cost, scarcity, durability, substitutability, reparability etc has been taken into consideration (Flores & Whybark, 1986, 1987; Zhou & Fan, 2007). More studies have been done on multi-criteria inventory classification in the past 20 years. So many different methods for classifying inventory and taking into consideration multiple criteria have been used and developed.
Flores and Whybark (1986, 1987) proposed the bi-criteria matrix approach, wherein annual dollar usage by a joint-criteria matrix is combined with another criterion. Flores et al. (1992) have proposed the use of joint criteria matrix for two criteria. Analytic hierarchy process (AHP) developed by Saaty (1980) has been successfully applied to multi-criteria inventory classification by Flores et al. (1992). The advantage of the AHP is that it can incorporate many criteria and ease of use on a massive accounting and measurement system, but its shortcoming is that a significant amount of subjectivity is involved in pairwise comparisons of criteria. They have used the AHP to reduce multiple criteria to a univariate and consistent measure. However, Flores et al. (1992) has taken average unit cost and annual dollar usage as two different criteria among others. The problem with this approach is that the annual dollar usage and the unit price of items are usually measured in different units.
Partovi and Burton (1993) applied the analytic hierarchy process (AHP) to inventory classification in order to include both quantitative and qualitative evaluation criteria. Braglia et al., (2004) integrated decision diagram with a set of analytic hierarchy process (AHP) models used to solve the various multi-attribute decision sub-problems at the different levels/nodes of the decision tree. Guvenir and Erel (1998) applied genetic algorithm technique to the problem of multiple criteria inventory classification. Their proposed method is called genetic algorithm for multicriteria inventory classification and it uses genetic algorithm to learn the weights of criteria. Partovi and Anandarajan (2002) proposed an artificial neural network (ANN) approach for inventory classification. Lei et al. (2005) compared principal component analysis with a hybrid model combining principal component analysis with artificial neural network and back propagation algorithm. Ramanathan (2006) proposed a weighted linear optimization model for multiple criteria ABC inventory classification, where performance score of each item obtained using a data envelopment analysis (DEA)-like model. Liu and Huang (2006) presented a modified DEA model to address ABC inventory classification.
2. Fuzzy set theory
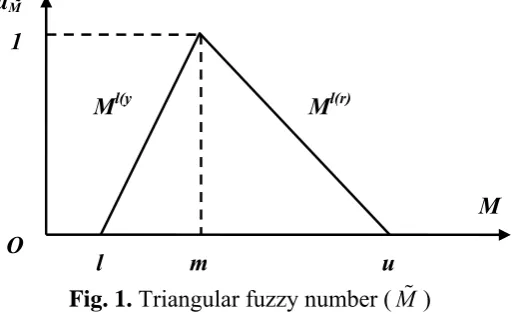
Theory of fuzzy sets is quite similar to man’s attitude when facing uncertainties to express inaccurate words, such as ‘‘approximately”, ‘‘very”, ‘‘nearly”, etc. as well as for consistency with subjective judgments of different people due to various interpretations from a subject. Zadeh (1965) came out with the fuzzy set theory to deal with vagueness and uncertainty in decision making in order to enhance precision. Thus the vague data may be represented using fuzzy numbers, which can be further subjected to mathematical operation in fuzzy domain. Thus fuzzy numbers can be represented by its membership grade ranging between 0 and 1. M is a fuzzy number if and only if M is normal and convex fuzzy set of X. A triangular fuzzy number (TFN) M is shown in Fig. 1.
Fig. 1. Triangular fuzzy number (M )
A TFN is denoted simply as (l/m, m/u) or (l, m, u), represents the smallest possible value, the most promising value and the largest possible value respectively. The TFN having linear representation on left and right side can be defined in terms of its membership function as:
u x u x m m u x u m x l l m l x l x M x , 0 ), /( ) ( ), /( ) ( 0 ) ~ / (
A fuzzy number with its corresponding left and right representation of each degree of membership is as below:
M~ = ( Ml(y), Ml(r) ) = ( l+(m-l) y, u+(m-u) y ), y ε[0,1]
where l(y) and l(r) denotes the left side representation and the right side representation of a fuzzy number respectively. If 1
~
M = (a1, b1, c1) and 2 ~
M = (a2, b2, c2) are two TFNs, then their operational laws can be expressed as follows:
1 ~
M 2
~
M = a1 + a2, b1 + b2, c1 + c2
1 ~
M Θ M~2= a1 − a2, b1 − b2, c1 − c2
1 ~
M 2
~
M = a1a2, b1b2, c1c2
λ 1
~
M = λa1, λb1, λc1 where λ > 0,λ R 1
1
~
M = (1/ c1, 1/ b1, 1/ a1)
3. Why FAHP instead of AHP?
In the conventional AHP, the pair wise comparisons for each level with respect to the goal of the best alternative selection are conducted using a nine-point scale. So, the application of Saaty's AHP has some shortcomings as follows (Saaty, 1998); (1) The AHP method is mainly used in nearly crisp decision applications, (2) The AHP method creates and deals with a very unbalanced scale of
O 1
l m u
Ml(r) Ml(y
µM
126
judgment, (3) The AHP method does not take into account the uncertainty associated with the mapping of one's judgment to a number, (4) Ranking of the AHP method is rather imprecise, (5) The subjective judgment, selection and preference of decision-makers have great influence on the AHP results. In addition, a decision maker's requirements on evaluating alternatives always contain ambiguity and multiplicity of meaning. Furthermore, it is also recognized that human assessment on qualitative attributes is always subjective and thus imprecise. Therefore, conventional AHP seems inadequate to capture decision maker's requirements explicitly (Kabir & Hasin, 2011). In order to model this kind of uncertainty in human preference, fuzzy sets could be incorporated with the pairwise comparison as an extension of AHP. A variant of AHP, called Fuzzy AHP, comes into implementation in order to overcome the compensatory approach and the inability of the AHP in handling linguistic variables. The fuzzy AHP approach allows a more accurate description of the decision making process.
4. Proposed model
One of the important issues of multi-criteria decision-making is prioritization of criteria. Determining the importance of weights by managers, especially in terms of issue of MC-ABC classification, is always subjective in such a way that inventory managers usually select some important criteria and then prioritize them. There are several methods to determine the criteria weights, including AHP, entropy analysis, eigenvector method, weighted least square method and linear programming for multi dimensions of analysis preference (LINMAP). In this model, the method of fuzzy analytic hierarchy process (FAHP) is applied.
Generally, it is impossible to reflect the decision makers’ uncertain preferences through crisp values. Therefore, FAHP is proposed to relieve the uncertainness of AHP method, where the fuzzy comparisons ratios are used. There are the several procedures to attain the priorities in FAHP. The fuzzy least square method (Xu, 2000), method based on the fuzzy modification of the LLSM (Boender et al., 1989), geometric mean method (Buckley, 1985), the direct fuzzification of the method of Csutora and Buckley (2001), synthetic extend analysis (Chang, 1996), Mikhailov’s fuzzy preference programming (Mikhailov, 2003) and two-stage logarithmic programming (Wang et al., 2005) are some of these methods. Chang’s extent analysis is utilized in this research to evaluate the focusing problem.
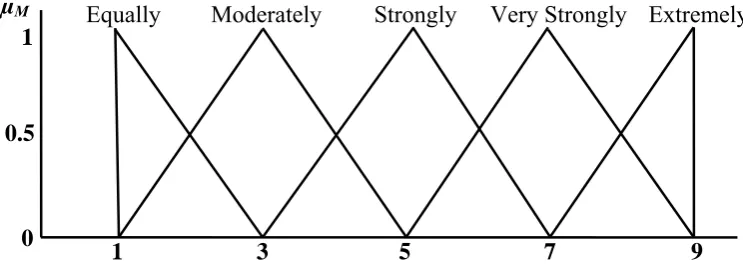
Chang (1992) introduced a new approach for handling pair-wise comparison scale based on triangular fuzzy numbers followed by use of extent analysis method for synthetic extent value of the pairwise comparison (Chang, 1996). The first step in this method is to use triangular fuzzy numbers for pairwise comparison by means of FAHP scale, and the next step is to use extent analysis method to obtain priority weights by using synthetic extent values. The fuzzy evaluation matrix of the criteria was constructed through the pairwise comparison of different attributes relevant to the overall objective using the linguistic variables and triangular fuzzy numbers (Fig. 2 and Table 1).
Fig. 2. Linguistic Variables for the Importance Weight of Each Criterion 1
0.5
0
µM
1 3 5 7 9
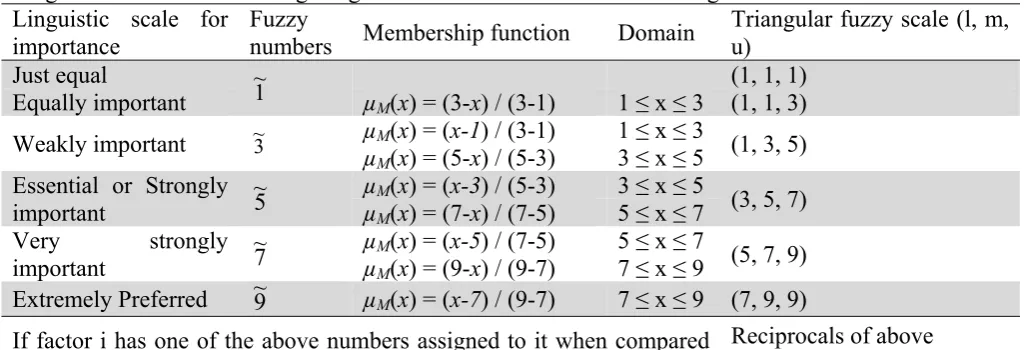
Table 1
Linguistic variables describing weights of the criteria and values of ratings Linguistic scale for
importance
Fuzzy
numbers Membership function Domain
Triangular fuzzy scale (l, m, u)
Just equal
1
~ (1, 1, 1)
Equally important µM(x) = (3-x) / (3-1) 1 ≤ x ≤ 3 (1, 1, 3) Weakly important ~3 µµM(x) = (x-1) / (3-1) 1 ≤ x ≤ 3 (1, 3, 5)
M(x) = (5-x) / (5-3) 3 ≤ x ≤ 5 Essential or Strongly
important 5~
µM(x) = (x-3) / (5-3) 3 ≤ x ≤ 5 (3, 5, 7)
µM(x) = (7-x) / (7-5) 5 ≤ x ≤ 7 Very strongly
important ~7 µµMM((xx) = (9-) = (x-5x) / (9-7)) / (7-5) 5 ≤ x ≤ 7 7 ≤ x ≤ 9 (5, 7, 9) Extremely Preferred 9~ µM(x) = (x-7) / (9-7) 7 ≤ x ≤ 9 (7, 9, 9) If factor i has one of the above numbers assigned to it when compared
to factor j, then j has the reciprocal value when compare to i
Reciprocals of above
1 1
~
M = (1/u1,1/m1,1/l1) Source: Bozbura & Beskese (2007)
The following section outlines the Chang’s extent analysis method on FAHP. Let X = {x1, x2,…, xn} be an object set and U = {u1,u2 ,….,um} be a goal set. As per Chang (1992, 1996) each object is taken and analysis for each goal, gi, is performed, respectively. Therefore, m extent analysis values for each object can be obtained, as under:
, ,….., , i = 1, 2, 3,…..,n
where all the ( j = 1, 2,….,m ) are TFNs whose parameters are, depicting least, most and largest possible values respectively and represented as (a, b, c). The steps of Chang’s extent analysis (Chang, 1992) can be detailed as follows (Bozbura et al., 2007; Kahraman et al., 2004; Kabir & Hasin, 2011):
Step 1: The value of fuzzy synthetic extent with respect to i th object is defined as
∑
∑
∑
To obtain
∑
M
g ij m
j=1 perform the fuzzy addition operation of m extent analysis values for a particular
matrix such that
∑
M
gi
j m
j=1
=
∑
j=1ma
j,
∑
mj=1b
j,
∑
j=1mc
j ,and to obtain
∑
∑
-1 perform the fuzzy addition operation of(j = 1, 2,….,m) values
such that
∑
∑
∑
, ∑
, ∑
,
and then compute the inverse of the vector in Eq. (11) such that
∑
∑
∑
,
∑,
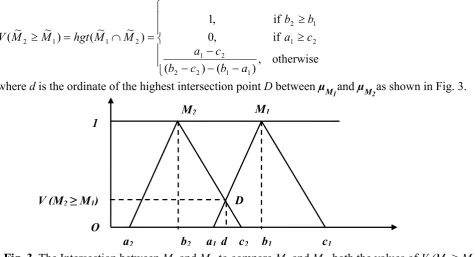
∑ .Step 2:The degree of possibility of M2 = (a2, b2, c2) ≥ M1 = (a1, b1, c1) is defined as
V (M2≥ M1) = sup [min (µM
128 otherwise , ) ( ) ( if , 0 if , 1 ) ~ ~ ( ) ~ ~ ( 1 1 2 2 2 1 2 1 1 2 2 1 1 2 a b c b c a c a b b M M hgt M M V
where d is the ordinate of the highest intersection point D between µM
1and µM2as shown in Fig. 3.
Fig. 3. The Intersection between M1 and M2 to compare M1 and M2, both the values of V (M1 ≥ M2) and V (M2 ≥ M1)
Step 3: The degree of possibility for a convex fuzzy number to be greater than k convex fuzzy
numbers Mi(i = 1,2,….., k ) can be defined by
V (M ≥ M1, M2,…., Mk) = V[(M ≥ M1) and (M ≥ M2 ) and … (M ≥ Mk)] = min V (M ≥ Mi), (i = 1, 2, 3 ,…., k)
Assuming that d' (Ai) = min V (Si≥ Sk) for k = 1, 2, 3,…., n; k ≠ i. Then the weight vector is given by
W' = ( d' (A1), d' (A2),….., d' (An))T where Ai =(i = 1,2,3,…n) are n elements.
Step 4:By normalizing, the normalized weight vectors are
W = ( d (A1), d (A2),….., d (An))T where W is a non-fuzzy number.
5. Application of the Model
To accredit the proposed model, it is implemented for the 351 raw materials of switch gear section of Energypac Engineering Limited (EEL), one of the leading power engineering companies in Bangladesh. Energypac Engineering Ltd. is the manufacturer of Transformer (Power Transformer, Distribution Transformer and Instrumental Transformer) and Switchgear (Outdoor vacuum circuit breaker, Indoor vacuum circuit breaker, Control, Metering and Relay panels, Low Tension and Power Factor Improvement panel, Indoor type Load Break Switch, Outdoor Offload disconnector and By-pass switch). Fuzzy Analytic Hierarchy Process (Fuzzy AHP) is used to determine the relative weights of the attributes or criterions and to classify inventories into different categories through training the data set.
5.1 Determination of Criteria
Based on the extensive literature review, experts participating in the implementation of this model have regarded five important criteria for classification of inventory. Those are: Unit Price, Annual Demand, Criticality, Last Use Date and Durability.
M2 M1
a2 b2 a1 d c2 b1 c1
V (M2≥ M1)
O 1
5.2 Determination of the Weights of Criteria Using FAHP
For Multicriteria inventory classification, a questionnaire was designed to elicit judgments about the relative importance of each of the selected criteria. The questionnaire was completed by fourteen experts, among them three academia’s and eleven professional including raw material and inventory manager of EEL. Table 2 shows the aggregated fuzzy pairwise comparisons of the fourteen experts or decision maker’s. The aggregated decision matrix as shown in Table 2 is constructed to measure the relative degree of importance for each criterion, based on the Chang’s extent analysis.
Table 2
Aggregated fuzzy comparison matrix of the attributes with respect to the overall objective
Attributes Unit Price Annual Demand Criticality Last Use Date Durability Unit Price 1,1,1 0.89,1.6,2.25 0.65,1.07,1.88 0.82,1.47,2.76 0.8,1.37,3.19 Annual Demand 0.44,0.62,1.12 1,1,1 2.02,3.08,4.64 0.80,1,1.47 1.17,2.36,4.53 Criticality 0.53,0.93,1.53 0.22,0.34,0.50 1,1,1 0.68,1.11,1.66 0.80,1,1.72 Last Use Date 0.36,0.68,1.21 0.68,1,1.26 0.60,0.90,1.47 1,1,1 0.76,0.93,1.25 Durability 0.31,0.73,1.26 0.22,0.42,0.86 0.58,1,1.26 0.80,1.08,1.32 1,1,1
Inconsistency of TFN used can be checked and the consistency ratio (CR) has to calculate. The results obtained are: largest Eigenvalue of matrix, λmax= 5.323; Consistency Index (C.I.) = 0.08075; Randomly Generated Consistency Index (R.I.) = 1.12 and Consistency Ratio (C.R.) = 0.0721 As CR < 0.1 the level of inconsistency present in the information stored in comparison matrix is satisfactory (Saaty, 1998).
SU= (4.16, 6.51, 11.08) (1/42.14, 1/27.68, 1/19.13) = (0.09, 0.235, 0.58)
SA= (5.43, 8.06, 12.76) (1/42.14, 1/27.68, 1/19.13) = (0.13, 0.291, 0.67)
SC= (3.23, 4.38, 6.41) (1/42.14, 1/27.68, 1/19.13) = (0.077, 0.158, 0.34)
SL= (3.4, 4.51, 6.19) (1/42.14, 1/27.68, 1/19.13) = (0.08, 0.163, 0.32)
SD= (2.91, 4.23, 5.7) (1/42.14, 1/27.68, 1/19.13) = (0.07, 0.153, 0.30)
The degree of possibility of superiority of SUis calculated and is denoted by V (SU ≥ SA). Therefore, the degree of possibility of superiority for the first requirement- the values are calculated as
V (SU≥ SA) = 0.9, V (SU≥ SC) = 1,
V (SU≥ SL) = 1, V (SU≥ SD) = 1, For the second requirement- the values are calculated as
V (SA≥ SU) = 1, V (SA≥ SC) = 1,
V (SA≥ SL) = 1, V (SA≥ SD) = 1, For the third requirement- the values are calculated as
V (SC≥ SU) = 0.75, V (SC≥ SA) = 0.61,
V (SC≥ SL) = 0.98, V (SC≥ SD) = 1, For the fourth requirement- the values are calculated as
V (SL≥ SU) = 0.75, V (SL≥ SA) = 0.60,
V (SL≥ SC) = 1, V (SL≥ SD) = 1, For the fifth requirement- the values are calculated as
V (SD≥ SU) = 0.70, V (SD≥ SA) = 0.55,
V (SD≥ SC) = 0.98, V (SD≥ SL) = 0.96,
The minimum degree of possibility of superiority of each criterion over another is obtained. This further decides the weight vectors of the criteria. Therefore, the weight vector is given as
W'= (0.9, 1, 0.61, 0.60, 0.55)
130
weight of each success factor is depicted in Fig. 4. Fig. 4shows that the annual demand has higher priority than the other criteria. The weights of the criteria represent the ratio of how much more important one criterion is than another, with respect to the goal or criterion at a higher level.
U n i t P r i c e A n n u a l D e m a n d C r i t i c a l i t y L a s t U s e D a t e D u r a b i l i t y
0 . 0 0 0 . 0 5 0 . 1 0 0 . 1 5 0 . 2 0 0 . 2 5 0 . 3 0
We
ig
h
ts
C r i t e r i a W e i g h t s
Fig. 4. Normalized Weights of Criteria for Multiple Criteria Inventory Classification
5.3 Data Collection
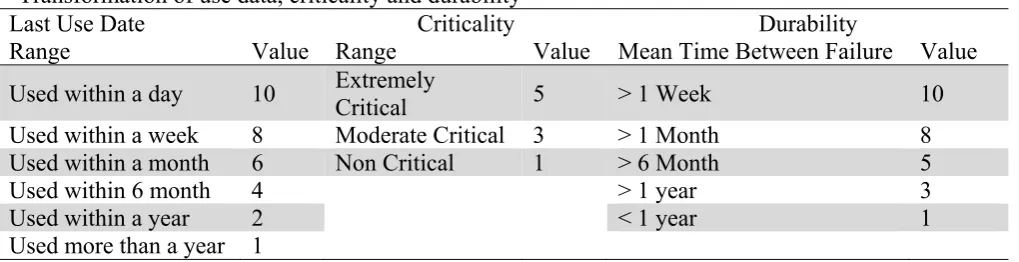
Unit price, last year consumption or annual demand, last use date, criticality, durability of 351 materials of switch gear section has been collected. Range and value for the transformation of last use date, criticality and durability are shown in Table 3.
Table 3
Transformation of use data, criticality and durability
Last Use Date Criticality Durability
Range Value Range Value Mean Time Between Failure Value Used within a day 10 Extremely
Critical 5 > 1 Week 10
Used within a week 8 Moderate Critical 3 > 1 Month 8 Used within a month 6 Non Critical 1 > 6 Month 5
Used within 6 month 4 > 1 year 3
Used within a year 2 < 1 year 1
Used more than a year 1
5.4 Determination of Composite Priority Weights
or average important and the remaining 282 items as class C or unimportant group or relatively unimportant as a basis for a control scheme.
6. Discussions
Fuzzy linguistic terms has been employed for facilitating the comparisons between the subject criteria, since the decision makers feel much comfortable with using linguistic terms rather than providing exact crisp judgments. Using Chang’s extent analysis, the normalized weight of each attributes is depicted which in shown in Fig. 4. Fig. 4 shows that the annual demand has higher priority (0.273) than the other criteria. Among 351 items 22 items are identified as class A or very important group or outstandingly important, 47 items as class B or important group or average important and the remaining 282 items as class C or unimportant group or relatively unimportant as a basis for a control scheme using composite priority weight of each alternative. The classification system is very flexible in the sense that the user: can incorporate some other criteria or remove any criteria for his/her specific implementation, can conduct different classification analyses for different inventory records, can employ an application-specific linguistic variable set, can substitute the crisp comparison values aij for the fuzzy comparison values a~ij in the optimization program, whenever the fuzzy comparisons are not available.
7. Conclusions
In today’s manufacturing and business environment, an organization must maintain an appropriate balance between critical stock-outs and inventory holding costs. Because customer service is not a principal factor for attracting new customers, but it is frequently a major reason for losing them. Many researchers have devoted themselves to achieving this appropriate balance. Multi-class classification utilizing multiple criteria requires techniques capable of providing accurate classification and processing a large number of inventory items. In this research, a new multi-criteria inventory classification model has been proposed using Fuzzy Analytic Hierarchy Process (FAHP) approach. Fuzzy AHP technique was used to synthesize the opinions of the decision makers to identify the weight of each criterion. The FAHP approach proved to be a convenient method in tackling practical multi-criteria decision making problems. It demonstrated the advantage of being able to capture the vagueness of human thinking and to aid in solving the research problem through a structured manner and a simple process. Further development of FAHP application could be the improvement in the determination of the weights of each component and to handle uncertainty level of the decision environment by using hybrid neuro-fuzzy models, like the quick fuzzy backpropagation algorithm.
References
Bhattacharya, A., Sarkar, B., & Mukherjee, S.K. (2007). Distance-based consensus method for ABC analysis.
International Journal of Production Research, 45(15), 3405-3420.
Boender, C.G.E., de Graan, J.G., & Lootsma, F.A. (1989). Multi-criteria decision analysis with fuzzy pairwise comparisons. Fuzzy Sets and Systems, 29(2), 133–143.
Bozbura, F.T., & Beskese, A. (2007). Prioritization of organizational capital measurement indicators using fuzzy AHP. International Journal of Approximate Reasoning, 44(2), 124-147.
Bozbura, F.T., Beskese, A., & Kahraman, C. (2007). Prioritization of human capital measurement indicators using fuzzy AHP. Expert Systems with Applications, 32(4), 1100-1112.
Braglia, M., Grassi, A., & Montanari, R. (2004). Multi-attribute classification method for spare parts inventory management. Journal of Quality in Maintenance Engineering, 10(1), 55-65.
Buckley, J.J. (1985). Fuzzy hierarchical analysis. Fuzzy Sets and Systems, 17(3), 233-247.
132
Chang, D.Y. (1996). Applications of the extent analysis method on fuzzy AHP. European Journal of
Operational Research, 95(3), 649-655.
Chase, R. B., Jacobs, F. R., Aquilano, N. J., & Agarwal, N. K. (2006). Operations Management for
Competitive Advantage. 11th Edition, McGraw Hill, New York, USA.
Chen, Y., Kilgour, D.M., & Hipel, K.W. (2008a). A case-based distance model for screening in multiple criteria decision aid. OMEGA, 36(3), 373-383.
Chen, Y., Li, K.W., Kilgour, D.M., & Hipel, K.W. (2008b). A case-based distance model for multiple criteria ABC analysis. Computers & Operations Research, 35(3), 776-796.
Csutora, R., & Buckley, J.J. (2001). Fuzzy hierarchical analysis: The Lambda-Max Method. Fuzzy Sets and
Systems, 120(2), 181–195.
Flores, B.E., & Whybark, D.C. (1986). Multiple Criteria ABC Analysis. International Journal of Operations
and Production Management, 6(3), 38-46.
Flores, B.E., & Whybark, D.C. (1987). Implementing Multiple Criteria ABC Analysis. Journal of Operations
Management, 7(1), 79-84.
Flores, B.E., Olson, D.L., & Dorai, V.K. (1992). Management of Multicriteria Inventory Classification.
Mathematical and Computer Modeling, 16(12), 71-82.
Guvenir, H.A., & Erel, E. (1998). Multicriteria inventory classification using a genetic algorithm. European
Journal of Operational Research, 105(1), 29-37.
Hadi-Vencheh, A. (2010). An improvement to multiple criteria ABC inventory classification. European
Journal of Operational Research, 201(3), 962-965.
Jamshidi, H., & Jain, A. (2008). Multi-Criteria ABC Inventory Classification: With Exponential Smoothing Weights. Journal of Global Business Issues, Winter issue.
Kabir, G., & Hasin, M.A.A. (2011). Evaluation of Customer Oriented Success Factors in Mobile Commerce Using Fuzzy AHP. Journal of Industrial Engineering and Management, Article in press.
Kahraman, C., Cebeci, U., & Ruan, D. (2004). Multi-attribute comparison of catering service companies using fuzzy AHP: the case of Turkey. International Journal of Production Economics, 87(2), 171-184.
Lei, Q.S., Chen, J., & Zhou, Q. (2005). Multiple criteria inventory classification based on principal components analysis and neural network. Proceedings of Advances in neural networks, Berlin, 1058-1063. Liu, Q., & Huang, D. (2006). Classifying ABC Inventory with Multicriteria Using a Data Envelopment
Analysis Approach. Proceedings of the Sixth International Conference on Intelligent Systems Design and
Applications (ISDA'06), 1, 1185-1190, Jian, China.
Mikhailov, L. (2003). Deriving priorities from fuzzy pairwise comparison judgements. Fuzzy Sets and Systems, 134(3), 365-385.
Nahmias, S. (2004). Production and Operations Analysis. 5th Edition, Irwin/McGraw Hill, Burr Ridge, IL, USA, 213-215.
Ng, W.L. (2007). A simple classifier for multiple criteria ABC analysis. European Journal of Operational
Research, 177(1), 344-353.
Partovi, F.Y., & Burton, J. (1993). Using the analytic hierarchy process for ABC analysis. International
Journal of Production and Operations Management, 13(9), 29-44.
Partovi, F.Y., & Anandarajan, M. (2002). Classifying inventory using and artificial neural network approach.
Computers & Industrial Engineering, 41(4), 389-404.
Ramanathan, R. (2006). ABC inventory classification with multiple-criteria using weighted linear optimization. Computers & Operations Research, 33(3), 695-700.
Saaty, T.L. (1980). The analytic hierarchy process. New York, NY: McGraw-Hill.
Saaty, T.L. (1998). The Analytic Hierarchy Process: Planning, Priority Setting, Resource Allocation. Pittsburgh: RWS Publications.
Šimunović, K., Šimunović, G., & Šarić, T. (2009). Application of Artificial Neural Networks to Multiple Criteria Inventory Classification. Strojarstvo, 51(4), 313-321.
Wang, Y.M., Yang, J.B., & Xu, D.L. (2005). A two-stage logarithmic goal programming method for generating weights from interval comparison matrices. Fuzzy Sets Systems, 152, 475-498.
Xu, R. (2000). Fuzzy least square priority method in the analytic hierarchy process. Fuzzy Sets and Systems, 112(3), 395-404.
Yu, M.C. (2011). Multi-criteria ABC analysis using artificial-intelligence-based classification techniques.
Expert Systems with Applications, 38(4), 3416-3421.
Zadeh, L.A. (1965). Fuzzy sets. Information and Control, 8(3), 338-353.