VOLUME 36, ARTICLE 51, PAGES 1549
,
1600
PUBLISHED 12 MAY 2017
http://www.demographic-research.org/Volumes/Vol36/51/ DOI: 10.4054/DemRes.2017.36.51
Research Article
The fertility response to the Great Recession in
Europe and the United States:
Structural economic conditions and perceived
economic uncertainty
Chiara Ludovica Comolli
© 2017 Chiara Ludovica Comolli.
This open-access work is published under the terms of the Creative Commons Attribution NonCommercial License 2.0 Germany, which permits use, reproduction & distribution in any medium for non-commercial purposes, provided the original author(s) and source are given credit.
1 Introduction 1550 2 The economic and financial crisis indicators 1552 2.1 The Great Recession in Europe and the United States 1552 2.2 Structural economic conditions and perceived economic uncertainty 1553
3 Fertility during the Great Recession 1559
4 Literature background 1561
5 The impact of aggregate economic and financial indicators on
age-, parity-, and education-specific fertility rates 1564
5.1 Data and method 1564
5.2 Results 1568
6 Conclusions 1578
7 Acknowledgments 1580
References 1581
The fertility response to the Great Recession in Europe
and the United States:
Structural economic conditions and perceived economic uncertainty
Chiara Ludovica Comolli1
Abstract
BACKGROUND
This study further develops Goldstein et al.’s (2013) analysis of the fertility response to the Great Recession in western economies.
OBJECTIVE
The purpose of this paper is to shed light on the fertility reaction to different indicators of the crisis. Beyond the structural labor market conditions, I investigate the dependence of fertility rates on economic policy uncertainty, government financial risk, and consumer confidence.
METHODS
Following Goldstein et al. (2013), I use log-log models to assess the elasticity of age-, parity-, and education-specific fertility rates to an array of indicators. Besides the inclusion of a wider set of explanatory variables, I include more recent data (2000−2013) and I enlarge the sample to 31 European countries plus the United States.
RESULTS
Fertility response to unemployment in some age- and parity-specific groups has been, in more recent years, larger than estimated by Goldstein et al. (2013). Female unemployment has also been significantly reducing fertility rates. Among uncertainty measures, the drop in consumer confidence is strongly related to fertility decline and in Southern European countries the fertility response to sovereign debt risk is comparable to that of unemployment. Economic policy uncertainty is negatively related to TFR even when controlling for unemployment.
CONCLUSIONS
Theoretical and empirical investigation is needed to develop more tailored measures of economic and financial insecurity and their impact on birth rates.
CONTRIBUTION
The study shows the nonnegligible influence of economic and financial uncertainty on
birth rates during the Great Recession in Western economies, over and above that of structural labor market conditions.
1. Introduction
Empirical evidence repeatedly suggests the existence at the aggregate level of a procyclical relationship between fertility behavior and economic growth as having characterized developed societies on completion of the Demographic Transition. Periods of economic depression have been characterized by downturns in fertility, followed by more prosperous intervals when fertility was recuperated. The vast majority of the 20th century financial and economic crises, albeit very differently and for various reasons, brought about a reduction, more or less pronounced, in fertility. However, the impact of economic depressions on fertility rates is normally rather small and of short duration because such socioeconomic factors are relatively short-term compared to secular demographic trends (Lee 2003; Lesthaeghe 2010). All those recession events occurred in a context of long-term fertility decline that was only partially accelerated by economic hardship (Lee 1987, 1997, 2003; Morgan, Cumberworth, and Wimer 2011, 2012; Sobotka, Skirbekk, and Philipov 2010, 2011).
Looking at the trend of the Total Fertility Rate (TFR) in the United States since 1920, illustrated in Figure 1, it is evident that periods of economic recession, highlighted with vertical bars, entailed only a small and temporary decline in birth rates compared to the large dips in fertility that characterized the inter-war period and the two decades of the 1960s and 1970s. Societal changes, access to contraceptive measures, and cultural revolutions had a crucial long-lasting impact on childbearing behavior, and economic downturn only accelerated an existing negative trend in fertility, or halted a positive trend. However, the effect of macroeconomic conditions on fertility is heterogeneous across crisis events, historical periods, and country cases (Kreyenfeld, Andersson, and Pailhé 2012). Compared to the three previous episodes, the fertility decline in the United States during the Great Recession has been stronger and has lasted longer.
Figure 1: Total fertility rate in United States (1920−2014)
Source: Elaboration of the author based on data from US National Center for Health Statistics. Social Security Administration 1997 for data 1920−1980.
Moreover, the 1929 crash materialized in a period when, first, TFR was well above 2.5 children per women and, second, the decline in fertility had already been ongoing for two decades because of the advent of the first birth control movement, which promoted family planning among married couples to space children and reduce family size (Dawson, Meny, and Ridley 1980; Wardell 1980). By contrast, the Great Recession hit Western countries during decades of stagnant fertility at exceptionally low historical levels. The first years of the 2000s were characterized by a moderate but diffused rise in birth rates that was abruptly halted by the onset of the economic and financial crisis of 2007. This means that even though the short-term consequences of the Great Recession for births might seem only mild and temporary, the long-term negative effects on fertility rates might be substantial and persistent.
The aim of this paper is to add to the existing evidence of aggregate-level studies on the impact of the Great Recession on fertility rates. This paper starts from a recent study by Goldstein and colleagues (2013) in which they investigate the role of rising unemployment in Europe on the decline in births during the first decade of the 21st
female unemployment − but I also include indicators of financial and economic uncertainty. In particular, I look at the fertility response to long-term sovereign risk and to a newly developed index of economic policy uncertainty (Baker, Bloom, and Davis 2012) and, finally, also to consumer confidence. The distinctive contribution of this paper is to assess whether these latter indicators of economic uncertainty are as relevant in influencing fertility as material conditions. This is a crucial issue that has rarely been treated in the literature of aggregate studies of fertility and business cycles (for an exception, see Schneider 2015).
After this brief introduction the paper is structured as follows. Section 2 describes the trend in the main indicators of the recession that will be used in the subsequent analysis, section 3 shows the trend in fertility in Europe and in the United States during the Great Recession, and section 4 describes how this study fits into the existing literature. Section 5 introduces data and methods and presents the results. Finally, section 6 draws the conclusions.
2. The economic and financial crisis indicators
2.1 The Great Recession in Europe and the United States
The Business Cycle Dating Committee of the US National Bureau of Economic Research (NBER) declared that the recession in the United States began in December 2007 and ended in June 2009. Driven by the burst of the housing bubble and the subprime mortgage crisis of 2007, the financial crisis rapidly led to a deep recession. Real Gross Domestic Product (GDP) began contracting in the third quarter of 2008, reaching almost −5% in 2009, and US demand shrank for five consecutive quarters at the pace of −2.6% per quarter.
According to the US Security and Exchange Commission (SEC), between June 2007 and November 2008 Americans lost an estimated average of more than a quarter of their collective net worth (Altman 2009). The unemployment rate – traditionally quite low in the United States, around 4%−6% between 2000 and 2008 – peaked at 10% in October 2009 and remained above 8% until mid2012 (Bureau of Labor Statistics -BLS).2
2 In December 2014 the unemployment rate was down to 5.6% but part of the recuperation was due to the
Financial instability and the economic downturn spread rapidly to the other side of the Atlantic. At the end of 2008 the eurozone had also entered into recession and in 2009 average unemployment rates in the eurozone hit a 10-year high (9.7%).
The Great Recession, however, hit European countries in a heterogeneous way. Some countries were struck earlier and more severely than others that were generally doing better. Some countries were penalized more strongly by the exposure of financial institutions and the banking sector to the subprime crisis in the United States, while others were damaged later on by the consequences for the real economy and the confidence crisis in sovereign debt. In late 2009 fears of a sovereign debt crisis spread among investors as a result of the growing indebtedness of the private and public sectors. A crisis of confidence emerged in those European countries traditionally characterized by large public debt and it materialized in widening sovereign bond yield spreads between them and the more virtuous countries, led by Germany.3 The peak of
public financial insecurity was registered in Southern European countries in the second half of 2011, when governments in a few countries were forced to resign due to their loss of credibility in the financial markets.
Overall, the well-known narrative of the crisis illustrates that the complexity of the Great Recession and the uncertainty it generated cannot be represented only through trends in traditional indicators such as GDP and unemployment rate, and that a wider array of measures needs to be identified to grasp the effects produced by such an extraordinary event.
2.2 Structural economic conditions and perceived economic uncertainty
Production and employment are the most commonly used indicators of business cycle fluctuation. The very definition of recession implies registering two consecutive quarters of negative real Gross Domestic Product (GDP) growth (NBER, Business Cycle Dating Committee).The United States entered first into recession, at the end of 2007, but the largest drop in GDP growth was registered when Europe also entered into recession in the second quarter of 2008. The negative peak was −2% in the United States and almost −3% in the euro area. The latter entered into a second recession in the third quarter of 2011 when, as described in section 2.1, the sovereign debt crisis was
3 The confidence crisis was so remarkable that despite the fact that only a few European countries registered
already underway. This second time the absolute drop in GDP was less dramatic, but the EU stayed longer in recession, for almost eight quarters. In the last quarter of 2012 the Eurozone economy shrank by 0.6%. Countries below the average were Italy, which contracted by 0.9%, Spain (‒0.7%), Greece (‒0.6%), and Portugal, which with a negative GDP growth of ‒1.8% was by far the worst performer. Germany contracted at the average, while France was the eurozone country doing least badly, with a negative GDP growth of ‒0.3%.
The second most used indicator of an economic downturn is unemployment. Figure 2 illustrates for a few European countries and the United States the substantial country variation in the trend in unemployment rates before and during the Great Recession. In Southern European countries, unemployment rates have increased by more than 15 percentage points since 2007, crossing the impressive threshold of 25% in 2013. In other countries like the United States, the United Kingdom, and Denmark unemployment never went beyond 10% and has increased by around 5 percentage points since 2008. Finally, some countries like Germany or Belgium never really faced a surge in unemployment rates.
Figure 2: Unemployment rate in selected European countries and the United States (2000−2013)
Source: Elaboration of the author based on Eurostat data.
reinforced, in a negative spiral, the deterioration of the real economy (ILO 2013). Given its complex nature it is difficult to measure economic uncertainty precisely, and in fact how it is estimated in the literature is very heterogeneous. There are different proxies for economic uncertainty, none exhaustive in themselves, but nonetheless useful in focusing on certain types of uncertainty. Commonly used measures are financial indicators, like volatility in the stock market or in sovereign debt risk, more institution-related indicators like the degree of policy uncertainty, and, finally, consumer-oriented measures such as the consumer confidence index.
Figure 3 shows the trend in 10-year government bond yields in selected European countries between January 2007 and December 2013 (ECB). The trend of long-term interest rates on public debt confirms that the peak of the sovereign debt crisis can be traced to between the end of 2011 and the beginning of 2012. The interest rate to be paid on public debt is a very sensitive measure of the risk associated with a country’s ability to repay its debt, and therefore of the uncertainty associated with credit worthiness and the solidity of a country’s financial system. Germany, considered the safest country for investment, is usually taken as the reference when measuring the relative riskiness of other European countries, with an interest rate of around 1.6%. The most risky is Greece, with a long-term public debt interest rate above 9% after the summer of 2010 (orange line).4 Other countries that exceeded the critical threshold of
6% were Portugal, Ireland, Cyprus, Italy, and Spain.
In 2012 the American professor Scott R. Baker and two colleagues5 developed
another interesting and more comprehensive measure of economic uncertainty, the Economic Policy Uncertainty (EPU) Monthly Index6 (at the moment of writing
available for the United States, Germany, France, Ireland, Italy, Spain, the United Kingdom, and the Netherlands). The index is a composite indicator of three measures of uncertainty: the frequency of newspaper references to economic policy uncertainty, the number of federal tax code provisions set to expire, and the extent of forecaster disagreement over future inflation and government purchases. The first component of the index is itself an index of the frequency of references to policy-related economic uncertainty in the leading newspapers of each country (tailored to different relevant terms in different contexts).7 The second component (for the United States only)
measures the number of temporary tax provisions that will expire in the following years
4 Greek government bond yields peaked in February 2012 at around 29% and again in June at around 28% –
insanely large rates given that the threshold considered to be critical for debt repayment is 6%.
5 S. R. Baker (Northwestern University); N. Bloom (Stanford) and S.J. Davis (University of Chicago Booth
School of Business).
6Data is freely available on www.policyuncertainty.com.
7Terms or derivatives of ‘uncertain’, together with ‘economy’ and one or more of the terms: ‘congress,’
and will be subject to a last-minute decision by Congress as to whether to extend them or not, clearly creating a source of uncertainty for actors in the economy.8 The third
component is economic forecaster disagreement. For the United States it draws from the Federal Reserve Bank of Philadelphia’s Survey of Professional Forecasters (SPF), and for each of the other seven European countries from the Consensus Economics Forecast database of public expenditure. For the United States the authors used individual data on three forecast variables: Consumer Price Index (CPI), the purchase of goods and services at state and local government levels, and the purchase of goods and services by the federal government. The dispersion of those variables in the forecasts represents uncertainty related to monetary policy issues and consumer confidence insecurity. For European countries the index relies on the dispersion of individual forecasts of CPI and budget balances, scaled by national GDP.
Figure 3: Long-term government bond yields in eurozone countries 2007−2013
Source: Elaboration of the author based on ECB data. Secondary market yields of government bonds with maturities close to 10 years.
Figure 4 illustrates Baker, Bloom, and Davis’ (2012) EPU Index monthly trend between January 2000 and March 2014 for the United States and Europe. The level of uncertainty is clearly higher during the Great Recession than during previous events; for
8This component is present only in the case of the United States, expiring tax code provisions being a very
example, the 9/11 terrorist attacks in the United States. The black line represents the EPU monthly index in the United States. The trend is very similar to that of the eurozone countries (in grey): it started to rise in late summer 2007 and rose sharply with the Lehman Brothers bankruptcy in September 2008, when the index reached 190 points. It stayed at quite high levels during 2009 and it peaked again in August 2011 at 245 points.9 Thereafter the index of uncertainty stabilized around 100 points – still a
higher level than in the pre-crisis period. Figure A-1 in the Appendix plots the EPU index in the seven available European countries – Germany, Ireland, Italy, the United Kingdom, Spain, France, and the Netherlands – in the time interval 2000−2014. The index correlates strongly with the events described in the previous section, peaking simultaneously with the collapse of the first financial institutions in Europe. Later on the index peaks in conjunction with events related to the sovereign debt crisis, like Greek requests for financial aid (and the following riots and heavy protests) and the resignation of the Italian government in November 2011.
Figure 4: Monthly economic policy index in the United States and a few European countries (2000−2014)
Source: Elaboration of the author based on Baker, Bloom, and Davis (2012). The EPU index in available for six European countries: Germany, Italy, United Kingdom, Spain, France, and the Netherlands.
The last indicator used to assess the fertility response to the Great Recession is the Consumer Confidence Index (CCI). This is constructed from households’ assessment of their current and immediate future expectations regarding their economic situation and major purchases intentions. Consumers evaluate their present and future situation by
9After Congress passed a bill which allowed a rise in the country’s borrowing limits, and S&P downgraded
the credit rating of US bonds for the first time in history. 0
50 100 150 200 250 300
E
co
n
o
m
ic
p
o
lic
y
u
n
ce
rt
a
in
ty
m
o
n
th
ly
in
d
e
x
assessing the direction of change in their financial plans compared to a ‘normal’ state, and the balance between the positive and negative answers provides the aggregate times series confidence trend (OECD 2017).
Figure 5 illustrates the monthly trend in CCI in the United States and in Europe (OECD data) between January 2000 and January 2014. The OECD index is calculated so that 100 points represent the CCI long-term average. From the beginning of the 21st century, consumer confidence declined in both Europe and the United States, from around 101.5 points to below 100, but the decline was stronger in the United States.
Figure 5: Consumer confidence index (CCI) in the United States and average EU countries (2000−2014)
Source: OECD (2017), Consumer Confidence Index (CCI) (indicator). Accessed on 15 February 2017.
Note: Amplitude adjusted, Long-term average = 100.
Compared with the other indicators of the crisis, the CCI directly pinpoints households’ financial intentions and expectations. These are more volatile than other institutional indicators of uncertainty because they are a barometer of the crisis that is closer to how it is perceived by individuals, rather than institutions. In addition, as Figure A-2 in the Appendix shows, cross-country variation in the index is large. While in many European countries we see a substantial drop in the CCI in the years of the crisis (e.g., Estonia, Latvia), in others the decline is more gradual (e.g., Greece, Italy), and in a third group of countries we do not see any decline in confidence (Austria, France).
3. Fertility during the Great Recession
The deteriorating economic conditions negatively impact households’ consumption, investment, and savings arrangements, and generally weigh on family dynamics. Figure 6 illustrates the trend in TFR in nine European countries and the United States during the period 2001−2013. The first relevant pattern in the figure is the well-known persistent north-south dichotomy in fertility: in the last 10-15 years the Nordic countries and the United States have maintained an average fertility rate of around 1.9−2, while Southern European countries like Italy, Greece, and Spain have averaged 1.3−1.4 children per woman.10
The second interesting and widely known fact is that in both groups of countries the beginning of the 2000s saw a diffused and stable increase in fertility, which peaked in 2007 in the United States and a year later in most European countries. This positive trend in fertility, the first continent-wide since the baby boom of the 1970s (Sobotka et al. 2013), has been explained by the recuperation of births that were postponed during the 1990s. Between 2002 and 2008 societal and economic conditions seemed to favor an acceleration of fertility, and in the European countries the TFR increased on average by about 0.15 live births per woman (Lanzieri 2013).
10Fertility in Central Europe has been also quite low. For example, Poland is a country with one of the lowest
Figure 6: Total fertility rate 2002−2013 in selected European countries and the United States
Source: Elaboration of the author based on Eurostat data for European countries, and US data from US National Center for Health Statistics. US data for 2013 from the Population Reference Bureau (Washington D.C.).
Figure 7 depicts the variation in TFR between 2008 and 201311 for the countries
that are analyzed in this paper (31 European countries and the United States, Eurostat data) and the average change in the EU 27 countries. Of those, 22 registered a decline in fertility, 2 saw no change, and in only 8 of them did the TFR increase between 2008 and 2013. The strongest decline in TFR materialized in Iceland and the United States (‒ 0.27 and ‒0.22 births per women respectively, compared to an average decline of 0.06 births in the EU27). The drop was also remarkable in some Southern European countries (Greece) and, surprisingly, in a few Northern countries (Norway, Denmark, and Finland). Germany, France, and Austria are among the countries where the positive fertility trend of the beginning of the century did not reverse.12
112008 and 2013 were chosen because in Europe 2008 is the last year of births conceived before the Great
Recession, and 2013 is the most recent year with available estimates for all countries in Eurostat at the time of writing.
12The picture of the change in fertility between the years 2007−2013 looks very similar, although the TFR
Figure 7: Total fertility rate variation in EU and United States 2008−2013
Source: Elaboration of the author based on Eurostat.
4. Literature background
Many authors have investigated the macrolevel relationship between business cycles and childbearing, especially in the aftermath of the Great Recession. The vast majority of the studies find evidence supporting a procyclical relationship of births to economic fluctuations in advanced economies (Comolli and Bernardi 2015; Lee 2003; Livingston and Cohn 2010; Sobotka, Skirbekk, and Philipov 2010, 2011; Morgan, Cumberworth, and Wimer 2011; Ananat, Gassman-Pines, and Gibson-Davis 2013; Black et al. 2013; Cherlin et al. 2013; Goldstein et al. 2013; Hofmann and Homeyer 2013; Currie and Schwandt 2014; Schneider 2015).13
One strand of research investigates the correlation between productivity or economic growth and fertility rates. For instance, Morgan et al. (2011) recently investigated the period effect of US recession events since 1975 and show the
13Conversely, only a few and subsequently questioned studies (Macunovich 1995, 1996) put forward the
procyclical response of fertility: when the economy goes down, so does fertility. Sobotka and colleagues (2010, 2011) show that among 27 low-fertility countries in the period 1980‒2008 a fall in TFR followed 81% of the episodes of GDP decline and 65% of the cases of GDP stagnation. Adsera and Menendez (2011) find a positive correlation between GDP and fertility rates in 18 Latin American countries and Lanzieri (2013) finds that GDP growth is positively correlated to changes in TFR among European countries. Comolli and Bernardi (2015) find a permanent effect of the Great Recession on cohort childlessness among American women close to the end of their reproductive lives.
However, in many of these studies, this correlation disappears once unemployment variables, individual socioeconomic variables, and consumer confidence are introduced into the model (Sobotka et al. 2010; Adsera and Menendez 2011), suggesting that indicators other than GDP better capture the impact of the business cycle on fertility.14
A larger branch of research focuses on unemployment. Among studies on the United States, Morgan, Cumberworth, and Wimer (2011) show the negative correlation between unemployment rates and the change in fertility rates in 2007‒2009, and Cherlin et al. (2013) find similar results looking at the General Fertility Rate (GFR) between 2007 and 2011. Currie and Schwandt (2014) investigate both the short- and long-term effects of increasing unemployment on births using pseudo cohorts of American women. They show a negative average effect of −0.5 conceptions per 1000 women for each percentage point increase in unemployment. Looking at specific age ranges, the authors find that the fertility of younger women is more negatively affected by unemployment than the fertility of older women. A 1% increase in unemployment rate experienced when women are 20‒24 years old reduces conceptions by about six births per 1000 women, and reduces the completed fertility of these women at 40 years old by about 14 conceptions per 1000 women. Schneider (2015) finds very similar effects when analyzing United States national and local employment conditions across the Great Recession: at the state level, the General Fertility Rate (GFR) declines by 0.60 births per percentage point increase in unemployment rate, after controlling for demographic characteristics of the state and adding state and year fixed effects. The author argues that considering the increase in unemployment during the recession, this effect means a sizeable reduction in births of 7.5%.
Other studies have investigated the nexus between unemployment and fertility in Europe (Ozcan, Mayer, and Luedicke 2010; Adsera and Menendez 2011; Goldstein et al. 2013; Lanzieri 2013; Neels 2010; Neels, Theunynck, and Wood 2013; Sobotka,
14Some studies focus on income. In an interesting paper, Black et al. (2013) use the coal boom of the 1970s
Skirbekk, and Philipov 2011; Sobotka et al. 2013). In these studies, unemployment rate is again found to depress fertility during the Great Recession, especially long-term male unemployment rates on first birth rates (Adsera and Menendez 2011; Neels, Theunynck, and Wood 2013) and among young adults below 25 years old (Goldstein et al. 2013; Lanzieri 2013; Sobotka, Skirbekk, and Philipov 2011; Sobotka et al. 2013). Neels, Theunynck, and Wood (2013) show a strong negative effect of unemployment on the hazard of first births among men and women below 30 years old, especially for the highly educated. After the age of 30, unemployment only influences the probability of having children for men, and not for women.
Finally, Goldstein et al. (2013) investigate the effect of unemployment rates on age and parity-specific fertility rates in 28 European countries in the period 2000‒2010 (using the Human Fertility Database, Eurostat, and OECD data). Confirming previous empirical evidence, the authors find that the elasticity of fertility to unemployment is negative and especially concentrated on very young women and on first births. The effect of a percentage point increase in unemployment rates generates a 0.2% decline in first birth rates among 15‒19-years-old women and a ‒0.1% among women aged 20‒ 24. The effect on second and third births is smaller and generally not statistically different from zero.
A third, smaller group of studies investigate how the perception of an economic downturn and of future uncertainty might affect fertility rates. Already in the 1960s the economist G.S. Becker (1960) argued that changes in fertility rates were positively correlated with the purchase of durable goods. Other more recent studies also focus on the relationship between consumer confidence and fertility. For the United States, Schneider (2015) analyzes the effect of mortgage foreclosure rate, press coverage of the Great Recession, and consumer confidence on birth rates. The author finds that foreclosure start rates and unemployment have a very similar negative effect on GFR (‒ 0.64-point reduction) and that higher levels of consumer confidence are associated with significantly higher fertility rates, while crisis press coverage is negatively but moderately linked to the GFR. Schneider (2015) also finds a significant effect of the CCI after controlling for unemployment rates.
For the Netherlands, van Giersbergen and de Beer (1997) and Fokkema et al. (2008), respectively, find that a 10% increase in the index of consumer confidence is associated with a 1.5% increase in total births per year; and that an increase of 10 points in the confidence index is associated with an increase of 0.04 in TFR. Finally, Hofmann and Hohmeyer (2013) find a negative effect of perceived future employment instability on the fertility of German couples.
to a combination of the different aspects (structural economic conditions and economic insecurity) of the recession is still lacking. That is the objective of this paper.
In the analyses that follow, starting from the above-cited work of Goldstein et al. (2013), I investigate the elasticity of age-, parity-, and education-specific fertility rates to the variation in the different financial and macroeconomic indicators of the Great Recession illustrated in Section 2.2. Importantly, not only do I expand the sample of countries and years and the number of explanatory variables, but I also combine the latter in a unique picture in order to grasp how these different components of the crisis affect childbearing rates.
5. The impact of aggregate economic and financial indicators on
age-, parity-, and education-specific fertility rates
5.1 Data and method
This empirical investigation develops the analysis conducted by Goldstein and colleagues (2013) on the elasticity of age- and parity-specific fertility rates to unemployment in Europe in the period 2000−2010. As in Goldstein et al. (2013), the dependent variables on which I focus are the Total Fertility Rate (TFR), the age-specific fertility rate (ASFR), and the parity-specific fertility rate (first, second, and third births). I also investigate the education-specific fertility rate response to the recession, distinguishing between low- (ISCED 0−2), middle- (ISCED 3−4), and high- (ISCED 5−6) education fertility rates.
Compared to Goldstein et al.’s (2013) paper, the analyses conducted here include more countries (31 European countries15 plus the United States), more recent data
(2000−2013),16 and test the fertility response to a wider array of explanatory variables
that might convey the consequences of the Great Recession on childbearing.
First, the worsening of economic structural conditions during the crisis is captured not only by total unemployment rate (as in Goldstein et al. 2013) but also by female and youth unemployment rates, as more specific measures of unemployment might capture interesting gender- or age-specific associations.
15The 28 European Union countries: Austria, Belgium, Bulgaria, Croatia, Cyprus, Czech Republic, Denmark,
Estonia, Finland, France, Germany, Greece, Hungary, Ireland, Italy, Latvia, Lithuania, Luxembourg, Malta, Netherlands, Poland, Portugal, Romania, Slovakia, Slovenia, Spain, Sweden, United Kingdom, plus Iceland, Norway, Switzerland, and the United States.
16Except for the analyses of education-specific fertility rates, which are only available for a sufficient number
Second, I include different indicators of economic uncertainty because, as argued before, beyond material hardship, economic insecurity and future financial expectations also play a role in shaping childbearing decisions (Sobotka, Skirbekk, and Philipov 2010; Kreyenfeld, Andersson, and Pailhé 2012; Hofmann and Hohmeyer 2013; Schneider 2015).
The first indicator of uncertainty is market volatility. In the case of Europe, as described above, the main confidence crisis concerned sovereign debt, and a good proxy of market expectations is the trend in government bond yields. The cost of repaying public debt, namely the interest rate to be paid on it, is a powerful measure of the market credibility of a government, which has been severely undermined in Southern European countries during the last three years of sovereign debt crisis. The general feeling of financial insecurity about the future is thus represented by sovereign debt risk, measured through long-term (10 years) government bond yields. This part of the analysis focuses on Europe ‒ and in particular on Southern European countries where the credibility crisis actually materialized17 ‒ because in the United States
long-term government bond yields do not have the same financially informative role vis-a-vis the economy as in Europe.18
The second measure of economic uncertainty I use, more comprehensive in its design, is the annual average of Baker’s (2012) monthly Economic Policy Uncertainty (EPU) Index, described in Section 2.2 and available for the following eight countries: the United States, Ireland, Italy, Germany, France, the United Kingdom, Spain, and the Netherlands.
The last indicator of uncertainty is the consumer confidence index (CCI), a less institutional and more direct barometer of households’ financial expectations, harmonized by the OECD (2017) for 24 of the countries in this sample.
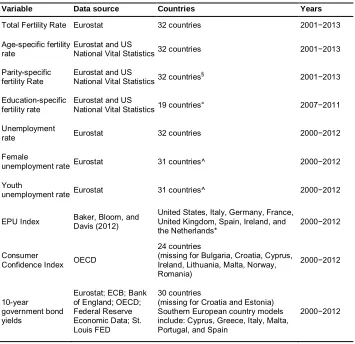
Table 1 summarizes the data sources and country-years availability for each dependent and independent variable included in the analysis.19
17In a previous version of this paper (Comolli 2016) the analysis on sovereign debt risk was conducted on the
entire sample of countries, and the results revealed (as expected) that the increase in public risk was correlated to a substantial decline in fertility only among Southern European countries. In particular, the strongest negative fertility response was registered in Italy and Greece. Results are available upon request.
18First, they are usually countercyclical due to the role of the dollar as a safe currency during economic and
financial crisis and, second, the Federal Reserve more aggressively uses unconventional monetary policy measures to keep sovereign debt interest rates low (IMF World Economic Outlook 2012).
19The caption to Table 1 reports which country years are missing in each variable. Country-year observations
Table 1: Summary of data sources and variables’ country-year availability
Variable Data source Countries Years
Total Fertility Rate Eurostat 32 countries 2001−2013
Age-specific fertility rate
Eurostat and US
National Vital Statistics32 countries 2001−2013
Parity-specific fertility Rate
Eurostat and US
National Vital Statistics32 countries
§ 2001−2013
Education-specific fertility rate
Eurostat and US
National Vital Statistics19 countries° 2007−2011
Unemployment
rate Eurostat 32 countries 2000−2012
Female
unemployment rateEurostat 31 countries^ 2000−2012
Youth
unemployment rateEurostat 31 countries^ 2000−2012
EPU Index Baker, Bloom, andDavis (2012)
United States, Italy, Germany, France, United Kingdom, Spain, Ireland, and the Netherlands*
2000−2012
Consumer
Confidence Index OECD
24 countries
(missing for Bulgaria, Croatia, Cyprus, Ireland, Lithuania, Malta, Norway, Romania)
2000−2012
10-year
government bond yields
Eurostat; ECB; Bank of England; OECD; Federal Reserve Economic Data; St. Louis FED
30 countries
(missing for Croatia and Estonia) Southern European country models include: Cyprus, Greece, Italy, Malta, Portugal, and Spain
2000−2012
Source: Elaboration of the author. Note: a few years per country are missing: 2011−2012 for Belgium, 2003, 2006−2011 for Denmark, 2007−2012 for France, 2001−2008 for Germany, 2001−2007 for Ireland, 2001−2012 for Italy, 2001−2004, 2006 for Malta, and 2003, 2012 for the United Kingdom. ° Data missing for Bulgaria, Cyprus, France, Germany, Iceland, Ireland, Italy, Latvia, Lithuania, Luxembourg, Netherlands, Switzerland, and the United Kingdom. For the United States, education-specific fertility rates are available for the period 2004−2012. ^ Data missing for Switzerland and Iceland in 2000−2002. * Missing for the Netherlands in 2001-2003 and for Spain in 2001.
of the crisis explain variations in the (age-, parity-, education-specific) fertility ratea in country c in year y (TFRc,a,y). All variables are log-transformed to estimate the
association between the recession and fertility in terms of the elasticity of fertility rates to each indicator. Besides the possibility of comparing the results with Goldstein’s paper, there are theoretical reasons for using a log-log model: first, such models allow the smoothing of any non-linearity in the relationship between structural macroeconomic conditions or financial uncertainty and fertility, and, second, they smooth any skewed and nonnormal distribution of the independent variables. Regarding the latter issue, Figure A-3 in the Appendix in fact shows that the density distributions of the independent variables are skewed, while further tests (Q-Q plot, Shapiro-Francia, and Skewness-Kurtosis tests)20 show that the null hypothesis of a normal distribution of
all the independent variables must be rejected.
ln , , = + ln ( _ , ) + + +
∗ + , (1)
As shown in Equation (1), all independent variables are lagged to the previous year
(y-1) and country dummies are included to capture time-constant country specificities that might affect both the economy and fertility. A linear time trend is also added to capture the underlying period fertility trend, associated with the postponement of fertility typical of all low-fertility countries. Finally, the linear time trend is interacted with the country dummies to capture any country-specific time trend.21
Results are shown graphically as much as possible, to facilitate an immediate grasp of the results. Complete regression tables are available in the Appendix to this paper.
The Appendix also reports descriptive statistics of the explanatory variables. Panel (a) of Figure A-4 shows the means and confidence intervals of the unemployment indicators, pooling all 32 countries together. The behavior of the three indicators in the period considered is very similar. Between 2008 and 2013 total unemployment goes from around 6% to more than 10% and variation in the sample largely increases. Female unemployment, similarly, goes from 6.6% in 2008 to 10.55% in 2013 and youth unemployment increases on average from 15% to 20% between 2008 and 2009, peaking at almost 25% in 2013.
20Available upon request.
21 In additional analyses I specifically studied cross-country differences in the correlation between the
Interest rates on public debt in Southern European countries (Panel (b) in Figure A-4) also rose on average after 2009 compared to 2005‒2006 (+4% only between 2007 and 2011). The EPU index also suddenly increased after 2008, more than doubling in 2011 with respect to 2007. In fact, between 2007 and 2011 the index registered a 102% increase. The consumer confidence index declined from 102 points in 2007 to less than 98 in 2009 and then slightly increased, although remaining between 98 and 100 until 2012.
5.2 Results
Figure 8: Elasticity of total fertility rate to unemployment and economic and financial uncertainty measures. All parities and age groups
(a)
(b)
Source: Elaboration of the author based on data from Eurostat, ECB, Bank of England, OECD and Federal Reserve Economic Data (St. Louis FED), US National Vital Statistics and US Treasury. EPU index by Baker, Bloom, and Davis (2012).
Turning to proxies for economic and financial uncertainty (Panel (b) in Figure 8), an increase of 1% in the EPU index is associated with a drop in TFR the next year of around 0.04%. An increase in the index of 50 points would be associated with a decline in TFR of around 0.03 (not shown) – a sizeable effect. Sovereign risk is negatively associated with fertility rates in the restricted sample of Southern European countries but the elasticity is smaller (‒0.025%) and the coefficient is not statistically different from zero. Still, in real terms, for every percentage point increase in long-term government bonds in Southern European countries the average TFR would decline by 0.006.
The strongest fertility response is elicited by consumer confidence, even though estimated confidence intervals are much wider for CCI than for the other indicators. In this and all the following models the inverse of the consumer confidence index (CCI) is included, to show estimates in a comparable direction to other indicators. The negative elasticity of fertility to the CCI has thus to be interpreted as a response to declines in consumer confidence. Namely, a 1% decline in the CCI is associated in this sample with a decline in fertility of around 0.37%. However, this large elasticity has to be compared to the scale of variation of the indicator. The OECD CCI, as mentioned earlier, varies in the crisis period from 101.5 points in 2007 to 98.5 points in 2012. This decline of 3 points would imply, in nonlogarithmic terms, a decline of 0.015 births per woman, which is actually one-third of the decline in fertility implied by the actual rise in unemployment rates in the same period. A similar estimate has been found for the Netherlands (van Giersbergen and de Beer 1997; Fokkema et al. 2008) and Lanzieri (2013) finds a similar correlation between CCI and TFR among 27 European countries.
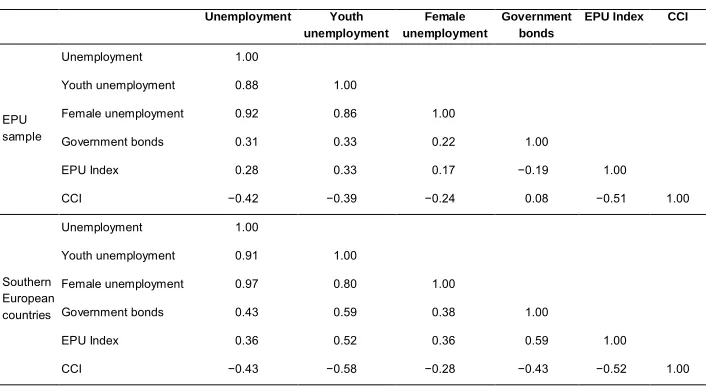
Table 2: Independent variables correlation matrix
Unemployment Youth unemployment
Female unemployment
Government bonds
EPU Index CCI
EPU sample
Unemployment 1.00
Youth unemployment 0.88 1.00
Female unemployment 0.92 0.86 1.00
Government bonds 0.31 0.33 0.22 1.00
EPU Index 0.28 0.33 0.17 −0.19 1.00 CCI −0.42 −0.39 −0.24 0.08 −0.51 1.00
Southern European countries
Unemployment 1.00
Youth unemployment 0.91 1.00
Female unemployment 0.97 0.80 1.00
Government bonds 0.43 0.59 0.38 1.00
EPU Index 0.36 0.52 0.36 0.59 1.00 CCI −0.43 −0.58 −0.28 −0.43 −0.52 1.00
Source: Elaboration of the author based on data from Eurostat, ECB, Bank of England, OECD and Federal Reserve Economic Data (St. Louis FED), US National Vital Statistics and US Treasury. EPU index by Baker, Bloom, and Davis (2012).
Model 5 in Table A-1 shows that, in the complete sample of countries, net of unemployment rate, consumer confidence decline is still associated with a decline in births but the coefficient is much smaller and not statistically significant (‒0.08%). Moreover, looking at measures of information (AIC, BIC), we see that the best models for the complete sample remain those where only unemployment indicators are used. The reasons might be, first, that consumer confidence is correlated to unemployment (around ‒0.4 in the complete sample, as in selected samples, see Table 2) and, second, that the latter is probably more easily comparable across the different countries in the sample (net of state and period fixed effects) than measures of perceived uncertainty. For the United States, for instance, Schneider (2015) finds a persistent effect of CCI beyond state unemployment at the divisional level (and not at national or state level), where probably consumer sentiment better captures the “additional dimension of uncertainty” (Schneider 2015: 1153).
halved controlling for unemployment, but the effect is still present and statistically significant.
Overall, these models show that structural conditions of the economy are strong predictors of fertility rates and strongly comparable across different contexts, while indicators of economic and financial uncertainty are more context-dependent, but nevertheless substantially related to fertility rates.
These estimates are already quite informative, but the consequences of the recession for fertility are likely to be heterogeneous across age groups, parities, and educational levels. These more specific estimates are presented in the next figures.
Figure 9 shows the age-specific fertility rate’s elasticity to unemployment measures (Panel (a)) and economic and financial uncertainty (Panel (b)) (complete results are reported in Table A-2 in the Appendix). The pattern seems very robust to the different indicators used: the largest negative impact of the crisis so far has been on very young women, followed by women in their late thirties. In particular, a 1% increase in unemployment (or youth unemployment) is followed by a drop in fertility of 0.17% for the very young (15‒19-year-old women) and of around 0.1% for women in their twenties (ages 20‒29). The negative fertility reaction is again slightly stronger, at all ages, when female unemployment increases. The negative response to unemployment increases again for 30-year-old women, up to around ‒0.12% for women in their late thirties, and it is smallest for 40‒44-year-old women (‒0.06%). These results are very similar to those obtained by Goldstein et al. (2013), and even slightly larger for women in their twenties and thirties; probably because in many countries the negative effects of the Great Recession materialized later than 2010, the last year analyzed in their paper. These age-specific results are also in line with Schneider (2015), who finds a negative effect of unemployment rates declining with age groups in the United States, and Lanzieri (2013), who finds for Europe an effect of unemployment only for women younger than 30 years of age.
Figure 9: Elasticity of age-specific fertility rate to unemployment and economic and financial uncertainty measures. All parities
(a)
(b)
Source: Elaboration of the author based on data from Eurostat, ECB, Bank of England, OECD and Federal Reserve Economic Data (St. Louis FED), US National Vital Statistics and US Treasury. EPU index by Baker, Bloom, and Davis (2012).
Note: 95% Confidence Intervals reported.
The EPU index (Panel (b) in Figure 9) displays the same tendency of a larger negative response of fertility at younger ages (around ‒0.11% at 15‒19) but, with
-.25 -.2 -.15 -.1 -.05 0 15-1 9 20-2 4 25-2 9 30-3 4 35-3 9 40-4 4 Unemployment -.25 -.2 -.15 -.1 -.05 0 15-1 9 20-2 4 25-2 9 30-3 4 35-3 9 40-4 4 Youth Unemployment -.25 -.2 -.15 -.1 -.05 0 15-1 9 20-2 4 25-2 9 30-3 4 35-3 9 40-4 4 Female Unemployment -.5 -.4 -.3 -.2 -.1 0 .1 .2 .3 .4 .5 15-1 9 20-2 4 25-2 9 30-3 4 35-3 9 40-4 4 EPU Index -.5 -.4 -.3 -.2 -.1 0 .1 .2 .3 .4 .5 15-1 9 20-2 4 25-2 9 30-3 4 35-3 9 40-4 4 Govt Bond Yields
-1.5 -1 -.5 0 .5 1 1.5 15-1 9 20-2 4 25-2 9 30-3 4 35-3 9 40-4 4 Consumer Confidence Index
respect to labor market indicators, it shows a generally smaller association with fertility at older ages (less than ‒0.05% for women older than 25). In Southern European countries, age-specific fertility rates respond significantly negatively to the financial uncertainty generated by the crisis, measured here by sovereign debt risk. The negative elasticity of fertility to financial uncertainty is again largest among very young (15‒24) women. Importantly, in magnitude the negative consequences for births are similar to those of unemployment (and larger below the age of 24). A 1% increase in the long-term price of government debt reduces fertility rates by 0.18% for women in their early twenties. Given the smaller sample, however, the estimates are less precise (but statistically different from zero).22
The age pattern of fertility response to consumer confidence is consistent, even if the elasticity of TFR to CCI is much larger at almost all ages. A decline of 1% in CCI leads to a reduction in teenage fertility of around 0.7%. A similar response is found among women in their 30s, while I find no significant association of fertility with CCI among older women.
Figure 10 reports age- and parity-specific elasticity of fertility rates to female unemployment rate (see Figure A-5 in the Appendix for total and youth unemployment rates and Table A-3 for complete models). The negative elasticity of births to female unemployment is, for all parities, stronger for very young women (around ‒0.2% for 15‒19-year-olds but not statistically significant for third births). However, except for teenager births, the age-specific response to female unemployment (as for youth and total unemployment) is very different across parities. The negative association between female unemployment and first births is similar in magnitude for women in their twenties and thirties (around ‒0.15%) and quite close to zero for women above 40 (not statistically significant). These women are close to the end of their reproductive life and if they are childless and want to have children they are less influenced by employment conditions than younger women. This is not the case for mothers in their late thirties and early forties. The latter in fact postpone second and third births when (female) unemployment rises, with a negative response that in magnitude is similar to or higher than that of younger women. A minor response to unemployment is found among mothers in the age range 20‒29 (especially for third births). These results are again in line with Goldstein et al. (2013), but stronger, especially for young mothers at higher parities, for whom Goldstein et al. did not find any significant fertility response to unemployment.
22 The Variance Inflator Factors (VIF) indicate the presence of multicollinearity between countries’ year
Figure 10: Elasticity of age- and parity-specific fertility rate to female unemployment rate
Source: Elaboration of the author based on data from Eurostat and US National Vital Statistics.
Note: 95% Confidence Intervals reported.
The estimates of the elasticity of age- and parity-specific fertility rates to uncertainty for CCI and sovereign risk are shown in Figure 11. Results on the EPU index by age and parity are substantially and statistically not significant so they are not reported here (see Table A-3 in the Appendix). The age-specific fertility response to declines in consumer confidence is quite different across parities (Panel (a) in Figure 11). Childless women in all age groups, except for women aged 40‒44, postpone childbearing in times of declining confidence, while mothers below 30, both with one or two children, do not significantly respond to changes in consumer confidence. The elasticity of TFR to CCI is significantly different from zero only for mothers in their 30s, for whom, however, the association is substantial: A 1% decline in confidence is associated with a 1% decline in fertility, for both second and third parities.
Figure 11: Elasticity of age-specific and parity-specific fertility rate to consumer confidence index and sovereign risk in Southern European countries
(a)
(b)
Source: Elaboration of the author based on data from Eurostat, ECB, Bank of England, OECD and Federal Reserve Economic Data (St. Louis FED), US National Vital Statistics and US Treasury. EPU index by Baker, Bloom, and Davis (2012).
Note: 95% Confidence Intervals reported.
Finally, another informative comparison to investigate is whether there is a different fertility response across women’s educational levels. Due to sample size restriction, here I only investigate the role of the different measures of unemployment on education-specific fertility rates. (Table A-4 in the Appendix reports the complete models.) Figure 12 shows that the negative association between rising unemployment rates and fertility rates is stronger among middle-educated women, the socioeconomic group that is most affected by business cycle fluctuations in their childbearing choices. Low-educated women are the least likely to respond to growing rates of unemployment: despite their larger probability of being affected by unemployment, their fertility rates do not seem to be affected.
Figure 12: Elasticity of education-specific total fertility rate to unemployment measures, all parities
Source: Elaboration of the author based on data from Eurostat, ECB, Bank of England, OECD and Federal Reserve Economic Data (St. Louis FED), US National Vital Statistics and US Treasury. EPU index by Baker, Bloom, and Davis (2012).
Note:95% Confidence Intervals reported. Low education corresponds to ISCED 0−2; Middles education to ISCED 3−4; High education to ISCED 5−6.
recently, driven mostly by the increasing fertility of highly educated working women. The crisis period is no exception, and highly educated women reduced their fertility rates during the Great Recession in response to increasing female unemployment.
6. Conclusions
The Great Recession hit Europe slightly later than the United States, and for longer, but its financial roots were the same and the consequences for the real economy have been dramatic on both sides of the Atlantic. The Great Recession has been the longest and strongest recession since the Depression of the 1930s and has hit household finances very hard. Economic shocks of this dimension dramatically impact on family dynamics: out of the 32 western countries included in this study, 22 registered a decline in fertility rates between 2008 and 2013. This substantial and diffused decline in fertility happened after a period at the beginning of the century when births had recuperated, and it can hardly be attributed to a general negative trend rather than the economic downturn that hit those same countries. Moreover, analyzing aggregate data in detail, the negative correlation between economic shocks and fertility rates is evident, whether measured by structural economic conditions or indicators of economic uncertainty.
Overall, the findings of this study suggest that the deterioration of labor market structure during the Great Recession is largely responsible for the diffused negative consequences for fertility rates. The sharp increase in unemployment (total, female, and youth) rates characterizing the recession reduced total fertility rates in western economies on average by 0.05 births, a 3% decline from the beginning of the crisis. Importantly, female unemployment seems to be even more strongly (negatively) associated with fertility, suggesting, as already found elsewhere (Ahn and Mira 2002; Rindfuss, Guzzo, and Morgan 2003; Engelhardt and Prskawetz 2004; Engelhardt, Kögel, and Prskawetz 2004), that labor market participation is nowadays important for fertility and women do not take advantage of periods out of the labor market to have children.
The EPU index is a comprehensive indicator that includes both policy uncertainty as perceived by experts and measures of media coverage of economic uncertainty, which is usually a barometer of how private individuals perceive the economic climate. Baker and colleagues (2012) make a specific effort to harmonize the EPU Index to make it comparable across seven different countries, which also makes this indicator interesting for a cross-country study. This does not imply that countries’ specificities should be ignored; rather, the present study should serve as a basis for future country-(or country-cluster) specific investigations. One attempt made in this direction in this paper is to address the fertility response to the sovereign debt risk, as the latter became a distinctive feature of the last phase of the Great Recession in Southern European countries. In fact, the negative response of age-specific TFR to sovereign debt risk in Southern European countries is comparable in magnitude to that of unemployment in the complete sample.
Undoubtedly, the elasticity of fertility rates to these uncertainty indicators is milder and less robust across models than unemployment, but still negative and significant in most model specifications. Nevertheless, net of unemployment’s negative influence on TFR, births are still affected by the rise in economic policy uncertainty. The magnitude of the elasticity to the EPU index is halved when controlling for unemployment, but the correlation is still present and statistically significant. Due to the small sample size and to the high correlation between the uncertainty indicators, I could not test a model where all the indicators are included together with unemployment. However, information measures of model fit, at least in the EPU sample, indicate that the model where both the labor market indicator and the policy uncertainty index are included as explanatory variables better explains fertility rate variation in this period.
The largest negative consequences of the crisis for fertility rates are registered among very young women, 15‒24 years old, while the response is milder for women older than 40. This is especially true for parity one, while, naturally, older women are more likely than their younger counterparts to renounce having a second or third child because of the crisis. Schneider (2015) and Lanzieri (2013) find similar age patterns for the United States and Europe.
The present estimates are stronger than those obtained by Goldstein et al. (2013), especially for the decline in fertility in higher parities and among women in their 30s, because in many countries the negative effects of the Great Recession persisted after 2010. It is thus important to include more recent years in order to grasp the total negative effect of the crisis on childbearing.
Overall, this paper contributes to the literature investigating the correlation between the substantial and diffused decline in fertility, and the Great Recession that has plagued western countries in the last five-to-eight years. Extending Goldstein and colleagues’ (2013) work, first, the study shows that the negative association between unemployment and fertility persists, and has even become stronger in some age and parity groups in recent years. Second, additional indicators show that birth rates react similarly to the perceived uncertainty generated by the recession, over and above the tangible material conditions of the economy.
7. Acknowledgments
The research leading to these results has received funding from the European Union’s Seventh Framework Program (FP7/2007‒2013) under grant agreement no. 320116 for the research project Families and Societies, andfrom the Strategic Research Council of the Academy of Finland (Decision Number: 293103) for the research consortium Tackling Inequality in Time of Austerity (TITA).
I also acknowledge financial support from the Swedish Research Council (Vetenskapsrådet) via the Linnaeus Center for Social Policy and Family Dynamics in Europe (SPaDE), grant registration number 349-2007-8701.
References
Adsera, A. and Menendez, A. (2011). Fertility changes in Latin America in periods of economic uncertainty.Population Studies 65(1): 37−56.doi:10.1080/00324728.
2010.530291.
Ahn, N. and Mira, P. (2002). A note on the changing relationship between fertility and female employment rates in developed countries. Journal of Population Economics 15(4): 667−682.doi:10.1007/s001480100078.
Allison, P.D. (2009).Fixed effects regression models. SAGE publications.doi:10.4135/
9781412993869.
Altman, R.C. (2009). The Great Crash, 2008.Foreign Affairs 88(1): 2–15.
Ananat, E., Gassman-Pines, A., and Gibson-Davis, C.M. (2013). Community-wide job
loss and teenage fertility: evidence from North Carolina.Demography 50(6):
2151−2171.doi:10.3386/w19003.
Baker, S.R., Bloom, N., and Davis, S.J. (2012). Measuring economic policy
uncertainty. Working Paper Series Stanford University.
Becker, G.S. (1960). An economic analysis of fertility. In: Becker, G.S. (ed.).
Demographic and economic change in developed countries. Princeton: Princeton University Press: 209−231.
Black, D., Kolesnikova ,N., Sanders, S., and Taylor, L. (2013). Are children “normal”?
Review of Economic Statistic95(1): 21−33.doi:10.1162/REST_a_00257. Bureau of Labor Statistics (2017). Labor Force Statistics from the Current Population
Survey [electronic resource]. https://www.bls.gov/web/empsit/cpseea02.htm. Butz, W.P. and Ward, M.P. (1979). The emergence of countercyclical U.S. fertility.The
American Economic Review 69(3): 318−328.
Cherlin, A., Cumberworth, E., Morgan, S.P., and Wimer, C. (2013). The effects of the Great Recession on family structure and fertility. The Annals of the American Academy of Political and Social Science 650(1): 214−231. doi:10.1177/00027
16213500643.
Comolli, C.L. and Bernardi, F. (2015). The causal effect of the great recession on
childlessness of white American women. IZA Journal of Labor Economics
4(21): 1−24.doi:10.1186/s40172-015-0037-1.
Currie, J. and Schwandt, H. (2014). Short- and long-term effects of unemployment on fertility. Proceedings of the National Academy of Sciences 111(41): 14734−14739.doi:10.1073/pnas.1408975111.
Dawson, D.A., Meny, D.J., and Ridley, J.C. (1980) Fertility control in the United States before the contraceptive revolution. Family Planning Perspective 12(2): 76−86.
doi:10.2307/2134749.
Dettling, L.J. and Kearney, M.S. (2014). House prices and birth rates: The impact of the real estate market on the decision to have a baby. Journal of Public Economics
110: 82−100.doi:10.1016/j.jpubeco.2013.09.009.
Easterlin, R.A. (1961). The Baby Boom in historical perspective.American Economic Review 51(5): 869−911.
Easterlin, R.A. (1976). The conflict between aspirations and resources.Population and Development Review 2(3/4): 417−425.doi:10.2307/1971619.
Easterlin, R.A. (1980).Birth and fortune. New York: Basic Books.
Elder Jr., G.H. (1974). Children of the Great Depression: Social change in life experience. Chicago: University of Chicago Press.
Engelhardt, H. and Prskawetz, A. (2004). On the changing correlation between fertility and female employment over space and time. European Journal of Population
20(1): 35−62.doi:10.1023/B:EUJP.0000014543.95571.3b.
Engelhardt, H., Kögel, T., and Prskawetz, A. (2004). Fertility and women’s employment reconsidered: a macro-level time-series analysis for developed countries, 1960−2000. Population Studies 58(1): 109−120. doi:10.1080/00324
72032000167715.
Ermisch, J. (1988). Economic influences on birth rates. National Institute Economic Review 126(1): 71−81.doi:10.1177/002795018812600108.
Fokkema, T., de Valk, H., de Beer, J., and van Duin, C. (2008). The Netherlands: Childbearing within the context of a “Poldermodel” society. Demographic Research 19(21): 743−794.doi:10.4054/DemRes.2008.19.21.
Giersbergen, N.P.A. and de Beer, J. (1997). Birthrate and consumer trust: An Econometric Analysis [Geboorteontwikkeling en consumentenvertrouwen: een econometrische analyse].Maandstatistiek van de Bevolking: 23−27.
Goldstein, J., Kreyenfeld, M., Jasilioniene, A., and Orsal, D.K. (2013). Fertility reactions to the Great Recession in Europe: Recent evidence from order-specific data.Demographic Research 29(4): 85−104.doi:10.4054/DemRes.2013.29.4. Hofmann, B. and Hohmeyer, K. (2013). Perceived economic uncertainty and fertility:
Evidence from a labor market reform. Journal of Marriage and Family 75(2): 503−521.doi:10.1111/jomf.12011.
ILO (2013). World of work report 2013: Repairing the economic and social fabric. Geneva: International Labour Office and International Institute for Labour Studies. http://www.ilo.org/wcmsp5/groups/public/---dgreports/---dcomm/ documents/publication/wcms_214476.pdf.
IMF World Economic Outlook (2012). Coping with high debt and sluggish growth. Available athttps://www.imf.org/external/pubs/ft/weo/2012/02/.
Kreyenfeld, M., Andersson, G., and Pailhé, A. (2012). Economic uncertainty and family dynamics in Europe. Demographic Research 27(28): 835−852. doi:10.4054/
DemRes.2012.27.28.
Lanzieri, G. (2013). Towards a ‘baby recession’ in Europe? Differential fertility trends during the economic crisis. Statistics in Focus 13/2013. http://ec.europa.eu/
eurostat/documents/3433488/5585916/KS-SF-13-013-EN.PDF/a812b080-7ede-41a4-97ef-589ee767c581.
Lee, R. (1987). Population dynamics of humans and other animals.Demography 24(4): 443−466.doi:10.2307/2061385.
Lee, R. (1997). Population dynamics: equilibrium, disequilibrium, and consequences of fluctuations. In: Rosenzweig, M. and Stark, O. (eds.). Handbook of Population and Family Economics. Amsterdam: North Holland: 1063−1115. doi:10.1016/
S1574-003X(97)80011-6.
Lee, R. (2003) The Demographic Transition: three centuries of fundamental change.
Journal of Economic Perspectives 17(4): 167−190. doi:10.1257/089533003772
034943.
Lesthaeghe, R. (2010). The unfolding story of the Second Demographic Transition.
Population and Development Review 36(2): 211−251.doi:10.1111/j.1728-4457.
Livingston, G. and Cohn, V. (2010). The new demography of American motherhood. Washington, D.C.: Pew Research Center.
Macunovich, D.J. (1995). The Butz-Ward fertility model in the light of more recent data.The Journal of Human Resources. 30(2): 229−255.
Macunovich, D.J. (1996). Relative income and the price of time: Exploring their effects on US fertility and female labor force participation. Population and Development Review22(Supplement): 223−257.doi:10.2307/2808013.
McDonald, P. (2000a). Gender equity in theories of fertility transition.Population and Development Review 26(3): 427−439.doi:10.1111/j.1728-4457.2000.00427.x. McDonald, P. (2000b). Low fertility in Australia: Evidence, causes, and policy
responses.People and Place 8(2): 6−21.
McDonald, P. (2000c). The toolbox of public policies to impact on fertility: A global view. ANU Research Publications, Working Paper.
Morgan, S.P., Cumberworth, E., and Wimer, C. (2011). The Great Recession’s influence on fertility, marriage, divorce and cohabitation. In: Grusky, D.B., Western, B., and Wimer, C. (eds.). The Great Recession. New York: Russell Sage Foundation: 220−245.
Morgan, S.P., Cumberworth, E., and Wimer, C. (2012).Sheltering the storm: American families in the Great Recession. Stanford: Pathways.
Neels, K. (2010). Economic recession and fertility outcomes: exploring educational differentials in postponement and recuperation of first births in Belgium, France and the Netherlands. Paper presented at the Population Association of America annual meeting, Dallas, Texas, April 15−17.
Neels, K., Theunynck, Z., and Wood, J. (2013). Economic recession and first births in Europe: recession-induced postponement and recuperation of fertility in 14 European countries between 1970 and 2005. International Journal of Public Health 58(1): 43−55.doi:10.1007/s00038-012-0390-9.
OECD (2014). Economic Surveys United States: Overview [electronic resource].
doi:10.1787/eco_surveys-usa-2014-en.
OECD (2017). Consumer confidence index (CCI) (indicator) [electronic resource].
Ozcan, B., Mayer, K.U., and Luedicke, J. (2010). The impact of unemployment on the
transition to parenthood. Demographic Research23(29): 807−846.doi:10.4054/
DemRes.2010.23.29.
Rindfuss, R.R., Guzzo, K., and Morgan, S.P. (2003). The changing institutional context of low fertility. Population Research and Policy Review 22(5): 411−438.
doi:10.1023/B:POPU.0000020877.96401.b3.
Schneider, D. (2015). The Great Recession, fertility, and uncertainty: Evidence from the United States.Journal of Marriage and Family77(5): 1144−1156.doi:10.1111/
jomf.12212.
Sobotka, T., Basten, S., Zeman, K., Abassi-Shavazi, M.J., Adsera, A., Van Bavel, J., and Mills, M. (2013). Future fertility in low fertility countries. Vienna Institute of Demography, Working Paper (5).
Sobotka, T., Skirbekk, V., and Philipov, D. (2010). Economic recession and fertility in the developed world. A literature review. Research Note for the European Commission (Demography Network of the European Observatory on the Social Situation and Demography).
Sobotka, T., Skirbekk, V., and Philipov, D. (2011). Economic Recession and fertility in the developed world. Population and Development Review 37(2): 267−306.
doi:10.1111/j.1728-4457.2011.00411.x.
Wardell, D. (1980). Margaret Sanger: Birth control’s successful revolutionary.
American Journal of Public Health 70(7): 736−742. doi:10.2105/AJPH.70.7.7
Appendix
Figure A-1: Economic policy uncertainty monthly index January 2000 − January 2014
Figure A-2: Consumer confidence index by country 2000−2012
Figure A-3: Density distribution of independent variables and log-transformed distribution
Source: Elaboration of the author based on data from Eurostat, ECB, Bank of England, OECD and Federal Reserve Economic Data (St. Louis FED), US National Vital Statistics and US Treasury. EPU index by Baker, Bloom, and Davis (2012).