The University of San Francisco
USF Scholarship: a digital repository @ Gleeson Library |
Geschke Center
Master's Theses Theses, Dissertations, Capstones and Projects
Spring 5-8-2013
Incentives to Improve Economic Conditions: A
Field Experiment in Medellin, Colombia
Lauren Skora
Follow this and additional works at:https://repository.usfca.edu/thes
Part of theBehavioral Economics Commons,Growth and Development Commons, and the
Other Economics Commons
This Thesis is brought to you for free and open access by the Theses, Dissertations, Capstones and Projects at USF Scholarship: a digital repository @ Gleeson Library | Geschke Center. It has been accepted for inclusion in Master's Theses by an authorized administrator of USF Scholarship: a digital repository @ Gleeson Library | Geschke Center. For more information, please [email protected].
Recommended Citation
Skora, Lauren, "Incentives to Improve Economic Conditions: A Field Experiment in Medellin, Colombia" (2013).Master's Theses. 62.
Incentives to Improve Economic Conditions:
A Field Experiment in Medellín, Colombia
Master’s Thesis
International and Development Economics
JEL Classifications: C93, I380, O12
Key Words: Experimental Economic Methods, Social Welfare Programs, Development
Lauren Skora
Department of Economics University of San Francisco
2130 Fulton Street San Francisco, CA 94117
e-mail: [email protected]
May 8, 2013
Abstract: The motivation for this research is to replicate the Oakland based Family Independence Initiative (FII) and to test the components of this model. The FII program claims its success stems from a bottom-up approach structured around setting life-improving goals, mutual support groups, and small monetary incentives to achieve results. As the popularity of this program continues to gain momentum in the United States, we designed a field experiment to measure the impact of incentives on goal achievement and economic conditions as well as the overall impact of the FII model. We enrolled close to 200 small business owners in four experimental treatments (group, no-group, incentives, no-incentives) and a fifth external control group. The experimental data shows that incentives have the strongest overall impact in improving the likelihood of goal achievement and economic performance. Furthermore, the interaction of goal setting, groups, and incentives has positive significant impacts meaning the full FII program is indeed delivering on its promise to improve people’s economic life: more goals are achieved and monthly sales values are significantly higher than in the other treatment groups. In addition to investigating the effectiveness of incentives and goal setting, our research found that the FII model is replicable in a developing country setting, promising a new potentially successful yet inexpensive way to help people lift themselves out of poverty.
1. Introduction
Development economists continue to investigate why poverty persists in communities when public aid programs are in place to improve economic conditions of its participants. Reasons for this trend could be on an individual as well as community level. With past generations of community members living as public aid recipients, current generations do not see their futures as being any different than their elders’ situation. Therefore, in addition to not having a role model, there is no knowledge of programs available that can serve as guidance to escaping a seemingly predestined poverty path. This limits tapping into more diverse and informative networks, unfortunately, especially since expansive social networks could increase the likelihood of getting a job or important information. The combination of these trends can lead to a poverty trap and the idea that maybe current poverty reduction programs are not best systems to use in improving economic conditions. Clearly there is a need for a system that provides the tools for low-income individuals to take an initiative in their lives and become free from public aid programs. Trying to stimulate motivation can be lost at the policy-making level as the standards for continued support often further discourage an individual or family member to ameliorate their low-income situation (Beaulier & Caplan, 2007). Unfortunately, when policy makers use income stability as a motivator, it can be the exact tool that encourages the culture of poverty to persist (Taylor, Samblanet, & Seale, 2011). Even though programs come from the best intentions, supporting evidence could direct policy to take a different approach by drawing from other fields in order to understand the needs of the recipients.
economic conditions. In addition to the accountability and encouragement of the group, the family-set goals act as initiative to better their economic situation, in line with the capabilities approach. To maintain the emphasis on participant led initiative, the FII liasons provide referrals and technical support only upon request which flows the idea that improving access to these tools can improve self-motivation (Beaulier & Caplan, 2007; Haagh, 2011). As a reward for the initiative and successful achievement, the families earn individual monetary payments starting at $30 and capping at $50. Clearly, the payment cannot replace income but it does provide a salient option to encourage participation in actions that should be done to make life better and avoids the moral hazard issue that crowds out initiative in current public aid programs (Haagh, 2011). Combining these three components, the FII claims significant improvements in levels of savings, home ownership, business activity, and earnings (“Data – Our Results”, 2013). These claims are substantial and powerful as a poverty alleviation model but leads to the question if the successes indicative of the geographical location or if this program applies to all low-income families.
We replicate this revolutionary model in Medellin, Colombia to determine if the successes can be implemented in a developing country. In particular, we assess the extent to which incentives contribute to the program’s (yet to be determined) success. The importance of setting a goal connects the economic focus of this paper to psychology and encompasses the idea of necessary motivation in order to achieve a desired outcome. With the FII Model, though, the social capital aspect of this program garners more emphasis that the rewards for achievement. The effect of incentives should not be discounted as the strength of this mechanism could be the driving force that makes the program a lower cost alternative to other poverty reduction programs. Through replication we test the components of this model in order to provide practitioners tested tools to improve current and future policies.
Anticipating our results, the experimental data shows that incentives are important tools to use in conjunction with goal setting but that combining support groups with small incentives leads to significant improvement in goal achievement levels. We also find that the same combination is effective in improving economic outcomes that further links the importance of the FII Model to its successful claims with a true counterfactual measure.
Section 2 presents a review of the relevant literature. Section 3 offers the testable hypotheses as well as describes our experimental design and survey instruments. Section 4 covers the empirical method used in data analysis and results. Section 5 concludes with a discussion.
2. Review of the Literature
a call in the literature for a more complete and grassroots approach to assistance programs. The components of the model surely are the keys to its success and focusing first on the aspects of goal setting provides a rich literature in psychology that explores the nature and impacts of goal formation. Literature presents a theoretical background to explore and emphasize that “the essence of life is goal-directed action” and when striving for those values stops, life indeed loses meaning (Locke, 2002). Despite the central role goal setting plays in life, and the supposition that motivation ensures achievement, barriers can remain. Psychology literature then merges with topics from economics, health care, management, and education to explain how incentives overcome the barriers to achievement.
Goal Setting Theory
The components of the FII model are powerful yet simple. At the very basis of the model, the participants choose goals to achieve that are meant to improve their household and business lives. A rich literature in psychology has explored the nature and impact of goal formation through goal setting theory. It is centered on the idea that happiness in life is the successful achievement of one’s values however goals and values must coincide with the needs of a person or the result will be self-destruction (Locke, 2002). Goal setting theory emphasizes how a person chooses goals based on difficulty, specificity, feedback, commitment, self-efficacy, knowledge of the task, incentives, personality, and the goal’s affect (Locke, 2002; Hollensbe & Guthrie, 2000; Locke & Latham, 1990).
plethora of fears that can range from fear of change to fear of failure (Locke, 2002). When there is a disconnect between goal setting and achievement, incentives can be used to encourage realignment and motivation when theory does not hold reality to the same standards.
Goals and Incentives
In order to induce a desired outcome from either self-selected or administered goals, usually incentives are involved, as barrier to achievement may be too much for an individual to overcome. Using incentives to encourage behavior is controversial as it can be seen a bribery regardless of the motivation (Kamenetz, 2011). Naturally, the process to appropriate goal setting with effective incentive packages can prove difficult since individuals to not always act as the traditional homo economicus in terms of utility. Reflecting back to psychology literature, if goals are not aligned correctly with an individual’s true needs and values, incentives could be effective to encourage a proper hierarchy. Simply put, incentive levels are chosen based on individual and social utility maximization; however, based on the nature of utility, it is difficult to determine that ideal level accurately and easily (Kerr, et al. 2011). Whether the incentive is based on individual or group achievement, incentives can prove to be effective in ushering people to make socially optimal and rational decisions but reviews are diverse. Narrowing the topic to a development microeconomic sense leads to the question of if the incentive is right, can a person be motivated to achieve a goal that leads to life outside of poverty.
Literature on incentive experiments remains compelling and is full of economic research in a theoretical and empirical sense (Ashraf, Bandiera, & Jack, 2012). The most common incentivized goal setting with individuals can be seen in health literature and spans many disciplines such as management, therapy, and social work. Locke, Bryan, and Kendall (1968) first began expanding this field by their laboratory experiments to prove the hypothesis that there is a correlation between incentives, chosen goals, and self-selected goals. They found that incentives influence the nature of the intentions one develops for a task, may persuade an individual to accept an assigned goal, and affect the degree of commitment to the goal but the incentive effects only occur when goal setting takes place (Locke, Bryan, & Kendall, 1968). Pritchard and Curtis (1973) challenged the methodology with results that large incentives and goal setting led to greater performance levels. Their results failed to confirm the hypothesis that incentives have no effect on performance level outside of their effects on goal setting, which proves why replication is crucial for experiments. Overall, financial incentives should not be substituted for goal setting practices and incentives do adjust performance levels (Pritchard & Curtis, 1973; London & Oldman, 1976).
complete health risk assessments through lottery incentives has a higher impact than direct payment incentives alone. This treatment system is very applicable in policy because it reflects what truly motivates individuals to complete tasks when an incentive of better health is not enough. Research done by Rose and Manley (2011) on incentivized construction procurement contracts yields a surprising result that incentives seem to be less important than the relationship enhancement initiatives of the program. This upholds the idea that financial incentives may not be the most important aspect of goal achievement. Finally, focusing in education literature states that cash incentives to low-income families can be used to adjust how teenagers spend their time and affect their success in school (Morris, et al., 2012). Since the experiments test incentives and goals in an different relationships, like employee-employer and parent-child, an application of incentives with goal achievement through our replication of the FII Model would compliment this literature nicely. To move into pro-social behavior effects in relation to incentives and goals, Kerr et al.’s (2011) experiments on village clean up schemes are presented. Vatn (2009) makes the argument that an incentive will lead to a more selfish outcome rather than a pro-social behavior. However, in studies done in Tanzania and Mexico with individual and community payments for participation in pro-social activities, the results proved the opposite indicating that in certain situations, monetary incentives may not be enough of an incentive to encourage motivation (Kerr et al., 2011). Ashraf, Bandiera, and Jack (2012) expand this topic in Zambia and find that non-financial incentives induced higher performance in the randomly selected subjects than monetary incentives. Although monetary incentives cannot truly be replaced in all incentivized situations, the study shows the importance of analyzing a goal and reward program based on the situation surrounding the aims of motivating agents.
plans so that temporary compliance is avoided. Presenting this view offers more details of how to improve on current goal and incentive policies currently used.
The literature above presents the complex and interesting interaction between goals and incentives from different disciplines. Based on currently published research, there are no experimental results that present the interaction of goals and incentives in relation to development economics programs. A call for research that focuses on the relation between goals and incentives as it relates to poverty alleviation would add significant depth to existing literature and ultimately answer the question of whether the incentives can motivate a person in poverty to achieve financial independence. Using our experimental approach to replicate the FII Model will answer this question in relation to goal achievement and improved economic outcomes.
3. The Experiment
Predictions can be made as to how subjects will respond to the treatments assigned over the course of the program. As mentioned earlier, this research focuses on two components of the FII Model: setting goals and receiving small incentives for achieving goals. Incorporating the impact of the group treatment, an analysis of FII Model can indicate to researchers and policy makers if a similar program could universally be used to encourage individuals to complete tasks for the betterment of their families and businesses. Our experiment sought to test these expected interactions based on theory and the current success of the FII through the four research questions listed below that we test using an experimental approach.
HYPOTHESIS 1: The FII Model, driven by the effect of an incentivized payment structure, will lead to higher levels of
goal achievement. This hypothesis flows from Goal Setting Theory and incentive literature to indicate that it is possible to realign a person’s values by providing the correct level of incentive (Locke, 2002). Ultimately, this hypothesis determines if incentives is the key to success for the FII program and further concludes if it can be replicated.
HYPOTHESIS 2: Setting a goal will lead to higher economic outcomes. Upholding this hypothesis would be
contrary to the findings of Locke, et al. (1968), as it would prove that setting a goal alone correlates with improved performance. This would add to the literature as goal setting alone has not been linked in a development context.
HYPOTHESIS 3: Receiving an incentive for achieving a goal will lead to higher economic outcomes. Incentives
2009).
HYPOTHESIS 4: The interaction of setting a goal, meeting in groups, and receiving an incentivized payment will lead
to higher economic outcomes. Lim’s team written the literature that connects these three topics to a poverty alleviation context be comparing the outcomes of FII families in the United States before and after their participation (Miller, et al., 2004). Without a valid counterfactual, it is uncertain as to the true impact of the model; therefore, this hypothesis will determine if the FII Model’s impacts are replicable outside of the United States and have positive effects on the subjects.
3.1 Site and Subjects
We designed a field experiment based on a 2×2 design involving 4 experimental cells (treatment conditions: no-incentives/no-group; incentives/no-group; no-incentives/group; incentives/group) plus an external control (to be explained below). Shown in Figure 1 is a visualization of the treatments. The experiment was carried out in Medellín, Colombia (population 2.7 million) by a team of graduate students and enumerators in coordination with a local microfinance and development organization called El Banco de los Pobres – El Banco de las Oportunidades or The Bank of the Poor – The Bank of Opportunities, henceforth called The Bank. All of the subjects fit the requirements for receiving a microfinance loan from The Bank in that they are low income residents of Medellín that own their own business and between the ages of 18 to 65. Since The Bank has multiple lending and development opportunities, the potential project participants were recruited from individual lenders that were members of the Artisan and CEDEZO (Los Centros de Desarrollo Empresarial Zonal or Zonal Business Development Center) program. Also included are members of the Solidarity Circle Group Lending Program. This will be important later as this group was assigned to the same treatment to avoid cross talk. Finally, members of a group called Capital Semilla, or Seed Capital, were included that are small business owners that submit unique business ideas to the mayor’s office to receive a grant to continue with the plan. Additional details about recruitment can be found in Appendix B. The baseline recruitment process yielded 138 subjects that we randomly assigned into one of the five experimental groups. The end line control group was recruited using the same methodology to add an additional 21 subjects to give a total sample size of 159 subjects over seven total monthly meetings from June 2012 to December 2012 summing to 1,113 observations. Participation rates are quite high, with only 23 subjects, or 14%, dropping from the program after at least 2 meetings during the project.
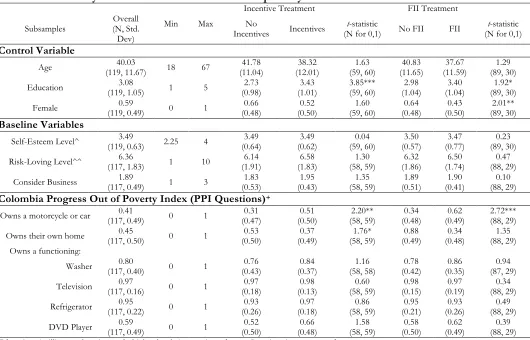
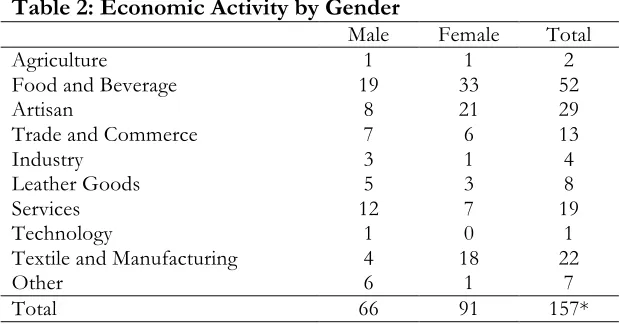
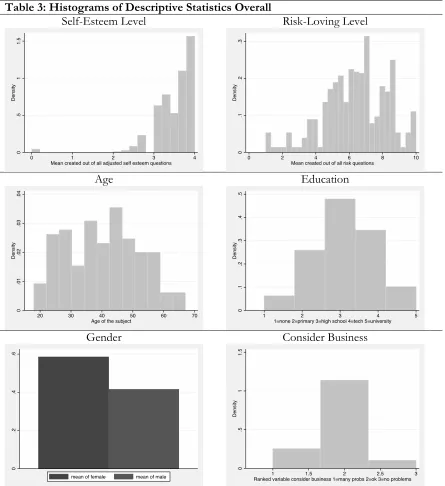
58% of the sample. The most common occupation for the subjects is food and beverage at 33% with the second highest being artisan work at 18% and third being textiles and manufacturing at 14%. Tables 1A and 1B show complete summary statistics by treatment group, economic activity by gender is presented in Table 2, and histograms of the statistics are shown in Table 3. Although randomization creates insignificantly different treatment versus control group (seen in Table 1B in the No Group/Group treatment), it is important to note that among the treatment groups there are some unexpected significant differences that we explore in more detail in robustness checks.
3.2 Experimental Design
Our field experiment consists of three treatments: a control with no manipulators, a treatment to examine the effects of group dynamics, and a treatment to investigate the effects of an incentivized payment structure. Regardless of the group assignment in the project, each subject was randomly assigned three components: setting a goal or not, attending a group meeting or as an individual, and receiving an incentivized payment structure or flat payment. Each of the manipulations is explained below as well as the description of the control and treatment group meetings.
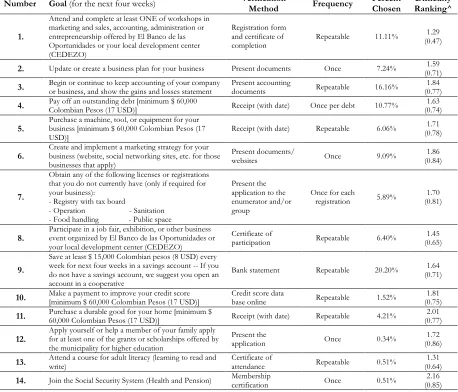
No Goal Set or Setting a Goal. Setting a goal meant that the subject was required to choose one goal to work towards achieving in the four weeks until the next meeting. These goals are listed in Table 4 and include a mixture of business-related and personal goals as well as repeatable and single attempt goals. Based on the answers from preliminary survey questions, the research team chose realistic and desired goals of the participating subjects. For all subjects except members of control Group 1, the subject provided documentation every four weeks to prove that the goal was achieved. The third column of Table 4 presents the documents that were required to verify achievement and the fourth column states if the subject may repeat the goal. The final column indicates percentage of times a goal was chosen out of 594 instances in the duration of the project. The three most common goals chosen were increasing savings, keeping accounting statements for business activities, and attending CEDEZO trainings. The top three goals do not coincide with the goals ranked most difficult which are joining the social health system, purchasing a durable home good, and implementing a marketing strategy. In fact, the three most popular goals have an overall ranking 9th,
4th, and 13th, respectively. Upholding Goal Setting Theory, the subjects confirm that specific and
reasonably difficult goals are important when choosing a goal (London and Oldham, 1976).
offered advice and praise to their fellow member. Group membership did not mean that the group chose a single goal and that all had to achieve it; rather, each member chose a goal and each member was accountable to his achievement when documentation was presented for payment. For the remaining treatments, the surveys were completed without group discussion about their achievement process, which means those subjects did not have to state the chosen goal to anyone other than the enumerators.
Flat Payment or Incentivized Payment Structure. All subjects received payment for attendance, complete surveys, and group participation, if required. Treatment subjects received 5,000 COP (3USD) for the first meeting, as it was an orientation to the program. In the remaining meetings, subjects either received a flat payment or an incentivized payment structure. Compensation values follow in each experimental group description. The level of payment guarantees saliency as well as ensures that average payment was the same between the control and all treatment groups. The incentive served to compensate the subjects for their time completing surveys and, if a member of incentivized payments, to reward subjects for goal achievement. All subjects were required to sign receipts of payment, which enumerators kept in binders organized by group. For all treatment groups, the enumerator wrote the chosen goal for the following four weeks and mark if the goal from the previous month had been achieved after document review. If a subject completed another goal the enumerator marked this and wrote the achieved goal instead. An example of the payment sheets can be seen in Figure 2.
3.3 Description of Treatment Groups
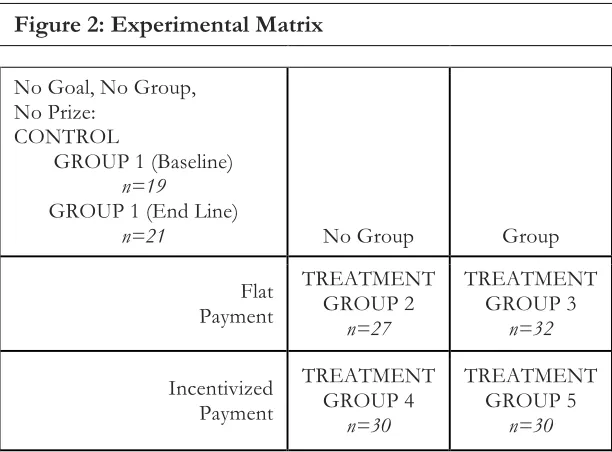
The following sections will describe the details of each group’s rules of participation. The experimental matrix with sample sizes can be found in Figure 2. Appendix C provides the translated rules of the game that were provided to the subjects on the day of the first meeting. The explanations of surveys mentioned follow the description of the experimental groups.
Control Group 1: No Goal, No Group, and Flat Payment. The subjects in the control did not choose a goal, did not have a group meeting, and received a flat payment. Subjects honestly and completely filled out surveys at each meeting held in June, October, and December 2012 in which subjects received a flat payment of 25,000 COP (14USD) as compensation. Meetings for this group involved arriving at the meeting location within a time frame to fill out the required surveys. As previously mentioned, this group contains a baseline and end line control group.
work towards another goal and receive the same payment.
Treatment Group 3: Goal, Group, and Flat Payment. Subjects in treatment Group 3 met every four weeks, chose a goal, and participated in the same flat payment structure of 30,000 COP (17USD) each meeting regardless of achievement. Since these subjects were in a group, the meetings for this group comprised of survey completion with a group meeting. Enumerators began the meeting once all the subjects arrived by asking one subject to stand before the group to start the sharing process. After the meeting, the subjects submitted their goal achievement documents to the enumerator. The solidarity circle mentioned previously, was randomly assigned to this treatment as one unit to avoid contamination of the treatments. Possibly, this interaction among subjects brings an element of additional social capital into this treatment. Enumerators were instructed to keep the meetings focused on survey completion rather than group interaction but t-tests may reflect the interaction of the subjects.
Treatment Group 4: Goal, No Group, and Incentivized Payment. Subjects in treatment Group 4 met every four weeks, chose a goal, and participated in an incentivized payment structure receiving a payment of 35,000 COP (19USD) each meeting based on achievement of their chosen goal. If the subject did not achieve their goal based on documentation provided to the enumerator, the subject received a payment of 5,000 COP (3USD) each meeting. Since these subjects were not in a group, the meetings were solely survey completion with little interaction from other members. Enumerators were instructed to keep the meetings focused on survey completion rather than group interaction.
FII Model Treatment Group 5: Goal, Group, and Incentivized Payment. Subjects in Group 5 met in a group setting every four weeks, chose a goal, and participated in the same incentivized payment structure mentioned in Group 4. Since these subjects were in a group, the meetings comprised of survey completion with a group meeting. Enumerators began the meeting once all the subjects arrived by asking one subject to stand before the group to begin the sharing process.
3.4 Data Collection
documentation and payment process easier.
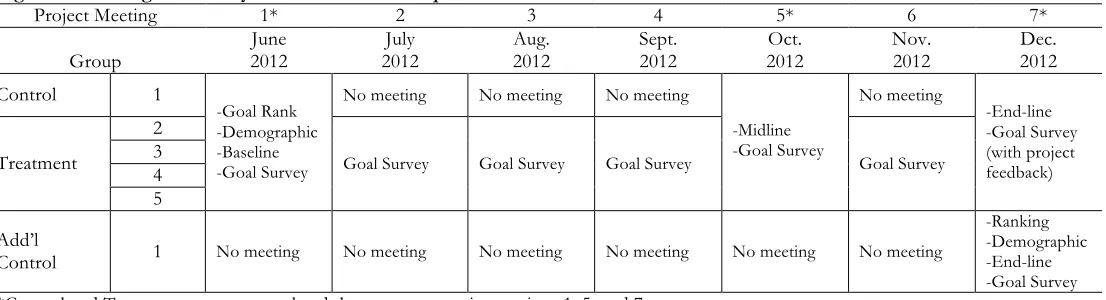
The Goal Rank survey asked the subject to rank each of the goals listed in Table 4 as easy, normal, difficult, or not applicable in relation to the subject achieving the goal. The next surveys, Demographic and Baseline, included detailed demographics and survey questions on household income, success of the business, victimization, migration, self-esteem, risk preferences, reference points, patience levels, and discount rates. Finally, the subjects completed a Goal Survey with goal-related and community involvement questions. This survey also included a question that asked the subject to rank the difficulty of achieving the chosen goal over the previous four weeks.
Out of the three surveys mentioned above, the Baseline and Goal Survey were completed multiple times. The Baseline questions were cut down since a few questions remained constant answers over time (such as migration data). This information was collected at the baseline in June, the meeting in October, and at the last meeting in December. Regardless of the goal setting treatment, the control and treatment groups completed this survey. At every attended meeting, subjects additionally completed the Goal Survey. For the control group, the answers to these questions are based on a recall format that exceeds the treatment group’s recall period of the previous four weeks. In the final meeting, the subjects answered additional questions about the strengths and weaknesses of the program as well as any recommendations for the experiment, the CEDEZOs and The Bank.
4. Results: Do Incentives Matter?
We present two sets of estimations: (1) On the levels of achievement of the treatment groups that set goals, an estimation that allows us to determine the if incentives are effective tools to improve achievement; (2) On the monthly sales values of all participants, in which the results present if the FII Model’s success expands to more than the treatment groups. Based on the randomization of the experiment, we are able to rule out self-selection into treatment and can truly measure the effects of setting a goal with incentivized payment and with the interaction of groups and incentives in this sample of low-income small business owners in Medellín, Colombia. All estimations use time fixed effects, which corrects for serial correlation between observations within the same time period, and standard errors clustered at the individual level, to account for panel structure of the dataset. Overall treatment effects are shown at the individual treatment level, the interaction of all manipulations without controls, and then successfully adding controls.
variable of achievement is a binary value, the linear probability model (LPM) remains a better option in order to take advantage of the simpler standard error structure of the Ordinary Least Squares (OLS) model. Furthermore, interpretation is straightforward and there is no issue of values that exceed the 0 to 1 threshold of appropriate probability values. Equation (1) performs a linear probability estimation of achievement with overall treatment effects of the incentivized payment structure and the FII Model as well as the effects with all controls:
Pr(Achieved=1|Xi)=β0+FIIiβ1+PRZi β2 +GRPi β3 +DIFFit β4 +ESTit β5 +RISKit β6 +T’γ +Xi’β+uit (1) Where dependent variable is a binary outcome of 1 achieving a goal and 0 is not achieving a goal and
β0is the constant term. FIIi, PRZi, and GRPi, are dummy variables with a value of 1 for an i subject randomly placed in the FII Model, Incentive, or Group treatment cells, respectively, for all time periods. DIFFit represents the subject’s classification of difficulty is working towards their goal in each t-2 time period with values starting with 1 being easy and 5 being difficult. The next two variables are created from questions that are considered to have equal weight in terms of explanatory power of self-esteem and the risk preferences of the subjects. ESTitisan index created by calculating the mean of the survey answers concerning self-esteem. The higher the value the more confident an individual i is for time t. RISKitis an index created from the mean of the answers to risk questions included in the survey. The higher the value the more risk-loving an individual i is for time t. The T’ vector represents the time fixed effects with and 0 or 1 value for t-2 periods as the first second
round is the first in achievement data is collected. The vector of controls Xi’ includes age of the participant, highest education level (starting with 1 as illiterate and 5 as university education), and gender (female equals 1). Finally, uit is the random error term. Reviewing the literature, the explanatory variables chosen reflect the determinants of successful completion of a goal (Locke, 2002).
Salesit=β0 +FIIiβ1 +PRZiβ2 +GRPiβ3 +GOALitβ4 +ESTitβ5 +RISKitβ6 +T’γ +Xi’β+uit (2) Where the dependent variable is an ordered response of 1 being the lowest level of sales and 6 being the highest level of sales. FIIi, PRZi, and GRPi remain in theregression with an addition of GOALit to include the control group in the estimation. These variables are 1 if the subject was in the treatment groups and 0 otherwise. DIFFit is removed since this value is only associated with the achievement levels. T’ represents the same vector to time dummies except now it is for t-1 time periods as data on monthly sales is collected at each time period of the study. The remaining variables are ESTit,
RISKit, and Xi’ with the same interpretations as before with Equation (1).
Our experimental design allows us to utilize t-tests for initial impact analysis by comparing the differences in average achievement and average monthly sales per person between treatment groups. The results for each hypothesis test are presented below with t-test results and results of the specifications described in Equations (1) and (2).
HYPOTHESIS 1: Incentives and the FII Model and Goal Achievement
Visually seen in Figure 5, it seems incentives lead to a significant difference between average group achievements as seen in the comparisons of Groups 2 and 3 to Groups 4 and 5. Statistically, t-test results in Table 4 presents significant differences between individual incentive treatment groups to non-incentive treatments all at the 1% level. Recalling that the Solidarity Circle Group was randomly assigned to Group 3, we see that the impacts of the pre-existing social capital does not lead to a significant difference in achievement levels looking the individual t-tests. Table 5 indicates that the average achievement values for subjects is significantly higher for the incentive treatment group comprising of Groups 4 and 5.
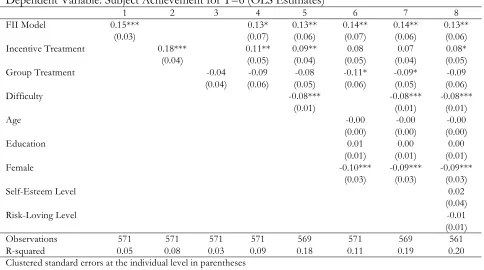
significant effect on the probability of goal achievement at the 5% and 10% level respectively. Most importantly, we see that the FII Model increases the probability of treatment by 13-percentage points on average (mean = 83%).
Interestingly, groups have a negative and significant effect on achievement at the 10% level. Although not the focus of this paper, this could have to do with the fact that the groups are randomly formed and are not able to capture the social capital that exists in the community. The FII Model, though, has a stronger and more significant impact, which overpowers the negative sign of the group treatment further emphasizing the combination of group meetings and incentivized payments leads to successful increases in achievement. The difficulty in achievement results as one reason why subjects are less likely to achieve a chosen goal as it is negative and significant at the 1% level indicating that the more difficult the goal, the probability of achieving the goal decreases by 8-percentage points on average. This finding upholds literature found in goal setting theory (Locke, 2002).
The results of this estimation suggest that the FII Model is replicable in terms of improved probability of achieving goals among the treated subjects. As the goal list is comprised of tasks that could lead to improvement of a subject’s life professionally or personally, the incentive effect could be effectively realigning of goals and needs.
HYPOTHESIS 2: Goal Setting and Economic Outcomes.
To measure the impacts of our experiment with a counterfactual measure of the control group, we look to the impacts of setting a goal on monthly sales levels. As mentioned previously, the control group did not set goals during the program, which means the estimations of impact require a variable that is measurable in both the treatment and control groups. In order to estimate the effects of goal setting, estimations of Equation (2) use the monthly sales index as the dependent variable.
HYPOTHESIS 3: Incentives and Economic Outcomes
Complementing incentive literature, the next specification correlates incentives to poverty alleviation models. Consistent with work that connects incentives to performance, the results state incentives do not increase the level of performance (Kohn, 1993; Ordóñez et al., 2009). As seen in Table 8, the monthly sales index can be compared between groups with the incentive treatment and those without, including the control groups, with t-tests. We see the average monthly sales values per person are not significantly different incentivized payments versus a flat payment (t-statistic=0.56).
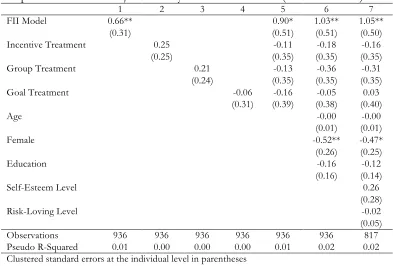
In order to test the implications of improved performance based on the incentive treatment, we use continue to use Equation (2). We first focus on the overall impact of incentives on the monthly sales index. Noting that the coefficient values in this estimation are actual changes in the index compared to the mean monthly sales value, which is 2.64 in index form, which translates to about 525 USD. Therefore, we look for values that would allow us to cross into the higher index value of 3.00 meaning a significant and positive impact would require a coefficient of at least 0.40. Results in Table 9 compliment the t-test values and show an insignificant overall impact of incentives on the monthly sales index. These values do not gain significance with additional controls in Columns 5 through 7. In other words, incentives do not singly lead to differences in monthly sales values when comparing individual experimental groups. The Tobit estimation in Table 9A also shows the same insignificant coefficients.
HYPOTHESIS 4: FII Model and Economic Outcomes
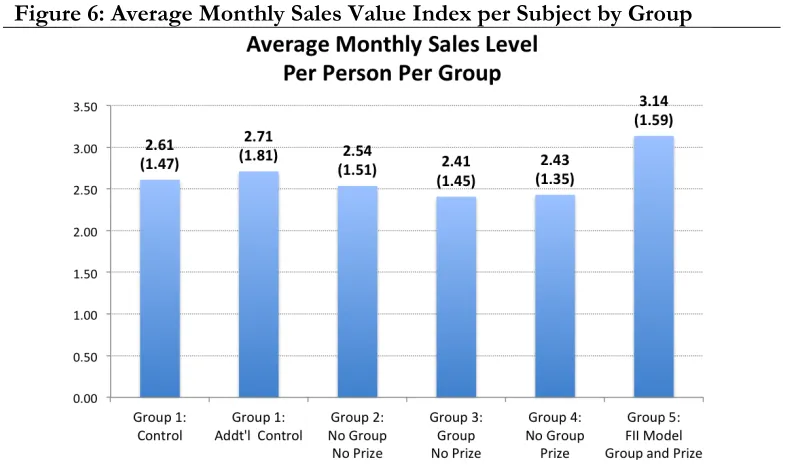
By upholding Hypothesis 1 that the FII Model has a strong significant impact on goal achievement, we want to test the treatment effect among all subjects through the economic outcome measure of monthly sales. Connecting goal setting, group dynamics, and incentivized payment in a poverty alleviation context adds to existing literature in a way that has not been done before with a true counterfactual; therefore, we investigate the treatment effect of the FII model. Testing the mean monthly sales value of the FII Model versus all other experimental groups is shown in Table 8 with significance at the 10% level (t-statistic=1.79). Figure 6 predicts this relationship at the average monthly sales index for Group 5 exceeds the values for all other groups and is confirmed in Table 7.
significance and exceed the required value of 0.40. All controls included in Column 7 yields a positive and significant impact of the FII Model on the monthly sales index a full level, at the 5% level. Table 9A presents a Tobit estimation of Equation (2) with slightly larger but identically significant coefficients indicating robustness of the results.
Although incentives do not lead to the improvement of economic outcomes, the importance of the interaction of goals, groups, and incentives increasing monthly sales values should not go unnoticed. We prove through these results that the FII Model is a successful poverty alleviation model over time with positive impacts on improved sales that exceed the benefits received from the incentive alone. Successful replication of this model in other contexts emphasizes the significance of the combination of goals, groups, and incentives. Namely, the FII Model can be replicated in a developing country with positive results using a measure of improved sales values.
Robustness Checks
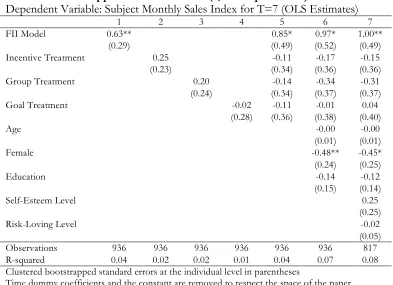
Bootstrapped standard errors are calculated with 1,000 replications for each estimation of Equations (1) and (2) and shown in Tables 10 and 11. The results uphold the same results in both specifications with slightly larger standard error values found in the coefficients in Table 11 leading to the conclusion that the model is robust.
A focus on gender provides interesting results as to the impact of incentives on goal achievement. Estimations of the probability of achievement and the improvement in the sales index value are presented in Tables 12 and 13, respectively. The results show that women have a larger impact from the FII Model and incentives than men on goal achievement. The overall impact of incentives on goal achievement is significant for both men and women but women consistently see stronger and more significant impacts, including all controls. For women, incentives increase the probability of goal achievement by 10% at the 90th percentile (mean=79%) with no increases for
men. These findings enrich the impacts of incentives on goal achievement. Men experience strongly significant and positive overall impacts on sales values as opposed to women who do not have any significant impacts. Additionally, coefficients for the goal treatment are positive and significant for men with an overall impact that leads to a significant increase of 2.73 in the sales value index based on the mean of 2.97. Surprisingly, all coefficients for the incentive and group treatment are largely negative and significant. Based on these results, we can say that women respond more to the FII Model in terms realigning values and needs through the goal setting and achievement process. Men, however, garner more positive effects in economic outcomes due to goal setting and the FII Model as a whole. More research on the impacts of the components of the FII Model in relation to gender would be beneficial and interesting for future research.
education levels since the initial t-tests in Tables 1A and 1B show significant differences for education in the incentive treatments. It could be argued that even though the education levels are different, the subjects still are in a low-income classification with their own business equalizing the effect of education. However, to be clear and to isolate the possible impacts of education differences, use the threshold of greater than an associate’s degree to compare the two groups to indicate which component is most effective for low-income individuals. Looking first to Table 14, clearly incentives are more effective for positive impacts on the probability of goal achievement for individuals with an overall 22-percentage point higher probability of achieving a goal if the subject was in the incentive treatment (mean=87%). Comparing these results to the lower educated individuals, we see that the FII Model yields the most positive success with an overall 21-percentage point increase in the probability of achievement (mean=82%). Interestingly, the results show that subjects with lower education are able to harness the impacts of the FII Model more so than the higher educated individuals, which are driven strongly by the incentives. Continuing to Table 15, significant impacts on sales index values are only seen for higher educated subjects. With all controls, the subjects only see a positive and significant impact from the FII Model resulting, on average, a 1.31 increase that exceed the required 0.50 coefficient requirement (mean=2.47). It could be said that subjects with a higher education have more training in business operations than subjects with a high school education or less. Possibly with more time and replications of this research, more detailed analysis can be performed.
Overall, the robustness checks add more explanation to the reasons for success of the FII Model as well as provide guidance for future research as with additional research and replication, these results can be used by practitioners to ensure success in current and future poverty reduction models.
5. Discussion
the effect of the FII Model itself which is an interaction of all three. Particularly, the effects of incentives as well as the overall effect of the FII Model are the focus for this paper.
Enrolling almost 200 individuals in the program from The Bank, we were able to monitor goal achievement and monthly sales values through survey data. Our predictions are that incentives, setting a goal, and the FII Model would have a positive effect on goal achievement as well as monthly sales values. In order to test these predictions, seven rounds of monthly meetings were held for each group from June 2012 until December 2012.
In our data, incentives increase the probability of goal achievement but not average monthly sales values, setting a goal is not significant overall in improving monthly sales values, and the FII Model hold significance overall and with all controls for both achievement levels and monthly sales. This research fulfills the motivation to test this revolutionary poverty alleviation model with a counterfactual measure as well as determine that incentives are an important component but the combination of goal setting, group meetings, and small monetary rewards is the key to its success.
As with any study, weaknesses do exist in this field experiment such as possible omitted variables and limitations on time. Hopefully, follow-up with the subjects can be done to investigate the long-term effects of their membership with the FII project as running the experiment for six months could lead to temporary effects among the subjects. We feel, though, that the long-term effects could be realized as subjects were overall quite happy with the project and requested that it continue in the future.
References
Ashraf, Nava, Oriana Bandiera, and Kelsey Jack (2011). "No Margin, No Mission? A Field Experiment On Incentives For Pro-Social Tasks," Harvard Business School Division Of Research Working Paper.
Beaulier, Scott Alex, and Bryan Caplan (2007). “Behavioral Economics and Perverse Effects of the Welfare State,” Kyklos, 60 (4), pp. 485-507.
Family Independence Initiative (2011). FII Boston Families: The First Six Months, Oakland: Family Independence Initiative.
Gneezy, Uri, and Aldo Rustichini (2000). "Pay Enough Or Don't Pay At All," Quarterly Journal Of Economics 115 (3), pp. 791-810.
Haagh, Louise (2011). “Working Life, Well-Being and Welfare Reform: Motivation and Institutions Revisited,” World Development, 39 (3), pp. 450-473.
Haisley, Emily, Kevin Volpp, Thomas Pellathy, and George Loewenstein (2012). "The Impact Of Alternative Incentive Schemes On Completion Of Health Risk Assessments," American Journal Of Health Promotion, 26 (3), pp: 184-188.
Hollensbe, Elaine, and James Guthrie (2000). "Group Pay-For-Performance Plans: The Role Of Spontaneous Goal Setting," Academy Of Management Review, 25 (4), pp. 864-872.
Kamenetz, Anya (2011). "Bribing The Poor," Fast Company, 158, pp. 52-53.
Kerr, John, Mamta Vardhan, and Rohit Jindal (2012). "Prosocial Behavior And Incentives: Evidence From Field Experiments In Rural Mexico And Tanzania," Ecological Economics, 73, pp. 220-227.
Kohn, Alfie (1993). "Why Incentive Plans Cannot Work," Harvard Business Review, 71 (5), pp. 54-63. Locke, Edwin (2002). Handbook of Positive Psychology. New York: Oxford University Press.
Locke, Edwin, Judith Bryan, and Lorne Kendall (1968). "Goals And Intentions As Mediators Of The Effects Of Monetary Incentives On Behavior," Journal Of Applied Psychology, 52 (2), pp. 104-121.
Locke, Edwin, and Gary Latham (1990). "Work Motivation and Satisfaction: Light At The End Of The Tunnel," Psychological Science, 1 (4), pp. 240-246.
London, Manuel, and Greg Oldham (1976). "Effects Of Varying Goal Types And Incentive Systems On Performance And Satisfaction," Academy Of Management Journal, 19 (4), pp. 537-546. Miller, Maurice Lim, Marisa Castuera, Michelle Chao, Katherine Sadowksi, & Sadowski, K. (2004).
Pathways Out of Poverty, Early Lessons of the Family Independence Initiative The First Two Years of Operation 2001-2003, Oakland: Family Independence Initiative.
Morris, Pamela, J. Lawrence Aber, Sharon Wolf, and Juliette Berg (2012). Using Incentives to Change How Teenagers Spend Their Time: The Effects of New York City's Conditional Cash Transfer Program, New York: MDRC, pp. 1-159.
Ordóñez, Lisa, Maurice Schweister, Adam Galinsky, Max Bazerman (2009). "Goals Gone Wild: The Systematic Side Effects Of Overprescribing Goal Setting," Academy Of Management Perspectives 23 (1), pp. 6-16.
Rose, Timothy, and Karen Manley (2011). "Motivation Toward Financial Incentive Goals On Construction Projects," Journal Of Business Research, 64 (7), pp. 765-773.
Sen, Amartya (1999). Development As Freedom, New York : Anchor Books.
Appendix A: Tables and Figures
Figure 1: Visual of Treatment
Figure 2: Experimental Matrix
No Goal, No Group, No Prize:
CONTROL
GROUP 1 (Baseline)
n=19
GROUP 1 (End Line)
n=21 No Group Group
Flat Payment
TREATMENT GROUP 2
n=27
TREATMENT GROUP 3
n=32
Incentivized Payment
TREATMENT GROUP 4
n=30
TREATMENT GROUP 5
n=30 Goal
Treatment
Set a Goal
Incentive Treatment
Flat Payment Incentivized Payment
Group Treatment
Individual Meeting Group
Meeting
Do Not Set A Goal
Flat Payment & Individual
Table 1A: Summary Statistics of the Treatment Groups Only
Min Max
Incentive Treatment FII Treatment
Subsamples
Overall (N, Std. Dev)
No
Incentives Incentives (N for 0,1) t-statistic No FII FII (N for 0,1) t-statistic Control Variable
Age (119, 11.67) 40.03 18 67 (11.04) 41.78 (12.01) 38.32 (59, 60) 1.63 (11.65) 40.83 (11.59) 37.67 (89, 30) 1.29
Education (119, 1.05) 3.08 1 5 (0.98) 2.73 (1.01) 3.43 3.85*** (59, 60) (1.04) 2.98 (1.04) 3.40 (89, 30) 1.92*
Female (119, 0.49) 0.59 0 1 (0.48) 0.66 (0.50) 0.52 (59, 60) 1.60 (0.48) 0.64 (0.50) 0.43 (89, 30) 2.01** Baseline Variables
Self-Esteem Level^ (119, 0.63) 3.49 2.25 4 (0.64) 3.49 (0.62) 3.49 (59, 60) 0.04 (0.57) 3.50 (0.77) 3.47 (89, 30) 0.23
Risk-Loving Level^^ (117, 1.83) 6.36 1 10 (1.91) 6.14 (1.83) 6.58 (58, 59) 1.30 (1.86) 6.32 (1.74) 6.50 (88, 29) 0.47
Consider Business (117, 0.49) 1.89 1 3 (0.53) 1.83 (0.43) 1.95 (58, 59) 1.35 (0.51) 1.89 (0.41) 1.90 (88, 29) 0.10 Colombia Progress Out of Poverty Index (PPI Questions)+
Owns a motorcycle or car (117, 0.49) 0.41 0 1 (0.47) 0.31 (0.50) 0.51 (58, 59) 2.20** (0.48) 0.34 (0.49) 0.62 2.72*** (88, 29)
Owns their own home (117, 0.50) 0.45 0 1 (0.50) 0.53 (0.49) 0.37 (58, 59) 1.76* (0.49) 0.88 (0.48) 0.34 (88, 29) 1.35 Owns a functioning:
Washer (117, 0.40) 0.80 0 1 (0.43) 0.76 (0.37) 0.84 (58, 58) 1.16 (0.42) 0.78 (0.35) 0.86 (87, 29) 0.94
Television (117, 0.16) 0.97 0 1 (0.18) 0.97 (0.13) 0.98 (58, 59) 0.60 (0.15) 0.98 (0.19) 0.97 (88, 29) 0.34
Refrigerator (117, 0.22) 0.95 0 1 (0.26) 0.93 (0.18) 0.97 (58, 59) 0.86 (0.21) 0.95 (0.26) 0.93 (88, 29) 0.49
DVD Player (117, 0.49) 0.59 0 1 (0.50) 0.52 (0.48) 0.66 (58, 59) 1.58 (0.50) 0.58 (0.49) 0.62 (88, 29) 0.39 Education: 1=illiterate, 2=primary, 3=high school, 4=associates degree, 5=university or postgraduate
^ Range of 2.25 being low self-esteem to 4 with high self-esteem ^^Range of 1 being most risk averse and 10 being most risk-loving +Information that helps us to describe low-income families in Medellin, Colombia
Table 1B: Summary Statistics for All Subjects
Min Max
Goal Treatment Incentive Treatment FII Treatment
Subsamples (N, Std. Dev) Overall Goal No Goal
t-statistic (N for
0,1)
No
Incentives Incentives
t-statistic (N for
0,1) No FII FII
t-statistic (N for 0,1) Control Variables
Age (159, 11.44) 40.40 18 67 (10.81) 41.53 (11.67) 40.03 (40, 119) 0.71 (10.89) 41.67 (12.10) 38.32 (99, 60) 1.81* (11.36) 41.05 (11.59) 37.67 (129, 30) 1.46 Education (159, 1.00) 3.13 1 5 (0.82) 3.28 (1.05) 3.08 (40, 119) 1.04 (0.95) 2.95 (1.01) 3.43 3.03*** (99, 60) (0.99) 3.07 (1.04) 3.40 (129, 30) 1.64 Female (159, 0.49) 0.58 0 1 (0.50) 0.58 (0.49) 0.59 (40, 119) 0.15 (0.49) 0.63 (0.50) 0.52 (99, 60) 1.36 (0.49) 0.62 (0.50) 0.43 (129, 30) 1.88*
Baseline Variables Self-Esteem Level 3.48
(138, 0.61) 1 4 (0.49) 3.41 (0.63) 3.49 (19, 119) 0.54 (0.61) 3.47 (0.62) 3.49 (78, 60) 0.23 (0.56) 3.48 (0.77) 3.47 (108, 30) 0.12
Risk-Loving Level 6.37
(136, 1.83) 1 10
6.40 (1.91) 6.36 (1.83) 0.09 (19, 117) 6.21 (1.90) 6.58 (1.73) 1.17 (77, 59) 6.33 (1.86) 6.50 (1.74) 0.44 (107, 29)
Consider Business 1.87
(136, 0.50) 1 3 (0.56) 1.74 (0.49) 1.89 (19, 117) 1.23 (0.54) 1.81 (0.43) 1.95 (77, 59) 1.68* (0.52) 1.86 (0.41) 1.90 (107, 29) 0.35
Colombia Progress Out of Poverty Index (PPI Questions)+ Owns motorcycle or
car (136, 0.50) 0.43 0 1 (0.51) 0.58 (0.49) 0.41 (19, 117) 1.38 (0.49) 0.38 (0.50) 0.51 (77, 59) 1.52 (0.49) 0.38 (0.49) 0.62 (107, 29) 2.31** Owns home 0.49
(136, 0.50) 0 1 (0.45) 0.74 (0.50) 0.45 (19, 117) 2.32** (0.50) 0.58 (0.49) 0.37 (77, 59) 2.48** (0.50) 0.53 (0.48) 0.34 (107, 29) 1.80* Owns a functioning:
Washer (135, 0.39) 0.81 0 1 (0.32) 0.89 (0.40) 0.80 (19, 116) 0.96 (0.41) 0.79 (0.37) 0.84 (77, 58) 0.78 (0.37) 0.84 (0.41) 0.79 (74, 61) 0.75 Television (136, 0.15) 0.98 0 1 (0.00) 1.00 (0.16) 0.97 (19, 117) 0.70 (0.16) 0.97 (0.13) 0.98 (77, 59) 0.35 (0.14) 0.98 (0.19) 0.97 (107, 29) 0.51 Refrigerator (135, 0.21) 0.96 0 1 (0.00) 1.00 (0.22) 0.95 (18, 117) 0.98 (0.22) 0.95 (0.18) 0.97 (76, 59) 0.52 (0.19) 0.96 (0.26) 0.93 (106, 29) 0.72 DVD Player (136, 0.49) 0.59 0 1 (0.51) 0.58 (0.49) 0.59 (19, 117) 0.09 (0.50) 0.53 (0.48) 0.66 (77, 59) 1.51 (0.50) 0.58 (0.49) 0.62 (107, 29) 0.40 Education: 1=illiterate, 2=primary, 3=high school, 4=associates degree, 5=university or postgraduate
^ Range of 1 being lowest self-esteem to 4 as highest self-esteem ^^Range of 1 being most risk averse and 10 being most risk-loving +Information that helps us to describe low-income families in Medellin, Colombia
*** Significant at the 1 percent level. ** Significant at the 5 percent level. * Significant at the 10 percent level.
Table 2: Economic Activity by Gender
Male Female Total
Agriculture 1 1 2
Food and Beverage 19 33 52
Artisan 8 21 29
Trade and Commerce 7 6 13
Industry 3 1 4
Leather Goods 5 3 8
Services 12 7 19
Technology 1 0 1
Textile and Manufacturing 4 18 22
Other 6 1 7
Total 66 91 157*
Table 3: Histograms of Descriptive Statistics Overall
Self-Esteem Level Risk-Loving Level
Age Education
Gender Consider Business
0 .5 1 1.5 D e n si ty
0 1 2 3 4
Mean created out of all adjusted self esteem questions
0 .1 .2 .3 D e n si ty
0 2 4 6 8 10
Mean created out of all risk questions
0 .01 .02 .03 .04 D e n si ty
20 30 40 50 60 70
Age of the subject
0 .1 .2 .3 .4 .5 D e n si ty
1 2 3 4 5
1=none 2=primary 3=high school 4=tech 5=university
0
.2
.4
.6
mean of female mean of male
0 .5 1 1.5 D e n si ty
1 1.5 2 2.5 3
Table 4: List of Goals
Number Goal (for the next four weeks) Verification Method Frequency Percent Chosen Ranking^ Difficulty
1.
Attend and complete at least ONE of workshops in marketing and sales, accounting, administration or entrepreneurship offered by El Banco de las Oportunidades or your local development center (CEDEZO)
Registration form and certificate of
completion Repeatable 11.11%
1.29 (0.47)
2. Update or create a business plan for your business Present documents Once 7.24% (0.71) 1.59
3. Begin or continue to keep accounting of your company or business, and show the gains and losses statement Present accounting documents Repeatable 16.16% (0.77) 1.84
4. Pay off an outstanding debt [minimum $ 60,000 Colombian Pesos (17 USD)] Receipt (with date) Once per debt 10.77% (0.74) 1.63
5. Purchase a machine, tool, or equipment for your business [minimum $ 60,000 Colombian Pesos (17 USD)]
Receipt (with date) Repeatable 6.06% (0.78) 1.71
6. Create and implement a marketing strategy for your business (website, social networking sites, etc. for those businesses that apply)
Present documents/
websites Once 9.09% (0.84) 1.86
7.
Obtain any of the following licenses or registrations that you do not currently have (only if required for your business):
- Registry with tax board - Operation - Sanitation - Food handling - Public space
Present the application to the enumerator and/or group
Once for each
registration 5.89% (0.81) 1.70
8. Participate in a job fair, exhibition, or other business event organized by El Banco de las Oportunidades or your local development center (CEDEZO)
Certificate of
participation Repeatable 6.40% (0.65) 1.45
9.
Save at least $ 15,000 Colombian pesos (8 USD) every week for next four weeks in a savings account -- If you do not have a savings account, we suggest you open an account in a cooperative
Bank statement Repeatable 20.20% (0.71) 1.64
10. Make a payment to improve your credit score [minimum $ 60,000 Colombian Pesos (17 USD)] Credit score data base online Repeatable 1.52% (0.75) 1.81
11. Purchase a durable good for your home [minimum $ 60,000 Colombian Pesos (17 USD)] Receipt (with date) Repeatable 4.21% (0.77) 2.01
12. Apply yourself or help a member of your family apply for at least one of the grants or scholarships offered by the municipality for higher education
Present the
application Once 0.34%
1.72 (0.86)
13. Attend a course for adult literacy (learning to read and write) Certificate of attendance Repeatable 0.51% (0.64) 1.31
14. Join the Social Security System (Health and Pension) Membership certification Once 0.51% (0.85) 2.16 ^Difficulty ranking is the mean of the subject difficulty with 1=easy, 2=normal, and 3=difficult. Standard deviation in parenthesis.
Figure 2: Example of Payment and Goal Receipt
*The subjects last name and ID number have been hidden for privacy.
Figure 4: Meeting and Survey Schedule for all Groups
Project Meeting 1* 2 3 4 5* 6 7*
Group 2012 June 2012 July Aug. 2012 Sept. 2012 2012 Oct. Nov. 2012 Dec. 2012 Control 1
-Goal Rank -Demographic -Baseline -Goal Survey
No meeting No meeting No meeting
-Midline -Goal Survey
No meeting
-End-line -Goal Survey (with project feedback) Treatment
2
Goal Survey Goal Survey Goal Survey Goal Survey
3 4 5
Add’l
Control 1 No meeting No meeting No meeting No meeting No meeting No meeting
-Ranking -Demographic -End-line -Goal Survey *Control and Treatment groups completed the same surveys in meetings 1, 5, and 7
Figure 5: Average Achievement Percentage per Subject by Group
*Average percentage was adjusted for meetings attended per subject with standard deviation in parenthesis
Table 4: T-Tests by Group on Average Achievement Per Person Group 2:
No Group No Prize
Group 3: Group No Prize
Group 4: No Group
Prize
Group 5: FII Model
Mean
(Std. Dev.) (0.22) 0.66 (0.23) 0.58 (0.23) 0.70 (0.12) 0.81
Group 2: No Group
No Prize -- 1.01 2.61*** 8.70*** Group 3:
Group
No Prize 1.01 -- 5.52*** 12.96*** Group 4:
No Group
Table 5: Pooled Summary Statistics of Average Achievement
Subsamples Treatment t-statistic FII Model t-statistic
Overall
(N, Std. Dev) Incentives No Incentives (N for 0,1) No FII FII (N for 0,1) Average
Achievement (107, 0.24) 0.83 (0.25) 0.74 (0.20) 0.90 (52, 55) 3.65 (0.26) 0.78 (0.09) 0.95 (79, 28) 3.41
Table 6: Probability of Achievement
Dependent Variable: Subject Achievement for T=6 (OLS Estimates)
1 2 3 4 5 6 7 8
FII Model 0.15*** 0.13* 0.13** 0.14** 0.14** 0.13**
(0.03) (0.07) (0.06) (0.07) (0.06) (0.06)
Incentive Treatment 0.18*** 0.11** 0.09** 0.08 0.07 0.08*
(0.04) (0.05) (0.04) (0.05) (0.04) (0.05)
Group Treatment -0.04 -0.09 -0.08 -0.11* -0.09* -0.09
(0.04) (0.06) (0.05) (0.06) (0.05) (0.06)
Difficulty -0.08*** -0.08*** -0.08***
(0.01) (0.01) (0.01)
Age -0.00 -0.00 -0.00
(0.00) (0.00) (0.00)
Education 0.01 0.00 0.00
(0.01) (0.01) (0.01)
Female -0.10*** -0.09*** -0.09***
(0.03) (0.03) (0.03)
Self-Esteem Level 0.02
(0.04)
Risk-Loving Level -0.01
(0.01)
Observations 571 571 571 571 569 571 569 561
R-squared 0.05 0.08 0.03 0.09 0.18 0.11 0.19 0.20
Clustered standard errors at the individual level in parentheses
Figure 6: Average Monthly Sales Value Index per Subject by Group
*Average monthly sales was adjusted for meetings attended per subject and standard deviations are in parenthesis
Table 7: T-Tests by Group on Average Sales Levels Per Person
Group 1: Control
Group 1: Additional
Control
Group 2: No Group
No Prize
Group 3: Group No Prize
Group 4: No Group
Prize
Group 5: FII Model
Mean
(Std. Dev.) (1.47) 2.61 (1.81) 2.71 (1.51) 2.54 (1.45) 2.41 (1.35) 2.43 (1.59) 3.14
Group 1:
Control -- 0.47 0.42 1.21 1.09 2.85***
Group 1:
Additional Control 0.47 -- 0.89 1.67* 1.55 2.14**
Group 2: No Group
No Prize 0.42 0.89 -- 0.81 0.66 3.47***
Group 3: Group
No Prize 1.21 1.67* 0.81 -- 0.15 4.60***
Group 4: No Group
Prize 1.09 1.55 0.67 0.15 -- 4.44***
Group 5:
FII Model 2.85** 2.14** 3.47*** 4.60*** 4.44*** --
Table 8: Pooled Summary Statistics of Average Monthly Sales
Subsamples Treatment t-statistic Treatment t-statistic FII Model t-statistic Overall
(N, Std. Dev) Goal No Goal (N for 0,1) Incentives No Incentives (N for 0,1) No FII FII (N for 0,1) Average
Monthly Sales
2.70
Table 9: Impacts on Economic Outcomes
Dependent Variable: Subject Monthly Sales Index for T=7 (OLS Estimates)
1 2 3 4 5 6 7
FII Model 0.63** 0.85* 0.97** 1.00**
(0.29) (0.48) (0.49) (0.48)
Incentive Treatment 0.25 -0.11 -0.17 -0.15
(0.23) (0.34) (0.34) (0.34)
Group Treatment 0.20 -0.14 -0.34 -0.31
(0.23) (0.34) (0.34) (0.35)
Goal Treatment -0.02 -0.11 -0.01 0.04
(0.28) (0.37) (0.36) (0.39)
Age -0.00 -0.00
(0.01) (0.01)
Female -0.48** -0.45*
(0.24) (0.24)
Education -0.14 -0.12
(0.15) (0.13)
Self-Esteem Level 0.25
(0.26)
Risk-Loving Level -0.02
(0.05)
Observations 936 936 936 936 936 936 817
R-squared 0.04 0.02 0.02 0.01 0.04 0.07 0.08
Clustered standard errors at the individual level in parentheses
Time dummy coefficients and the constant are removed to respect the space of the paper *** p<0.01, ** p<0.05, * p<0.1
Table 9A: Impacts on Economic Outcomes
Dependent Variable: Subject Monthly Sales Index for T=7 (Tobit Estimates)
1 2 3 4 5 6 7
FII Model 0.66** 0.90* 1.03** 1.05**
(0.31) (0.51) (0.51) (0.50)
Incentive Treatment 0.25 -0.11 -0.18 -0.16
(0.25) (0.35) (0.35) (0.35)
Group Treatment 0.21 -0.13 -0.36 -0.31
(0.24) (0.35) (0.35) (0.35)
Goal Treatment -0.06 -0.16 -0.05 0.03
(0.31) (0.39) (0.38) (0.40)
Age -0.00 -0.00
(0.01) (0.01)
Female -0.52** -0.47*
(0.26) (0.25)
Education -0.16 -0.12
(0.16) (0.14)
Self-Esteem Level 0.26
(0.28)
Risk-Loving Level -0.02
(0.05)
Observations 936 936 936 936 936 936 817
Pseudo R-Squared 0.01 0.00 0.00 0.00 0.01 0.02 0.02
Clustered standard errors at the individual level in parentheses
Table 10: Bootstrapped Standard Errors (1,000 Replications)
Dependent Variable: Subject Achievement for T=6 (OLS Estimates)
1 2 3 4 5 6 7 8
FII Model 0.15*** 0.13* 0.13** 0.14** 0.14** 0.13**
(0.03) (0.07) (0.06) (0.07) (0.06) (0.07)
Incentive Treatment 0.18*** 0.11** 0.09** 0.08 0.07 0.08*
(0.04) (0.05) (0.05) (0.05) (0.05) (0.05)
Group Treatment -0.04 -0.09 -0.08 -0.11* -0.09* -0.09
(0.04) (0.07) (0.05) (0.06) (0.05) (0.06)
Difficulty -0.08*** -0.08*** -0.08***
(0.01) (0.01) (0.01)
Age -0.00 -0.00 -0.00
(0.00) (0.00) (0.00)
Education 0.01 0.00 0.00
(0.02) (0.01) (0.02)
Female -0.10*** -0.09*** -0.09***
(0.03) (0.03) (0.03)
Self-Esteem Level 0.02
(0.04)
Risk-Loving Level -0.01
(0.01)
Observations 571 571 571 571 569 571 569 561
R-squared 0.05 0.08 0.03 0.09 0.18 0.11 0.19 0.20
Clustered bootstrapped standard errors at the individual level in parentheses
Time dummy coefficients and the constant are removed to respect the space of the paper *** p<0.01, ** p<0.05, * p<0.1
Table 11: Bootstrapped Standard Errors (1,000 Replications)
Dependent Variable: Subject Monthly Sales Index for T=7 (OLS Estimates)
1 2 3 4 5 6 7
FII Model 0.63** 0.85* 0.97* 1.00**
(0.29) (0.49) (0.52) (0.49)
Incentive Treatment 0.25 -0.11 -0.17 -0.15
(0.23) (0.34) (0.36) (0.36)
Group Treatment 0.20 -0.14 -0.34 -0.31
(0.24) (0.34) (0.37) (0.37)
Goal Treatment -0.02 -0.11 -0.01 0.04
(0.28) (0.36) (0.38) (0.40)
Age -0.00 -0.00
(0.01) (0.01)
Female -0.48** -0.45*
(0.24) (0.25)
Education -0.14 -0.12
(0.15) (0.14)
Self-Esteem Level 0.25
(0.25)
Risk-Loving Level -0.02
(0.05)
Observations 936 936 936 936 936 936 817
R-squared 0.04 0.02 0.02 0.01 0.04 0.07 0.08
Clustered bootstrapped standard errors at the individual level in parentheses
Table 12: Probability of Achievement by Gender
Dependent Variable: Subject Achievement for T=6 (OLS Estimates)
Female Male
1 2 3 4 5 6 7 8 9 10 11 12 13 14 15 16
FII Model 0.17*** 0.17* 0.18** 0.16* 0.16* 0.16* 0.08** 0.17** 0.16** 0.16** 0.15* 0.14
(0.05) (0.09) (0.08) (0.10) (0.08) (0.08) (0.04) (0.08) (0.07) (0.08) (0.08) (0.08)
Incentive 0.20*** 0.11* 0.09* 0.11* 0.09 0.10* 0.11** -0.02 -0.01 -0.02 -0.01 0.01
Treatment (0.05) (0.06) (0.05) (0.06) (0.06) (0.06) (0.04) (0.06) (0.06) (0.06) (0.06) (0.06)
Group -0.06 -0.13 -0.12* -0.12 -0.10 -0.10 -0.05 -0.14** -0.12* -0.13* -0.12* -0.12*
Treatment (0.06) (0.08) (0.06) (0.08) (0.06) (0.07) (0.04) (0.07) (0.06) (0.07) (0.06) (0.06)
Difficulty -0.10*** -0.10*** -0.10*** -0.04** -0.04** -0.03*
(0.02) (0.02) (0.02) (0.02) (0.02) (0.02)
Age -0.00 -0.00 -0.00 0.00 0.00 0.00
(0.00) (0.00) (0.00) (0.00) (0.00) (0.00)
Education 0.00 0.00 0.00 0.01 0.01 -0.00
(0.02) (0.02) (0.02) (0.02) (0.02) (0.02)
Self-Esteem -0.02 0.09
Level (0.05) (0.06)
Risk-Loving -0.00 -0.01
Level (0.01) (0.01)
Observations 356 356 356 356 354 356 354 351 215 215 215 215 215 215 215 210
R-squared 0.06 0.09 0.04 0.10 0.23 0.11 0.23 0.23 0.04 0.06 0.03 0.07 0.10 0.07 0.10 0.12
Clustered standard errors at the individual level in parentheses