FOR FALL RISKS IN OLDER ADULTS
by Daniel Gragert
A thesis
submitted in partial fulfillment of the requirements for the degree of
Master of Science in Exercise and Sport Studies, Biophysical Studies Boise State University
DEFENSE COMMITTEE AND FINAL READING APPROVALS
of the thesis submitted by
Daniel Gragert
Thesis Title: Validity of a Functional Obstacle Course as a Tool to Screen for Fall-Risks in Older Adults
Date of Final Oral Examination: 06 June 2011
The following individuals read and discussed the thesis submitted by student Daniel Gragert, and they evaluated his presentation and response to questions during the final oral examination. They found that the student passed the final oral examination.
Terry-Ann Gibson, Ph.D. Chair, Supervisory Committee
Yong Gao, Ph.D. Member, Supervisory Committee
Lynda Ransdell, Ph.D. Member, Supervisory Committee
iv ABSTRACT
INTRODUCTION: There is currently no specific instrument or test to diagnose fall risks in older adults. A functional obstacle designed and based on current research and the components of falls has the potential to be an effective method of diagnosing fall risks in older adults. PURPOSE: The purpose of this study was to determine the
construct validity and reliability of the Modified Functional Obstacle Course (MFOC) and to examine the instrument’s intra-obstacle measurement parameters. METHODS: Participants (N = 63) performed a single series of three common fall risk assessments: Activity Specific Balance Confidence Scale; Dynamic Gait Index and the Tinetti Balance Test (ABC, DGI, & TBT); and, the new Modified Functional Obstacle Course (MFOC). The order of tests, per series, was randomized between participants. Participants (N = 30) from the original sample returned for a single day of testing on the MFOC. DATA
v
TABLE OF CONTENTS
ABSTRACT... iv
LIST OF TABLES... ix
LIST OF FIGURES ... x
CHAPTER I: INTRODUCTION... 1
Background of the Problem ... 1
Purpose of the Study ... 4
Need for the Study ... 4
Hypotheses... 6
Limitations ... 6
Delimitations... 6
Operational Definitions... 7
Significance of the Study ... 7
Summary ... 8
CHAPTER II: LITERATURE REVIEW ... 9
Societal Impact of Falls ... 9
The Effects of Ageing on Physical Function ... 10
Balance, Mobility, and Mechanisms Related to Falls... 11
Intrinsic Components ... 11
vi
Interrelationship of Mechanisms (Environmental) ... 16
Fall-Risk Assessments ... 18
Single-Factorial Assessments ... 19
Multi-Factorial Assessments... 20
History of Obstacle Courses in Research Literature... 25
Background on Validity Studies ... 27
Rationale for Creating an Obstacle Course... 28
Summary ... 29
CHAPTER III: METHODS... 30
Participants... 30
Instrumentation ... 31
Modified Functional Obstacle Course (MFOC) ... 31
Activities Specific Balance Scale (ABC) ... 36
Tinetti Balance Test (TBT)... 36
Dynamic Gait Index (DGI) ... 38
Procedures... 39
Session One (First Day of Testing)... 41
Session Two ... 41
Data Analysis ... 42
Summary ... 42
CHAPTER IV: RESULTS AND CONCLUSION ... 43
Descriptive Characteristics ... 43
vii
Tests (ABC, DGI & TBT) ... 44
MFOC ... 45
Hypotheses Testing... 46
Construct Validity of the Modified Functional Obstacle Course ... 46
Reliability... 52
Summary ... 52
CHAPTER V: DISCUSSION... 54
Major Findings... 54
Unique Contributions of the Study ... 64
Limitations ... 66
Suggestions for Future Research ... 67
Conclusion ... 68
REFERENCES ... 69
APPENDIX A... 74
Modified Functional Obstacle Course Scoring... 754 APPENDIX B ... 81
Activities-Specific Balance Confidence Scale (ABC)... 81
APPENDIX C ... 84
Tinetti Balance Test ... 84
APPENDIX D... 87
Dynamic Gait Index Scoring ... 87
APPENDIX E ... 93
viii
ix
LIST OF TABLES
Table 1. Summary of Intrinsic and Extrinsic Mechanisms Related to Falls... 16
Table 2. Summary of fall risk Assessments: Validity, Components Assessed, and Classification... 24
Table 3. Description of Obstacles in Sequential Order... 34
Table 4. Sample Characteristics... 44
Table 5. Performance Scores on ABC, DGI, & TBT ... 45
Table 6. Means for the ABC, DGI, MFOC, and TBT (M ± SD)... 46
Table 7. Pearson Correlation (r)... 47
Table 8. Correlation (r) Between MFOC Performance and Time and ABC, DGI, & TBT factored by gender and fall history... 48
Table 9. Intra-Obstacle Correlation ... 49
Table 10. Rotated Component Matrix... 51
Table 11. Correlation (r) Between Components and Convergent Measures ... 52
Table 12. Comparison of Means et al., and Current Study... 57
x
LIST OF FIGURES
CHAPTER I: INTRODUCTION
Background of the Problem
The post World War II surge of childbirths has created the largest generation of Americans to date. This group, of approximately 76 million people, will become 65 years or older in the year 2015 (Brault, 2007). Unfortunately, the latest report by the Center for Disease Control and Prevention (2008) indicates that one in three adults who are
currently 65 years of age or older have suffered from a fall and the trend is expected to continue. This problem makes falls a central cause of fatality and serious injuries in older adults (Lewell, Vaillancourt, & Sosnoff, 2006). The high rate of falls, coupled with the pending increase in the number of older adults in America, makes diagnosing and treating fall risks a high priority, for both researchers and clinicians. Furthermore, health care costs remain high for the treatment of fall-related injuries (Brault, 2008). This creates a need for individuals who are at risk of falling to receive pre-emptive treatment, in order to avoid the otherwise costly expense of trauma care.
It is common knowledge that aging is associated with a decrease in physical function and performance, including a lack of balance and mobility, which increases the likelihood of an accidental fall (Lexell, Taylor, & Sjostrom, 1998). In addition, aging commonly decreases sensory capabilities, neurological responses, muscular strength and power, and cognitive function; all of which contribute to a higher probability of
degeneration vary from individual to individual, physical degeneration is often
accompanied by cognitive degeneration, which has a substantial effect on the risk of falls (Pfisterer, et al., 2003).
One of the most prevalent and immediate determinants of falling is muscular degeneration (i.e., Senile Sarcopenia). Less common impairments that affect the rate of falls are neuromuscular (proprioceptive) atrophy, cognitive degeneration, ocular, and/or macular degeneration (Lewell, et al., 2006; Sosnoff & Voudrie, 2009). All of these components play a substantial role in maintaining balance and proper gait. For example, muscular strength helps prevent fatigue, which can cause falls. Muscular strength also helps a person maintain proper gait and navigate through environmental hazards. Sensory awareness is central to making observations about the surroundings, so an individual can adjust his, or her, gait or path to avoid falling (Lewell, et al, 2006; Sosnoff & Voudrie, 2009). In addition to the physical causes of falls, the risk of falling is confounded by psycho-social causes (Arnadottir, Lundin-Olson, Gunnardottir & Fisher, 2010). For example, current research has shown a correlation between low balance self-efficacy and increases in falls (Simpson, Worsfold, Fisher & Valentine, 2009).
The interlinking and often varied causes of falls in the elderly make diagnosing fall risks complicated. The complexity is exacerbated by the numerous and varied types of assessment tools to diagnose fall risks. These assessments often test specific individual causes of a fall, as opposed to taking a more holistic approach (Brault, 2008). Each test, or assessment, looks at one aspect, from physical to psycho-social causes of falls. The Tinetti Balance Test (TBT) takes the most comprehensive approach and is the most widely used (Stevens, 2008). The TBT is a series of small functional tests that assess a participant on both balance and gait; however, it does not assess other contributing components (Tinetti, 1986). Other popular tests measure postural sway, using
postugraphical analysis equipment and functional mobility tests that measure muscular strength and performance. There are also various forms of psychological or social tests, such as the Activities Specific Balance Confidence Scale, that measures self-efficacy and self-confidence (Simpson, et al., 2009).
navigate through these obstacles and, thus, measure the sum impact of all possible weaknesses in the necessary components of balance. The functional obstacle course was modified from its original form and has not been validated (Means & O’Sullivan, 2000; Means, 2005).
Purpose of the Study
Given the problem caused by the single dimensional perspective of current fall risk screening instruments, there is a need for a tool that provides a more comprehensive assessment of a person’s risk of falling. A diagnostic tool was created in 1996 by Means, Rodell, and O’Sullivan to tackle this issue. However, after the researchers performed the initial validity studies, they later modified the course design to promote the mobility and safety of the course. The specific tasks, within the course, were not changed, only the arrangement and dimensions were modified (Means & O’Sullivan, 2000; Means, 2005). The modifications, although minimal, have not been validated. For the purpose of this study, the course was further modified to include a new task and to remove a duplicate task. The purpose of this study was to (a) examine the construct validity of the MFOC, by measuring the correlation of the MFOC to current assessments, (b) examine the
reliability, and (c) further determine construct validity and intra-obstacle discrimination via principal component analysis.
Need for the Study
single, unified understanding of fall risks for older adults, research, and diagnostics will be slow and will yield highly varied results. The benefits of creating a single, unified measurement that encompasses all causes, both physiological and psycho-social, include: enabling the academic and professional community to better screen for fall risks and compare normative results through varied populations. The original functional obstacle course has previously been shown to correlate to the Tinetti Balance Test (TBT) (Means, et al., 1996). If a modification of this original course correlates to three assessments that evaluate the function of various fall related components, it will demonstrate that there is a common denominator between these components that can be assessed by a single
diagnostic test.
In order to properly diagnose fall risks, an obstacle course must be sufficient in length, to allow enough time for the observer to note any complications that the
participant may face. The obstacle course must also incorporate truly functional tasks, such as walking up stairs, or on an uneven surface (Ka-chun, et al.,, 2008). It must incorporate a quantitative element that correlates to environmental difficulties, such as how many times a participant needs extra support (e.g, the use of a railing, etc.) (Means, 2005). A functional obstacle course, such as the one created by Means, et al.,(1998) replicates every-day environmental obstacles; thus, it inherently taxes the physiological and psycho-social components that play substantial roles in maintaining healthy balance and mobility.
Hypotheses
The functional obstacle course will show a high and positive correlation to the (a) Tinetti Balance Test, (b) Dynamic Gait Index, (c) Activities Specific Confidence Scale, and demonstrate high test re-test reliability.
Limitations
This study had a relatively small sample size (N = 63) for a validity study. The sample population may not have been a true sample of the intended demographic because a convenience sample was used. The individuals who participated lacked general
diversity of ethnicity. Also, because they were recruited solely from the Boise, Idaho community, it is likely that they were more uniform in their income and education levels.
Delimitations
In order to increase the variation in physical ability and age, participants were recruited from a wide range of locations. Participants were recruited from exercise facilities, senior community centers, independent living retirement facilities, current research studies, and by local physician referrals. Furthermore, participants were required to be: a) over the age of 65, b) free of cognitive impairments, and c) wholly able to complete the study with low risks, as required by the Institutional Review Board of Boise State University.
Operational Definitions
• Fall: When any part of the body involuntarily touches the ground
• Fall-risk: A person who has a high probability of falling within the next six months
• Assessment: Diagnostic tool to determine fall risks
• Test: A trial of an assessment that results in data collection
• Balance: The ability to maintain a static equilibrium, including: standing without postural sway and sitting without swaying or leaning
• Mobility: The ability of a person to move freely in a dynamic and changing environment while maintain safe posture, gait, and balance
Significance of the Study
to only a single source. Furthermore, the current study looked at intra-obstacle discrimination to investigate measurement constructs within the MFOC.
Summary
This chapter outlined the background of the problem and the need and
CHAPTER II: LITERATURE REVIEW
With high and rising medical costs for injuries and the number of fatalities related to falls in older adults, there is a need to have a comprehensive understanding of how to identify those at a high risk of falling. If an older adult can be diagnosed as a fall risk and given preventive treatment, it can potentially cut fatalities, injuries, and reduce the growing burden on the medical system. Unlike several ailments that are common with older adults, predicting and labeling an older adult as a fall risk is difficult because of its broad and multi-factorial aspects. This review will examine: (a) the main components that contribute to fall risks, both intrinsic and extrinsic, (b) common diagnostic methods and (c) why an environmental measurement, such as a functional obstacle course, may be a better means of predicting falls in older adults.
Societal Impact of Falls
A partial reason for the large increase in medical expenses is the large shift in age-related demographics in the United States. A report released by The Centers for Disease Control and Prevention and The Merck Foundation (2007) estimated that by 2030, 20% of the American population will be over the age of 65, with a substantial increase in life expectancy. The average life expectancy for adults in the United States has increased 25% from 65 to 81 years, from 1968 to 2010, respectively (Cohen, 2010). This increase in the percentage of the American population who will be older than 65 years and the increase in life expectancy have created a larger opening for possible fall injuries and fatalities. While medical advancements have increased the average life expectancy of Americans, little has been done to decrease the negative effects of aging on older adults. This has caused an inverse correlation between the increase in life
expectancy and the number of reported accidental falls.
The Effects of Ageing on Physical Function
The effects of aging on the general state of health are well researched, but vary with the individual (Hayes, Wolfe, Truijillo, & Burkell, 2010). There are common ailments that often contribute to an increased risk of falling, including muscular degeneration (i.e, senile sarcopenia). Ageing is correlated to a high degree of loss in muscular density and cross-sectional area (Hayes, et al., 2010). Despite the dramatic onset of sarcopenia, the cause is still not entirely understood. Along with muscular degeneration, aging is also associated with neuromuscular degeneration. This causes a lack of general power within the muscles, which has been shown to be a large
The decline in physical elements such as muscular strength and size, as well as neuromuscular degeneration are often accompanied by a decline in cognitive function, another common result of aging. Often patients with these disorders become easily confused and disoriented, especially in low light, resulting in falls. This issue is exacerbated when it is combined with ocular or macular degeneration (Lewell, et al., 2006, Sosnoff & Voudrie, 2009).
Balance, Mobility, and Mechanisms Related to Falls
The causes of falls have been systematically viewed in relation to balance and mobility. Balance and mobility (or deficiencies therein) are substantial portions of the causes of falls; however, new research has shown a more complex interrelation of varying mechanisms. The exact mechanisms that lead to a high-fall probability,
associated with balance and mobility, in an individual, can be broken into two categories: intrinsic and extrinsic. Intrinsic mechanisms are those components that control the
anatomical factors related to maintaining dynamic balance (vestibular, sensory, and motor) ( Spirduso, Francis, & MacRae, 1995). Intrinsic factors are those that operate outside of the influence of external stimuli. Extrinsic factors are those that have often been termed as risk factors in the environment, or created by the environment. A majority of falls are the result of a combination of intrinsic and extrinsic factors
Intrinsic Components
The physiology of balance consists of several complex but interlinking
system is central to maintaining both static and dynamic balance. Located in the inner ear canal, the vestibular apparatus (the main component of the vestibular system) is a conch shell-shaped organ that detects changes in linear and angular displacement, as well as rate of change (acceleration). This information is sent directly to the central nervous system, in order to trigger pertinent motor programs to avoid losing balance (Highstein, Fay, & Popper, 2004). If a person begins swaying, or otherwise begins to lose balance, the vestibular apparatus (if functioning properly) notifies the CNS, which instantly corrects the problem in order to maintain proper stability (Young & Tolbert, 2007). In many cases, the vestibular apparatus works in conjunction with other sensory organs, such as the ocular system.
The ocular system gathers information about the environment in order to allow immediate changes in an individual’s path or gait pattern. Information gathered for automatic response by the CNS is slightly more complex and works parallel with the vestibulo-ocular reflex (VOR). In VOR, the vestibular apparatus detects changes in angular movement and the individual’s line of sight moves in conjunction with the change (Vaina, Beardsley, & Rushton, 2009).
Both the vestibular and ocular system can be said to gather ex post facto
information, whereas the third component, proprioception, gathers information about the working musculature. Proprioception is the information gathered by mechanoreceptors on the body’s spatial position in order to maintain balance and make movement more
efficient. As it relates to balance and falls, proprioception is broken into three major mechanoreceptors: muscle spindles, golgi tendon organs (GTO’s), and free nerve endings (FNE). Muscle spindles are part of the muscle and are composed of four to six muscle fibers engrossed in a collagenous layer, which send kinetic or kinematic information to the CNS to create immediate information processing in an emergency. In many cases, the CNS sends an action potential to antagonist muscle to contract in order to prevent over lengthening. In the case of balance, the role is to correct any unintentional shifts in muscle activation in order to regain equilibrium (Sosnoff & Voudrie, 2009).
Proprioception is a category within the area of the nervous system. Strength, as a component of balance and mobility, is well understood. Strength is not a mechanism, but the effect of interrelated mechanisms such as muscular characteristics and nerve
Strength, like proprioception, sensory perception, and the vestibular apparatus plays a crucial role in maintaining safe balance. However, as previously mentioned, aging diminishes the efficacy of these systems. It is difficult to predict at what age, or rate, degeneration will occur, only that aging correlates to this degeneration. As biological aging increases, the intrinsic components of balance often decrease ( Spirduso, Francis, & MacRae, 1995).
Thus far, the discussion has covered the four major intrinsic components of balance, the vestibular, ocular, proprioceptive, and muscular systems and how they function and relate to one another. The vestibular apparatus detects changes in temporal position and acceleration and can control line of sight during head rotation, whereas vision also communicates with the CNS through optic flow. However, falls are not exclusively caused by impaired balance, nor by impaired physiological components alone. Interrelated with, or independent of, the above components are the
neurophysiological mechanisms that help individuals process information effectively; this is termed cognitive function.
is most common in older adults, with a high rate of dementia patients institutionalized for fall related injuries (Verghese, Lipton, Hall, Kuslansky, Katz, & Buschke, 2002).
Ageing has been shown to increase the risk of degeneration for all of the above intrinsic components. Ageing decreases sensory capabilities, reflexes, muscular strength and power, and cognitive function, all of which have a substantial effect on the likelihood of a fall (Huan, 2010).
Extrinsic Components
Falls are often attributed to intrinsic factors and in many cases these factors play a significant role. However, falls happen in an open environment that is influenced in part by psycho-social factors and the environment itself. Psycho-social components, as they relate to fall risks, can be defined as the fear of falling, or balance self-efficacy (Bandura, 1986).
Situational specific self-confidence, or self-efficacy, is a complex model that has been shown to play a large role in a variety of behaviors (Bandura, 1986). Among these behaviors, self-efficacy has shown to be a large determinant of fall risks (Arnadottir, et al., 2010; Pang & Eng 2008). A lower level of self-efficacy is linked to increases in falls. In several studies, low self-efficacy was a better determinant than physiological
components at identifying those at a higher risk of falling (Arnadottiret al., 2010; Pang & Eng 2008; Simpson, et al., 2009). Fear of falling (low self-efficacy), diminishes a
person’s ability to safely navigate through environmental obstacles, thus leading to an increase in falls.
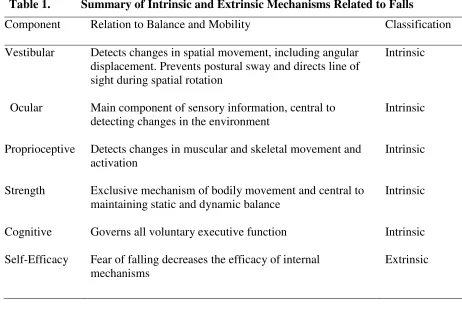
Table 1. Summary of Intrinsic and Extrinsic Mechanisms Related to Falls
Component Relation to Balance and Mobility Classification
Vestibular Detects changes in spatial movement, including angular displacement. Prevents postural sway and directs line of sight during spatial rotation
Intrinsic
Ocular Main component of sensory information, central to detecting changes in the environment
Intrinsic
Proprioceptive Detects changes in muscular and skeletal movement and activation
Intrinsic
Strength Exclusive mechanism of bodily movement and central to maintaining static and dynamic balance
Intrinsic
Cognitive Governs all voluntary executive function Intrinsic Self-Efficacy Fear of falling decreases the efficacy of internal
mechanisms
Extrinsic
Interrelationship of Mechanisms (Environmental)
Unlike the above intrinsic/extrinsic causes of falls, environmental obstacles are an indirect but important consideration when evaluating the likelihood of a fall. A study done by Hitcho et al. (2004) looked at descriptive causes of falls in 183 patients (male = 86, female = 97) in hospital settings. The data were collected from self-report surveys, incident reports filed by nurses, and physician diagnosis. The researchers examined common demographic and physical characteristics as well as the circumstances of the falls. The results showed, as expected, that a majority of the falls (67%) occurred in patients over the age of 60, with no significant difference in gender or reason for the initial hospital stay. The most alarming results were the general lack of correlation in the patient’s demographics and physical characteristics; with the exception of muscle
common illness was the main culprit for the falls and even the high correlation between falls and muscle weakness is questionable due to the extended stay of many of the elderly patients (i.e., extended bed rest causes muscular atrophy and may not be a true indicator of the fall). Half of the patients were fully alert at the time of the fall, while others were confused. Only 30% of the patients were previously labeled as “fall risks.” However, there is an indication that environmental factors played a contributing role.
The most common environmental causes, according to the previous study by Hitcho et al. (2004), were issues with the floor surface and lighting. A majority of the falls that were caused by self-reported “slips” were due to wet surfaces on the floor. Another 8% of the falls were caused by patients trying to avoid obstacles and a total of 30% of the falls occurred in the late hours of the night and in low-light situations. In summary, a total of 74% of falls were caused by environmental factors (not all causes are mentioned here).
In addition to the high rate of falls caused by environmental factors, a high number of the patients had many of the disorders that have been previously deemed as contributors to falls. This could possibly indicate that the physical or mental factors that are associated with falls impede the body’s ability to adapt to changing environmental surfaces and lighting conditions. Despite limited research, current studies have shown a correlation to specific environmental hazards (e.g, low lighting, smooth surfaces, uneven surfaces, stairs) and accidental falls (Gill, Williams, Robinson, & Tinetti, 1999).
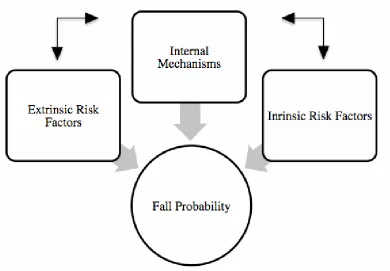
varied and interrelated components. Falls are seldom caused by an exclusive risk factor. Many risk factors do not exist separate from each other, but are influenced by one another. Environmental hazards are directly related to an individual’s ability to
manipulate the environment, while maintaining equilibrium, which is altered by intrinsic factors, as well as self-efficacy and the reciprocal is true for self-efficacy. Figure 1 (below) gives a visual representation of the interrelation of these factors.
Figure 1. Interrelation of Intrinsic and Extrinsic Components of Fall-Risks
Fall-Risk Assessments
approach that considers all contributing components. Research to identify more
comprehensive screening tools to assess fall risks is still in the early stages and is slow to progress because of the complex nature of falls. There are several contributing factors that can cause accidental falls. The exact mechanisms that each assessment targets can be difficult to exegete because of the interrelation between mechanisms, including: the fear of falling (or self-efficacy), which may impede a participant’s ability to perform a variety of diagnostic tests.
There are, however, popular instruments that have attempted to screen for fall risks in the older adult population, including: the Activity Specific Balance Confidence Scale, Dynamic Gait Index, and Tinetti Balance Test. These assessments can often be labeled as multi-factorial, because they measure multiple components; whereas, instruments that target a specific component are labeled single-factorial.
Single-Factorial Assessments
Activity Specific Balance Confidence Scale (ABC)
and normative data, the ABC has been subjected to reliability and construct validity studies and has been shown to have a high test re-test reliability (r = .92) and moderate construct validity when compared to self-efficacy scales, such as the Physical Self-Efficacy Scale (r = .63) (Powell & Myers, 1995). The ABC has not been tested for convergent validity, which would be measured by determining its ability to discriminate against fallers and non-fallers.
The ABC and similar assessment tools are based on the theory that self-efficacy can affect physical performance (Powell & Myers, 1995). There will be more detail on this later in the review, but it is important to note that when examining the determinants of fall risks, they are not limited to physical components. Of course, there are
confounding variables when examining the psychological determinants, because they are often preceded by physical limitations. Most often, older adults who have experienced a fall in the past have a lower self-efficacy than those who have not fallen (Hatch, et al., 2003). For this reason, a low score on the ABC Scale may correlate to a higher risk of accidental falls, but this may be attributed to the physical limitations, or circumstances, that caused the initial fall.
Multi-Factorial Assessments Dynamic Gait Index (DGI)
postrehabilitation participants (Shumway-Cook & Woollacott, 1995). After its inception, however, it was shown as a moderate predictor of future falls in the elderly. This was determined via a convergent validity study. The DGI showed a moderate ability to discriminate between fallers and non-fallers (Shumway-Cook, Baldwin, Polissar, & Gruber, 1997; Whitney, et al., 2000).
In the DGI, a participant is asked to walk for set distances while performing or encountering eight different tasks. The tasks are varied and include activities such as walking while tilting the head. Participants are scored on set categories of gait
modification, with the total score summed at the completion of the test (Shumway-Cook & Woollacott, 1995).
Tinetti Balance Test (TBT)
Modified Functional Obstacle Course (MFOC)
The MFOC consists of 12 activity specific obstacles that are designed to replicate common environmental hazards (Means, et al., 1996). Each obstacle is designed to challenge the physiological and or behavioral components of balance and ambulatory mobility (Means, et al., 1996). There has not been an extensive study, to date, that has reviewed the measurement constructs of each of the obstacles. This makes it difficult to know, conclusively, what mechanisms related to falls are being measured by the
individual obstacles. Five of the stations have varied floor textures. The authors refer to these textures as “floating surfaces” and two more floor surfaces have graded surfaces (an incline and decline). The graded obstacles include stairs (four steps) and a ramp (Means & O’Sullivan 2000). The test also includes opening and closing a door and standing from a chair. The entire course is constructed so that a participant can only complete one task at a time and the order of the obstacles is rigid; the order of the obstacles is the same for all participants. Participants are scored on a quantitative and qualitative scale. The quantitative scale is measured via the time to complete the course and the qualitative score is constructed of the sum of the performance on each of the individual obstacles (with a range of 0-3, per obstacle). See Appendix A for a complete scoring sheet.
The MFOC was originally designed to measure the efficacy of fall risk
interventions and was intended to measure all factors related to falls (Means, et al., 1996). The obstacle course has a moderate to high construct validity (r = .78) in
Table 2. Summary of fall risk Assessments: Validity, Components Assessed, and Classification
1Lewis, 1993
2Gates, Smith, Fisher & Lamb, 2008 3Raiche, Hebert, Prince, Corriveau, 2000 4Whitney, Marchetti, Schade & Wrisley, 2004 5Lajoie & Gallagher, 2004
6Whitney, et al., 2000 Test Inter-rater
Reliability
Test/Re-Test
Reliability Validity Components Assessed Classification
Tinetti
Balance Test * .85 (r)
1 52-73% sensitivity; 2
52% specificity3
Intrinsic: Motor,
Cognitive, Sensory, Vestibular, Strength Multi-Factorial Dynamic
Gait Index 64 (
κ)4 .85 (ICC)5
Χ2=11.27 (p = .0001) (statistically
significant) with a score < 19 compared to scores > 19 6
Intrinsic: Motor,
Cognitive, Vestibular, Strength Multi-Factorial Activity Specific Balance Confidence N/A- Self-report questionnaire
.92 (ICC)5 F(1,123) = 132, p < 0.01 Extrinsic: Self-Efficacy Single-Factorial Modified Functional Obstacle Course * * *
Intrinsic and Extrinsic: Motor, Cognitive, Vestibular, Self –
Efficacy, Environmental
History of Obstacle Courses in Research Literature
Obstacle courses (OC) have been used in a relatively small amount of research studies and only one validation study. All pertinent research was performed by Means, et al. between 1996 and 2005 (Means, Rodell, & O’Sullivan, 1996; Means & O’Sullivan, 1998; Means, 2005). In their initial study, the researchers performed a task-specific validation study. The initial design of their OC and research was to investigate its use at measuring balance and mobility in older adults to determine the quality of fall risk
interventions, and not as a fall risk assessment. Following the original validation study on the OC, it was modified due to initial design flaws that included “difficult to transport,” and “costly.” Both of these factors inhibited the OC from being widely used in clinical practice. Furthermore, the obstacle course over-emphasized “outdoor” fall risk factors (Means, 2005) and did not include a chair sit-to-stand task, which has been highly validated as an activity specific indicator of fall risks (Granacher, et al., 2008). The original course (1996) was built for the specific purpose of aiding in on-site analysis of fall risk interventions. It was not until after the original validation study (Means, Rodell, & O’Sullivan, 1998) that the researchers re-designed the course to be more mobile, and thus increase its clinical applicability. Although the original obstacle course design has gone through a validity study for assessing fall risks for older adults, the modified version of the obstacle course has not been validated.
Obstacle courses have also been used as a research tool in fall prevention
the researchers often included a novel OC as another measurement tool (Shimada & Uchiyama, 2003; Steadman, Donaldson, & Kalra, 2006). These obstacles courses were created by the researchers, and the details of the courses were not published. Despite the prevalence of the OC as an assessment method, there was a general lack of reference to its design or construction. This implies a need for an instrument such as an OC. Thus there is a need for a published layout of a valid and reproducible obstacle course.
In order to use an OC, a screening assessment and properly designed validity study are imperative. In order to determine the construct validity of a course, it must be correlated to the most commonly used assessment tools that are now in place. Because each of the previously mentioned assessments have all been validated to test individual components of balance and mobility and an OC is intended to test the summation of all of these components, if an OC shows a high correlation to the common tests than it can be considered efficacious as a holistic predictor of future falls and in diagnosing “fall risks.”
As previously mentioned, the common fall risk assessments have provided moderate abilities at screening for fall risks. In many cases, this was determined by performing a construct validity study, in which the assessment of interest was correlated to other common assessments (Raiche, et al., 2000; Whitney, et al., 2004)
These assessments, however, may only measure a limited number of fall-related mechanisms. The result is often a one or two-dimensional perspective, which can be beneficial, but often misses the broader multi-dimensional causes of falls. Until research can show definitive and universal causes of falls, looking at single factors (in a multi-factorial disease) will provide poor predictions. Because information is still being
a future fall but, rather, to look at the summation of all impairments in a realistic setting, because falls do not happen in a closed setting, but within a changing and dynamic environment.
Background on Validity Studies
A validity study is an integral part of the research process. Before any instrument can be widely used in either clinical or research purposes, it is important that it has been validated. However, it is worth noting that the qualification for validity can be subject to each practitioner’s standard. The assessments previously mentioned in this review have been tested in two validity paradigms: construct and convergent. In construct validity studies, the assessment of interest is correlated to other assessments that are in current practice and that have been previously validated in a manner to examine whether an assessment measures the construct it purports to measure. For example, a study that has been shown to measure construct A can be used, via correlation, to show that a second assessment measures the same construct. Convergent validity is determined by
comparing the assessments of interest to the “gold standard.” In the case of fall risk screening instruments, this would entail measuring the instruments ability to discern between fallers and non-fallers (Carmines & Zeller, 1979), through a variety of possible methods. In terms of performing fall risk assessments, this would require a follow up after the original testing to measure the frequency of falls in the sample.
Because the assessments are using continuous variables of measurement, Pearson is an adequate form of measuring how well the MFOC compares to the three highest standards of fall risk assessments. Each of these assessments has been validated to assess their target components. A more detailed description of the data analysis procedures is included in Chapter III.
Rationale for Creating an Obstacle Course
A systematic review of current fall risk assessments was performed by Oliver, et al. (2004). They found tests, such as the Activity Specific Balance Confidence Scale, Tinetti Balance Test, etc., examine self-efficacy, postural sway, or other single and exclusive components. However, most falls in the older adult population occur in open and dynamic situations while they are involved with activities of daily living. Currently, many of the conventional instruments used to assess fall risk have limitations, may require substantially expensive equipment, and/or have a narrow scope of focus. These types of assessments lack the pivotal environmental aspect, which may be a more
effective way of identifying older adults who are at risk of falling (Simpson, et al., 2009). A test that examines a single component of falls will continue to provide
practitioners and researchers with a narrow view of this broad and complex issue. A fall risk assessment tool should not only look at the causes of falls, but how those causes limit the body’s ability in novel tasks, as this is where many falls take place.
an OC that involves first standing from a seated position, as well as other obstacles further in the course, tests muscular strength and power. Other tasks such as walking over a slightly uneven surface test cognitive function, because a participant must be aware of the upcoming obstacle to make corrections in gait. This, of course, also tests sensory perception because a participant must be aware of the obstacle before any action begins. It also tests the proprioceptive system. An uneven surface and other related tasks are intrinsically new and novel to the participant and, therefore, negate stored motor programs, forcing the participant to rely on proprioceptive awareness to complete the task (Means, et al., 1996, 1998). These obstacles and others, such as climbing up and down stairs, are designed to be truly functional, because they are tasks that would be completed during everyday activities. For this reason, an OC also tests self-efficacy and balance confidence.
Summary
CHAPTER III: METHODS
This chapter will review the methods used for recruiting study volunteers and provide a detailed explanation of all tests being used. In addition, protocol for the testing sessions and data analysis will be explained.
Participants
Prior to commencing the study, approval was obtained for the use of human subjects from the Institutional Review Board of Boise State University (January 2011). In order to participate, volunteers had to be: (a) ≥ 65 years old, (b) provided a signed
informed consent, (c) given approval to participate by their primary health care provider, (d) free from severe macular and ocular degeneration, and (e) free of substantial cognitive impairments.
A convenience sample of community dwelling participants ≥ 65 years of age were recruited for the study. Volunteer participants were recruited through a variety of
methods. These methods included: (a) flyers, (b) word of mouth, and (c) direct contact by the primary researcher. The primary researcher also visited community and retirement centers, as well as local programs for older adults. Interested participants were contacted by phone or in person by the primary researcher. See Appendix F for a written phone script. Volunteer participants were asked to attend an orientation session, where informed and medical consent documents were distributed. During the initial meeting, in
about all aspects of the study, including: inherent risks, benefits, time requirements, data management, participating research staff, and corresponding credentials. Seventy
participants were sought for the study and a total of 63 older adults completed the study; the lower than expected participation was due to resource limitations, including: limited recruitment material and staff.
Instrumentation
Testing consisted of four separate instruments. Each assessment had different protocols, which are outlined below.
Modified Functional Obstacle Course (MFOC)
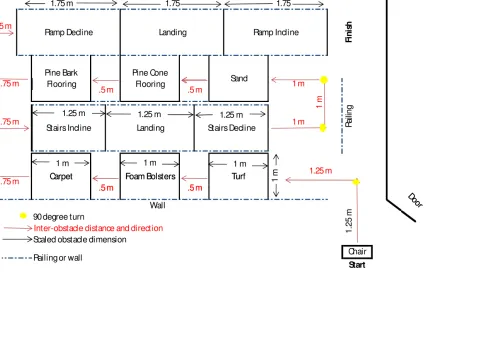
The obstacle course used in the study was originally created and later modified by Means and O’Sullivan (2000). The obstacle course that was modified for this study is primarily the design of the aforementioned authors, with slight alterations (see Table 3 for a complete description of the MFOC). The original authors on the MFOC provided verbal consent to use and modify their initial obstacle course for this study.
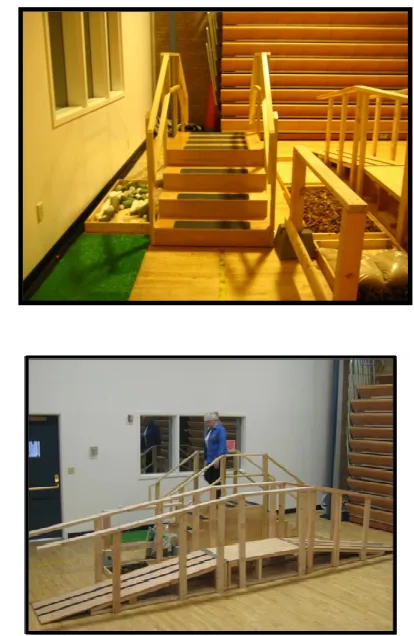
The MFOC has 12 different tasks that are intended to imitate common
One of the tasks required dynamic activity while physically manipulating an object, which was the door opening task. Six of the tasks involved walking over various textures and four required walking up and down stairs and ramps. Figures 2 and 3 illustrate a number of these tasks. Six of the obstacles (chair stand, door opening, foam bolsters, carpet, sand, and up and down ramp) were all placed next to a wall, for safety. The stairs include handrails and the pinecones and pine bark obstacles were on the side of the staircase. The placements of all obstacles were chosen based on the proximity of handrails or walls in order to increase safety and allow for a greater range of analysis. The practitioner did not interact with the participant at any time, unless they asked for assistance. The “performance score” was based on the amount of assistance the
participant needed. For example, if a participant used a handrail to cross an obstacle, that would equate to a lower score than if he, or she, did not need to use the handrail. If the participant requested assistance, the practitioner helped the participant cross an obstacle. However, if assistance was given, the participant received a score of zero for that
particular obstacle.
Table 3. Description of Obstacles in Sequential Order
Number of Obstacle
Title of
Obstacle Description of Obstacle
1 Chair stand
Standard chair: no arm rests, seat 43-46 cm from floor, 20 cm seat length and 100 degree angle from seat base to back support
2 Door
walkthrough Supported and framed door with 6 cm round doorknob 3 Artificial turf Landscaping turf: 50 cm x 100 cm
4 Foam bolsters Cylindrical foam padding 2-6 cm in diameter of varied length; contained in a box 50 cm x 240 cm x 8 cm 5 Carpet task Bulk continuous fiber carpet: 50 x 240 cm
6 Pinecone
flooring
Pinecones of varied shape and dimensions; contained in a box 50 cm x 240 cm x 8 cm
7 Stairs
(incline)
Three step stair complex with each step at 19 cm with a 19 cm rise
8 Stairs
(decline)
Five step stair complex with each step at 19 cm with a 19 cm rise
9 Pine bark
flooring
Pine bark mulch of varied length and dimensions; contained in a box 50 cm x 240 cm x 8 cm
10 Sand box Fine grain s and; contained in a box 50 cm x 240 cm x 8 cm
11 Ramp
(incline) 2.4 meter ramp with a 4.8 degree incline
12 Ramp
W al l .75 m 1 m .75 m 1 m 1 m 1.25 m 1.5 m 1.25 m R ai lin g 1 m 1 m Do or Stairs Decline Landing .5 m .5 m 1.25 m 1 m .75 m .75 m Turf Foam Bolsters Carpet Stairs Incline Ramp Incline Landing Ramp Decline Sand Pine Cone Flooring Pine Bark Flooring F in is h
.5 m .5 m
1.75 1.75
1.75 m
4.5 m
90 degree turn
Scaled obstacle dimension
Inter-obstacle distance and direction
Railing or wall
W al l Wall Start Do or 1 .2 5 m Chair .5 m .5 m Turf Foam Bolsters Carpet
1.25 m 1.25 m 1.25 m
1 m 1 m 1 m
Activities Specific Balance Scale (ABC)
The ABC Scale is a self-report questionnaire where respondents rate their level of self-confidence for performing specific activities in 16 questions (Hatch, Gill-Body, & Portney, 2003). See Appendix B for a complete scoring guide. The questions are scored on as 0-100%, with an average score created from the summed answers. Each of the 16 items is scored on a 0-100% scale, with 100% being fully confident at performing the task without a fear of falling (Myers, Fletcher, Myers, & Sherk, 1998). The ABC scale has been validated, and demonstrated acceptable test re-test reliability (r = .92) (Powell and Myers, 1995). The ABC Scale has been validated for several populations including older adults (Lajoie & Gallagher, 2004). Other than the paper questionnaire, no extra equipment was required.
Tinetti Balance Test (TBT)
The TBT is a simple qualitative assessment tool that does not require any equipment. An administrator scores the participant on a scale of 0-2 on 14 tasks that are broken into static balance and gait. The total scores are summed to make the complete score (Tinetti, 1986). Despite the qualitative nature of the assessment, it has high reliability (r = .85) (Lewis, 1993).
Balance tests
Sitting balance. The participant sits in a hard, armless chair for thirty seconds, while the researcher observes the participant’s balance.
Rises from a chair. The task measures the participant’s ability to stand from a chair unassisted.
Immediate standing balance. The practitioner observes the participants balance during the first five seconds after standing from the chair.
Nudged. The practitioner gently “nudges” the participant in his or her sternum and observes the participant’s ability to maintain balance.
Eyes closed. The practitioner observes the participant stand (static) with both feet on the floor, for 20 seconds with eyes closed.
Turn 360 degrees. Without deviating from a given space, the participant must make one complete circle.
Sitting down. The participant moves into a standard chair and completes the task at ≈ 90 degree knee flexion.
Gait Tests
Dynamic Gait Index (DGI)
The DGI is an eight-item assessment tool that assesses a participant’s gait during task-oriented activities: such as, 180-degree pivot, vertical and horizontal head turns, and walking up steps. The DGI requires a participant to perform eight functional tasks that require gait alterations. Each task on the index is scored on an ordinal scale of 0-3, with a maximum final score of 24. The test takes approximately 15 minutes to complete. This DGI has been validated as a measurement tool for fall risks (Chiu, 2006). The practitioner does not interact with the participant, other than to observe and measure the volunteer’s performance. For a complete description and score form of the DGI, see Appendix D. The order of the tests is as follows:
Gait on Level Surfaces
The participant walks from the starting position to the next mark (20 feet). There is not a particular obstacle during this portion of the test.
Change in Gait Speed
The participant walks on a level surface for five feet and then increases speed to his/her fastest possible walk. After five feet, the participant slows back down to a normal gait speed.
Gait with Horizontal Head Turns
Gait with Vertical Head Turns
This portion is identical to the “gait with horizontal head turns.” However, instead of changing looking left or right, the participant is asked to look up and down.
Gait and Pivot Turn
The participant begins walking on a level surface and the practitioner asks the participant to pivot 90 degrees, in any direction. Scoring is based off the time it takes to complete the full pivot.
Step Over Obstacle
The participant walks five feet to an eight-inch box. Without touching the box, the participant must step over the box and continue walking for another five feet.
Step Around Obstacles
The participant must make a figure eight around two cones placed six feet apart.
Stairs
The participant begins at the bottom of a standard set of stairs (8*8) and walks up five steps, then turns and walks back down. For this study, a modality staircase was used and participants did not need to complete a turn, but were able to walk in a continuous path.
Procedures
reliability, and (c) further determine construct validity and intra-obstacle discrimination via principal component analysis.
Several parameters for testing were incorporated to ensure strong data validity and decrease risks for the participants. The construction of the obstacle course was tested through a pilot study (N = 10) with participants prior to IRB approval. This was to ensure that the quality of each obstacle was safe for participants and to verify and practice the scoring system for each individual assessment before official testing began.
During the pilot study and testing, participants wore a four-inch wide gait belt and were closely followed by a researcher. The primary researcher, who was present during all testing, was certified in CPR and First Aid through the American Red Cross and had an EMT basic license and had extensive experience working with older adults in similar settings. The pilot testing was successful. Shortly after the pilot testing, IRB approval was obtained and participant recruitment began.
Testing was only performed by participants who had obtained a medical consent to participate, which had to be completed by the participant’s primary care physician. The medical consent forms limited participants who may be at a substantial risk of falling, or injury due the physical nature of the assessments. Participants were notified that participation in the study was voluntary and they could withdraw at any time and for any reason.
participate) were distributed at this time and anthropometric data (weight and height) was recorded and the participant’s fall history was obtained (via self-report questionnaire). Testing schedules were also chosen at this time. The purpose of the first meeting was to provide all participants with the necessary information and documentation to ensure they were fully informed of the inherent risks of the study and what type of activity and commitment would be required.
Session One (First Day of Testing)
Two participants arrived at a time and began by performing the ABC. Participants were not told the sequence of the assessments before they were performed and the order in which the assessments were performed was randomized between participants. Each assessment took approximately 10-15 minutes to complete. With the exception of the ABC, one participant performed an assessment while the other rested in an outside waiting area. The total time for testing was approximately 45 minutes per two
participants. A total of 63 participants completed this portion of the testing. The first 45 participants to complete the study were asked if they would like to return for a second session, and of the 45, a total of 30 participants agreed to return.
Session Two
Data Analysis
The information gathered from the second session MFOC testing was used to determine test re-test reliability of the instrument. Pearson correlation was be used to determine the correlation between all three assessments (ABC, TBT, & DGI) and the MFOC. Cronbach’s Alpha was used to determine the internal consistency of the MFOC.
Exploratory factor analysis was also performed, using principal component extraction. Kaiser’s criterion was used to determine significant component, and Varimax rotation was used to determine factor loading. All analysis was performed with SPSS 19 (SPSS, Inc., Chicago IL).
Summary
This chapter explained the procedures that were used to recruit participants and the procedures that were used to complete the study. In addition, the safety protocol was discussed. Testing procedures were described along with how the data was to be
CHAPTER IV: RESULTS AND CONCLUSION
The purpose of this study was to determine the construct validity and reliability of a Modified Functional Obstacle Course (MFOC). The MFOC was compared to three assessments that are currently being used in the clinical setting to screen for fall risks in older adults. The assessments are the Activity Specific Balance Confidence Scale (ABC), Dynamic Gait Index (DGI), and the Tinetti Balance Test (TBT). This chapter provides descriptive information and the results from the data analysis.
Descriptive Characteristics
Participants
A total of 63 participants completed the study and were recruited from seven community sites in the Boise, ID area, including a local physician’s clinic, fitness
gender had no effect on BMI or fall history and age was not related to BMI or fall history.
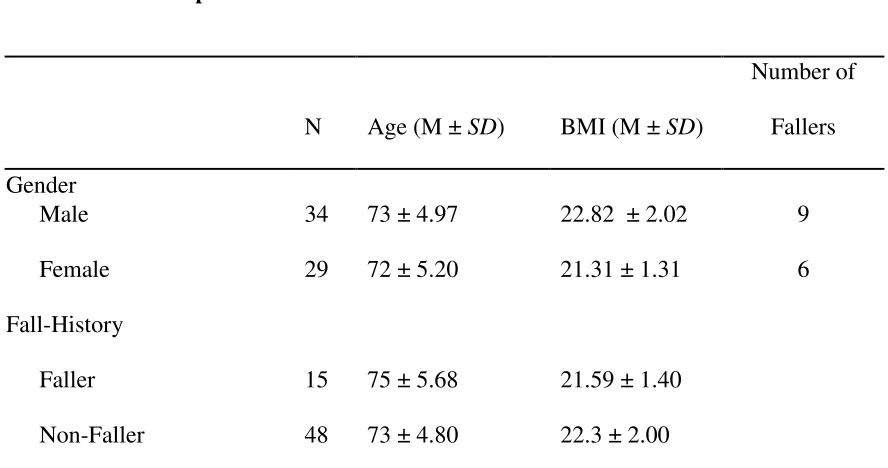
Table 4. Sample Characteristics
N Age (M ± SD) BMI (M ± SD)
Number of Fallers Gender
Male 34 73 ± 4.97 22.82 ± 2.02 9
Female 29 72 ± 5.20 21.31 ± 1.31 6
Fall-History
Faller 15 75 ± 5.68 21.59 ± 1.40
Non-Faller 48 73 ± 4.80 22.3 ± 2.00
Note. Gender was not related to age, BMI, or fall history (p > .05) and fall history was not related to BMI (p > .05).
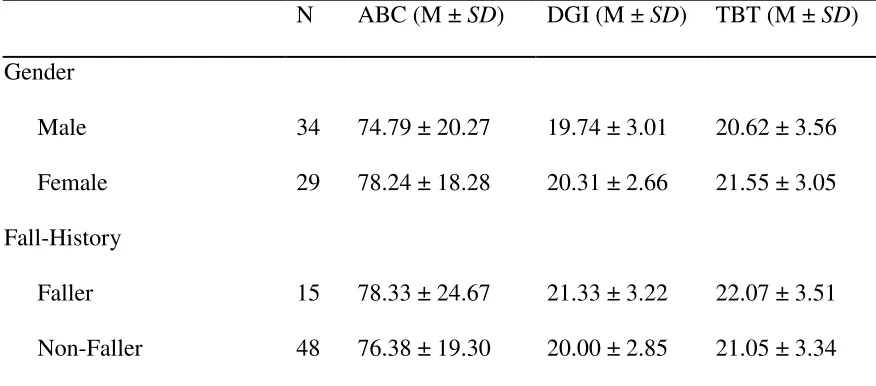
Tests (ABC, DGI, & TBT)
Table 5. Performance Scores on ABC, DGI, & TBT
N ABC (M ± SD) DGI (M ± SD) TBT (M ± SD)
Gender
Male 34 74.79 ± 20.27 19.74 ± 3.01 20.62 ± 3.56
Female 29 78.24 ± 18.28 20.31 ± 2.66 21.55 ± 3.05 Fall-History
Faller 15 78.33 ± 24.67 21.33 ± 3.22 22.07 ± 3.51 Non-Faller 48 76.38 ± 19.30 20.00 ± 2.85 21.05 ± 3.34 Note. Gender was not related to age, BMI, or fall history (p > .05) and fall history was not related to BMI (p > .05).
MFOC
The MFOC is broken into two independent scores: performance and time. The mean for the performance score of the MFOC was 29.95 (SD = 4.05). Gender did not have a significant effect on the performance score (t(61) = -.99, p = .32) and neither did fall history (t(61) = .08, p = .93). There was a low-to-moderate correlation between MFOC performance and BMI ( r(63) = .27, p < .05) and a lower correlation between MFOC and age (r(63) = .16, p = .20).
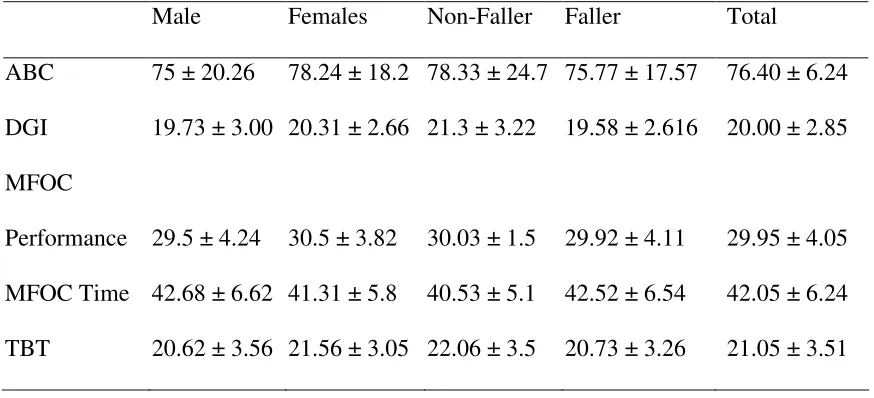
provides a comparison of the mean scores, factored by gender and fall history, for all assessments.
Table 6. Means for the ABC, DGI, MFOC, and TBT (M ± SD)
Male Females Non-Faller Faller Total
ABC 75 ± 20.26 78.24 ± 18.2 78.33 ± 24.7 75.77 ± 17.57 76.40 ± 6.24 DGI 19.73 ± 3.00 20.31 ± 2.66 21.3 ± 3.22 19.58 ± 2.616 20.00 ± 2.85 MFOC
Performance 29.5 ± 4.24 30.5 ± 3.82 30.03 ± 1.5 29.92 ± 4.11 29.95 ± 4.05 MFOC Time 42.68 ± 6.62 41.31 ± 5.8 40.53 ± 5.1 42.52 ± 6.54 42.05 ± 6.24 TBT 20.62 ± 3.56 21.56 ± 3.05 22.06 ± 3.5 20.73 ± 3.26 21.05 ± 3.51
Hypotheses Testing
This study contained two separate hypotheses: (a) the MFOC will demonstrate high construct validity, via high Pearson correlation to three currently validated
instruments, and (b) The MFOC will demonstrate high test re-test reliability and internal consistency.
Construct Validity of the Modified Functional Obstacle Course
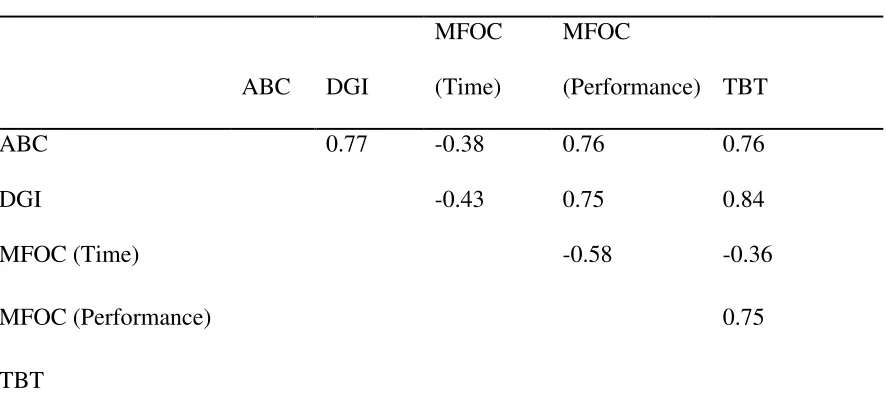
Construct validity was determined by calculating the Pearson Correlation (r) between the MFOC scores (performance and time) and the ABC, DGI, and TBT. Results are displayed in Table 7. Based on previous research, a correlation of r ≥ .80
the ABC, DGI, and TBT ( r(63) = .76, .76, and .75, p < .05, respectively). The time value showed relatively low correlation to the ABC, DGI, and TBT (r(63) = -.38, -.43, and .37); there was also a moderate correlation between the performance and time scores, (r(63) = -.585, with p < .05).
Table 7. Pearson Correlation (r)
ABC DGI
MFOC (Time)
MFOC
(Performance) TBT
ABC 0.77 -0.38 0.76 0.76
DGI -0.43 0.75 0.84
MFOC (Time) -0.58 -0.36
MFOC (Performance) 0.75
TBT
Note. Correlation is significant at the 0.05 level for all values.
Table 8. Correlation (r) Between MFOC Performance and Time and ABC, DGI, & TBT Factored by Gender and Fall History
The MFOC performance score demonstrated moderate to high correlation to the ABC, DGI, and TBT (r(63) = .75-.76, p < .05 and > .80) when factored by those with a history of falling (r(63) = .81, .94, p < .05, for the DGI and TBT) thus, the construct validity was accepted for the MFOC. This was exclusive, however, to the performance score. The time score did not demonstrate adequate validity. Further explanation is provided in future sections.
ABC DGI TBT
MFOC Performance
Male 0.78 0.79 0.78
Female 0.72 0.68 0.73
Faller 0.76 0.94 0.81
Non-Faller 0.75 0.71 0.61
MFOC Time
Male -0.37 -0.45 -0.31
Female -0.43 -0.43 -0.28
Faller -0.46 -0.71 -0.31
Non-Faller -0.32 -0.34 -0.29
Intra-Obstacle Discrimination
An intra-obstacle correlation was performed on the 12 obstacles in the MFOC in comparison to both total score sub-groups (time and performance). Table 9 provides the correlation (r) and descriptive statistics of the individual obstacles. The pine cone and bark flooring had the highest correlation to the performance score (r(63) = .70 and .73, respectively). The carpet and turf had the lowest correlation,( r(63) = .31 and .28, respectively). Correlations were significant (p < .05) for all variables.
Table 9. Intra-Obstacle Correlation
Obstacle M ± SD MFOC Time ( r ) MFOC Performance ( r )
Chair 2.698 ± .612 -0.31 0.59
Door 2.651 ± .481 -0.441 0.54
Carpet 2.746 ± .538 -0.61 0.31
Turf 2.873 ± .336 -0.28 0.28
Ramp (up) 2.753 ± .429 -0.21 0.66
Ramp (down) 2.674 ± .450 -0.26 0.51
Pine Cone Flooring 2.039 ± .886 -0.32 0.7 Pine Bark Flooring 2.571 ± .500 -0.467 0.73
Foam Bolsters 1.769 ± .954 -0.24 0.62
Sand 2.404 ± .581 -0.25 0.63
Stairs (up) 2.404 ± .614 -0.35 0.56
Principal component analysis (PCA) was used to further analyze intra-obstacle discrimination within the MFOC for the performance score. PCA was used to analyze independent measurement constructs within the MFOC. The first component in PCA, using orthogonal transformation, is represented by those obstacles that account for the largest portion of the variance in the score. Preceding components are then listed in descending order of their accountability to the total score, with each component showing little to no correlation to the others (Jolliffe, 2002). Using Kaiser’s criterion and Varimax rotation, principal component analysis demonstrated that five components accounted for 78% of the variance. Figure 4 provides the Scree plot and the drop in the eigen values after the fifth factor and Table 10 provides the factored components.
Figure 4. Scree Plot
with the ABC demonstrating the highest correlation (r(63) = .63, p < .01). Table 11 provides a summary of the correlation (r) scores between the convergent measures and factor scores.
Table 10. Rotated Component Matrix
Environmental
Ocular /
Vestibular
Intrinsic/ Self-Efficacy
Dynamic Movement
Surface Tasks
Object Manipulation
Chair 0.844 0.895
Door
Carpet 0.887
Turf 0.705 0.774
Ramp (up) 0.867 Ramp (down) 0.811 Pinecone
Flooring 0.608 Pinebark
Flooring 0.718 Foam Bolsters
Sand
Stair (up) .0913
Table 11. Correlation (r) Between Components and Convergent Measures
ABC DGI TBT
Ocular/Vestibular 0.54** 0.51 .49**
Intrinsic/Self-Efficacy .63** .55** .53**
Dynamic Movement 0.17 0.19 .30*
Surface Tasks -0.14 -0.08 -0.04
Object Manipulation 0.09 0.24 0.11
Note. *. Correlation is significant at the .05 level. **. Correlation is significant at the .01 level.
Reliability
Pearson’s correlation for the participants’ (N = 30) original performance and time scores in relation to their return value was high (r(30) =. 99 and .893, with p < .05, respectively). Internal consistency was determined via Cronbach’s alpha and was high for both the original performance and time scoring values, in relation to the reciprocal return scores, Cronbach’s Alpha was .993 and .943, respectively.
Due to the high internal consistency of both the original and return scores and the correlation between the two, the MFOC demonstrated high test re-test reliability.
Summary
.99-99, p < .05), and internal consistency. Validity was further determined through principal component analysis, which demonstrated five distinct components
CHAPTER V: DISCUSSION
The purpose of this study was to (a) examine the construct validity of the MFOC, by determining the correlation of the MFOC to three currently validated instruments, (b) examine the reliability and internal consistency, and (c) measure intra-obstacle
parameters within the MFOC. This chapter will discuss the major findings of the study along with limitations and suggestions for future research.
Major Findings
The MFOC performance score demonstrated moderate to high correlation to the convergent assessments: Activity Specific Balance Confidence Scale, Dynamic Gait Index, and the Tinetti Balance Test (ABC, DGI, & TBT) used to determine the construct validity (r =. 75 - .76, p < .05). The narrow range of Pearson values (r = .75 - .76) indicates that the MFOC performance score is equally adept at examining the sum components of the three assessments combined. This illustrates that inferences can be made, with moderate to high confidence, that variation in the MFOC scores are representative of each of the three assessments (ABC, DGI, & TBT). The time score, however, showed only low correlation to the three convergent measures, as well as to the performance score.
Table 12
Comparison of Means, et al., and Current Study
Test Author / Year Purpose Results
The obstacle course: a tool for the assessment of
functional balance and mobility in the elderly. Means / 1996
Exploratory (original
version)
High intra-rater reliability r >
.98 (time and performance)
Comparison of a functional obstacle course with
an index of clinical gait and balance and...
Means, Rodell &
O’Sullivan /1998
Validity (correlated to
TBT)
r =.78, p < .05
Modifying a functional obstacle course to test
balance and mobility in the community
Means &
O’Sullivan / 2000
Exploratory (modified
version)
No significant difference in
time or performance scores
between original and modified
Validity of a Modified Functional Obstacle
Course as a tool to screen for fall-risks in older
adults * Validity
r = .75-.76, p < .05
Table 13. Comparison of MFOC and Convergent Measures
Test Inter-rater Reliability
Test/Re-Test
Reliability Validity
Tinetti Balance Test * .85 (r) 52-73% sensitivity; 52% specificity
Dynamic Gait Index 64 (κ) .85 (ICC)
Χ2=11.27 (p = .0001) (statistically significant) with a score < 19 compared to scores > 19
Activity Specific Balance Confidence
N/A- Self-report
questionnaire .92 (ICC) F(1,123) = 132, p < 0.01
An interesting result of this study was the findings from the principal component analysis (PCA), which demonstrated that the 12 obstacles within the MFOC had five distinct measurements constructs, which accounted for a majority of the variance within the MFOC performance score. There appeared to be congruity between a majority of the obstacles within the MFOC, with the exception of the sand obstacle, which did not account for a significant portion of the total variation in the performance score. PCA is commonly used to identify distinct measurement constructs within a total measurement system (Jolliffe, 2002). In the case of the MFOC, PCA identified five separate
measurement constructs, or components. Each of these components measured a dimension that was independent of aspects the other four components measured.
Grouping of the obstacles demonstrated commonality in a component. This indicates that these obstacles were all measuring the same construct.
The large amount of factor loading within the first two components were
course, Means (2005) noted that such commonalities between the obstacles most likely did exist; however, there were no studies that further investigated the topic.
Additionally, based on the PCA, the four obstacles (chair, foam bolsters, carpet flooring and the door task) represent distinct constructs that were identified as component 3, dynamic movement (chair and foam bolster flooring); component 4, surface tasks (carpet task); and component 5, object manipulation (door). These obstacles constructs were found to perform unique measurements not covered by the other constructs. It is interesting to note that the first two components, ocular/vestibular and intrinsic/self-efficacy, correlated to the construct assessments (ABC, DGI, & TBT), which indicate that they account for a large portion of the total correlation of the MFOC to these
measurements. However, the latter three components did not correlate to these
measurements, and can be seen as measuring a wholly new and unique construct. They have been labeled together as representing “environmental” tasks.
Additional information provided by the PCA indicates that Component 1