VOLUME 36, ARTICLE 20, PAGES 609
−
626
PUBLISHED 15 FEBRUARY 2017
http://www.demographic-research.org/Volumes/Vol36/20/ DOI: 10.4054/DemRes.2017.36.20
Descriptive Finding
The timing of marriage vis-à-vis coresidence and
childbearing in Europe and the United States
Jennifer A. Holland
© 2017 Jennifer A. Holland.
This open-access work is published under the terms of the Creative Commons Attribution NonCommercial License 2.0 Germany, which permits use, reproduction & distribution in any medium for non-commercial purposes, provided the original author(s) and source are given credit.
1 Background 610
2 Data and method 611
3 Results 614
3.1 Ever marrying 614
3.2 The context of marriage 615
3.2.1 Continuity and change in the context of marriage 620
3.2.2 The continued importance and changing nature of Family-Forming
marriage
621
3.2.3 Divergent trends in Conception-Related Legitimizing marriage 621
3.2.4 Limited growth in post-first-birth marriages 622
4 Discussion 622
5 Acknowledgements 623
The timing of marriage vis-à-vis coresidence and childbearing in
Europe and the United States
Jennifer A. Holland1
Abstract
OBJECTIVE
These descriptive findings extend Holland’s (2013) marriage typology by linking the timing of marriage, childbearing, and cohabitation, and apply it to a range of European countries and the United States. The meaning of marriage is organized around six ideal types: Direct Family-Forming, Post-Cohabitation Family-Forming, Conception-Related Legitimizing, Birth-Related Legitimizing, Reinforcing, and Capstone marriage.
METHODS
I present descriptive tabulations of data from the Harmonized Histories, covering 17 European countries and the United States, to highlight continuity and change in the context of marriage across the life course, cohorts, and countries.
RESULTS
Although smaller shares of women entered marriage at each age across cohorts, there is increasing diversity in the timing and context of marriage. Family-Forming marriage continues to be the majority marriage experience, but Direct Family-Forming marriage has declined and Post-Cohabitation Family-Forming marriage has increased in many contexts. Conception-Related Legitimizing marriages became more important in Central and Eastern Europe but less common in Western, Northern, and Anglo-Saxon countries. Limited evidence of growth in post-first-birth marriages suggests that childbearing intentions or a first conception continue to be important triggers for marriage, although this may be changing in Nordic, Anglo-Saxon, and some Western European countries.
CONCLUSIONS
While most people who marry do so prior to or in the absence of a first conception, increasingly marriage is not the first step in the family-building process. Still, for many women in diverse country contexts, marriage continues to be very closely linked to initiating childbearing.
1
Department of Public Administration and Sociology, Faculty of Social Sciences, Erasmus University Rotterdam, Burgemeester Oudlaan 50, 3062 PA Rotterdam, the Netherlands. University of Southampton, UK.
1. Background
Increases in non-marital childbearing have led some to suggest that marriage and childbearing are decoupling (Heuveline and Timberlake 2004; Kiernan 2001). However, Holland (2013) demonstrated a continued link between transitions to marriage and parenthood in Sweden, where long-term cohabitation is nearly indistinguishable from marriage and most children born to unmarried parents experience the marriage of their parents (Heuveline and Timberlake 2004; Perelli-Harris et al. 2012).
The temporal ordering of marriage and childbearing may be indicative of the meaning of marriage. Building upon Holland’s (2013) marriage typology, I investigate the context of marriage in 17 European countries and the United States. Marriages occurring prior to a first conception are identified as ‘Family-Forming.’ For these couples, marriage may be an expression of “permanency and… long-term commitment,” conferring legal and symbolic status on the couple (Holland 2013: 279). While cohabitation is an almost universal prerequisite for marriage in Sweden (Andersson and Philipov 2002) and cohabiting couples have access to some legal protections where ‘cohabitation contracts’ or registered partnerships are available, in most countries marriage remains distinct from cohabitation (Holland and de Valk 2015; Perelli-Harris and Sánchez Gassen 2012). As such, in this extended typology I distinguish ‘Direct Family-Forming’ marriage, whereby a couple does not coreside prior to marriage, from ‘Post-Cohabitation Family-Forming’ marriage.
Marriages just preceding or following a birth are termed ‘Legitimizing’ marriages. While marriage is not a prerequisite for a first conception or birth, it is closely linked to that birth. Distinguishing pre- and post-birth Legitimizing marriages was less relevant for Sweden, where filial rights are transmitted to parents regardless of marital status (Bøe 2010; Perelli-Harris and Sánchez Gassen 2012). Because rights, responsibilities, and norms pertaining to non-marital childbearing vary across countries, I distinguish ‘Conception-Related Legitimizing’ marriage (sometimes termed ‘shotgun marriage’ or ‘bridal pregnancies’), where marriage occurs following a first conception but before a first birth, and ‘Birth-Related Legitimizing’ marriage, where marriage occurs within 12 months of a first birth.
‘crowning achievement’ of the transition to adulthood, occurring only after achieving residential, employment, and family-life stability (Cherlin 2004). With respect to childbearing, Capstone marriage is associated with achieving a desired family size. In the absence of data on childbearing or family size intentions, Holland (2013) proposed identifying Capstone marriages as those occurring after a second or higher-order birth, or once an only child is 5 years old, a duration established by birth-spacing preferences and subsequent childbearing risks (Andersson 2004; Billingsley and Ferrarini 2014).
2. Data and method
Data is drawn from the Harmonized Histories, marriage, birth, and cohabitation histories for 19 European countries and the United States (Perelli-Harris, Kreyenfeld, and Kubisch 2010). The data was constructed using wave one of the Generations and Gender Surveys of Austria, Belgium, Bulgaria, the Czech Republic, Estonia, France, Georgia, Germany, Hungary, Italy, Lithuania, Norway, Poland, Romania, Russia, and Sweden, and the Dutch Fertility and Family Survey (2003), the British Household Panel Survey (2005‒2006), the Spanish Survey of Fertility and Values (2006), and the United States 1995 and 2007 National Survey of Family Growth. Data for Austria, which covered only younger cohorts, and Italy, which lacked key information about respondents’ age, was excluded from these analyses. The sample was limited to women never married and childless at age 18, born between 1950 and 1977 (n = 58,360). I excluded respondents missing dates of first marriage or births (<1% of the full Harmonized Histories sample).
non-coresidential partnership existed, produced a child, and the transition to coresidence or marriage (closely) followed the birth of that child. Following this 12-month rule, a further 991 first births (2%) and 555 second births (1.6%) were assigned to a union. Where this partnership transition is to non-marital coresidence, couples that experienced a first birth would be ‘at risk’ for a Post-Birth Legitimizing, Reinforcing, or Capstone marriage, and couples that experienced a second birth would be ‘at risk’ for a Capstone marriage. Where the partnership transition is directly to marriage, those following a first birth would be classified as Post-Birth Legitimizing marriages and those following a second birth would be classified as Capstone marriages. Births occurring more than 9 months after a union and more than 12 months prior to a subsequent union are classified as non-union births: 2,961 first births (6%) and 1,086 second births (3%) were identified as non-union births. Any unions formed after these births would be considered step-unions.
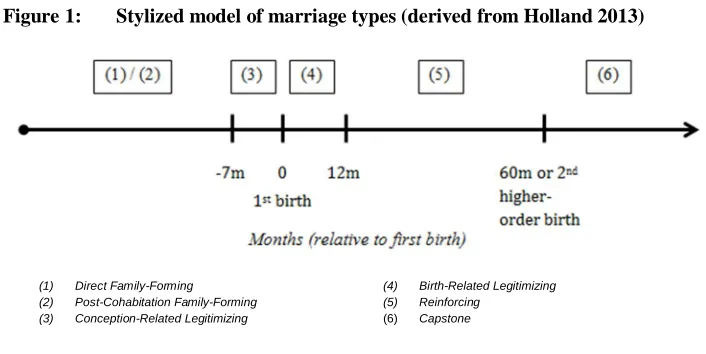
I identify the six types of marriage discussed above using information about coresidence prior to the marriage, parity, and age of the firstborn child (Figure 1). Because the typology relies on single parity progressions, marriages occurring after a multiple first birth (e.g., twin, triplet, etc.), where a woman transitions directly from parity 0 to parity 2 or higher, are categorized separately. First marriages that occur after a first childbearing union dissolves (i.e., step-marriages) are categorized separately, since the association between marriage and childbearing in this new stepfamily may be more complex (see Holland and Thomson 2011). For the purposes of this descriptive finding, first marriages after a multiple first birth and step-marriages are pooled and classified as ‘Other’ marriages.
Figure 1: Stylized model of marriage types (derived from Holland 2013)
(1) Direct Family-Forming (2) Post-Cohabitation Family-Forming (3) Conception-Related Legitimizing
(4) Birth-Related Legitimizing (5) Reinforcing
I tabulated the incidence and type of first marriage (regardless of whether the marriage was still intact) for all women from age 18 until 12 months prior to the survey (in order to uniformly apply the union assignment criteria for children born between unions). To make comparisons across cohorts and countries I compare women’s experiences of first marriage by age 20, 30, and 40. I have full information on first marriage experiences of women born prior to 1957, until age 30 for women born between 1958 and 1967, and at age 20 for women born between 1968 and 1977. All tabulations use sampling weights.
The analysis of the United States National Survey of Family Growth (NSFG) differed because the survey covered women aged 18 to 44. To compare the same women at ages 20, 30, and 40, the oldest United States cohorts were drawn from the NSFG 1995 and restricted to those born between 1950 and 1954. For the middle cohort, data covering women born between 1958 and 1964 was drawn from the NSFG 1995 and was pooled with data covering women born between 1961 and 1967 from the NSFG 2007. For the youngest cohorts, data was drawn from the NSFG 2007 only.
Table 1: Birth cohorts, by country (weighted percentages)
Birth Cohort N
(unweighted)
Country Born 1950‒1957a Born 1958‒1967 Born 1968‒1977
Western Europe
Belgium 26.4 40.6 33.0 1,926
France 27.9 37.1 35.0 2,840
Germany 26.8 41.7 31.6 2,838
Netherlands 27.3 38.5 34.2 2,814
Northern Europe
Norway 26.6 36.2 37.2 4,001
Sweden 23.6 37.6 38.8 2,398
Southern Europe
Spain 21.3 38.0 40.7 4,020
Central Europe
Czech Republic 26.7 32.6 40.7 2,308
Hungary 31.9 30.0 38.1 3,215
Eastern Europe
Bulgaria 21.0 37.4 41.6 3,467
Estonia 30.4 35.8 33.8 2,469
Georgia 25.3 39.5 35.2 2,627
Lithuania 23.6 35.5 41.0 2,259
Poland 37.7 29.9 32.4 5,355
Romania 26.0 27.8 46.3 2,690
Russia 33.4 39.2 27.4 3,365
Anglo-Saxon
United Kingdom 23.9 41.2 34.8 2,787
USA 15.8 47.8 36.3 6,981
Source: Harmonized Histories
3. Results
3.1 Ever marrying
While there is cross-national diversity in the share of ever-married women, the greatest uniformity is evident among the earliest cohorts (born 1950 to 1957) (Table 2). In later cohorts, country and regional variation becomes more pronounced. Sweden, where the retreat from marriage was already evident among women of the earliest birth cohorts, is an exception to this general pattern.
Table 2: Experience of a first marriage by age, cohort, and country (weighted percentages)
Age
20 30 40
Born 1950‒
1957a
Born 1958‒
1967
Born 1968‒
1977
Born 1950‒
1957a
Born 1958‒
1967
Born 1950‒
1957a
Western Europe
Belgium 20.8 13.4 ^^^ 4.4 ^^^/††† 83.5 75.3 ^^^ 88.5
France 17.0 10.6 ^^^ 2.5 ^^^/††† 76.7 62.5 ^^^ 83.8
Germany 20.3 12.6 ^^^ 7.5 ^^^/††† 75.0 69.2 ^^^ 83.4
Netherlands 15.9 6.9 ^^^ 2.8 ^^^/††† 83.4 65.3 ^^^ 89.7
Northern Europe
Norway 18.1 9.0 ^^^ 1.8 ^^^/††† 76.1 63.6 ^^^ 85.2
Sweden 6.2 3.3 ^^ 2.7 ^^^ 58.7 47.4 ^^^ 76.3
Southern Europe
Spain 12.1 12.5 5.9 ^^^/††† 84.1 76.2 ^^^ 89.0
Central Europe
Czech Republic 21.4 23.9 21.8 83.7 83.3 86.7
Hungary 34.5 31.6 17.9 ^^^/††† 89.9 86.5 ^^ 92.5
Eastern Europe
Bulgaria 31.4 30.4 25.5 ^^/††† 83.8 85.0 87.5
Estonia 17.7 23.2 ^^^ 17.2 ††† 85.9 79.6 ^^^ 90.7
Georgia 21.3 23.7 23.7 76.5 75.9 84.8
Lithuania 15.3 16.4 20.0 ^^/† 76.2 80.8 ^^ 83.8
Poland 20.1 21.6 18.5 †† 85.8 83.1 ^^ 89.4
Romania 26.6 28.8 24.7 † 89.7 87.4 93.4
Table 2: (Continued)
Age
20 30 40
Born 1950‒
1957a
Born 1958‒
1967
Born 1968‒
1977
Born 1950‒
1957a
Born 1958‒
1967
Born 1950‒
1957a
Anglo-Saxon
United Kingdom 22.5 12.3 ^^^ 4.5 ^^^/††† 84.4 71.3 ^^^ 91.2
USA 28.1 16.3 ^^^ 12.1 ^^^/††† 80.9 74.0 ^^^ 89.4
Source: Harmonized Histories a
For the United States, the oldest cohort consists of those born 1950-54, due to age sampling restrictions of the NSFG (ages 18‒44). ^/^^/^^^
Statistically different from cohorts born 1950 - 1957 at the 10%/5%/1% level, adjusted Wald test. †/††/†††
Statistically different from cohorts born 1958 - 1967 at the 10%/5%/1% level, adjusted Wald test.
Changes in the timing and incidence of marriage for women of later cohorts occurred unevenly across countries, consistent with the differential diffusion of other processes of family change (e.g., Nazio and Blossfeld 2003; Van Bavel 2004; Vitali, Aassve, and Lappegård 2015). In Western and Northern Europe and the Anglo-Saxon countries the share ever-married by age 20 declined across cohorts. In Southern, Central, and Eastern Europe there was stability or growth in the share of women ever-married by age 20 among the earliest and middle cohorts, consistent with a sustained ‘early marriage’ pattern (Hajnal 1982). Among the latest cohort, shares of ever-married women at age 20 declined in all countries except the Czech Republic, Georgia, Lithuania, Russia, and Sweden.
In Western, Northern, and Southern Europe and in the Anglo-Saxon countries, proportions ever-married at age 30 declined across cohorts. In Central and Eastern Europe the evidence was mixed: there were modest declines in Hungary and Estonia, shares of the ever-married were stable in the Czech Republic, Bulgaria, Georgia, Romania, and Russia, and the share ever-married increased in Lithuania. The Southern, Central, and Eastern European ‘early marriage’ pattern did not result in more women ever-married at age 30 (except in Lithuania), suggesting differing tempo (rather than quantum) trends in marital behavior.
3.2 The context of marriage
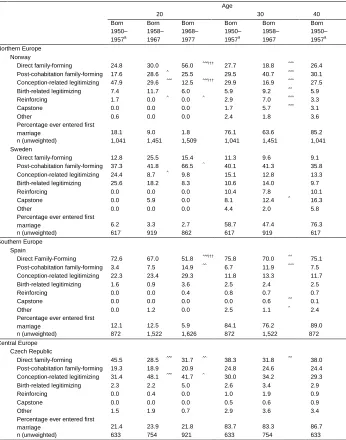
Table 3: Context of first marriage among those experiencing a first marriage by age, cohort, and country (weighted percentages)
Age
20 30 40
Born 1950‒ 1957a Born 1958‒ 1967 Born 1968‒ 1977 Born 1950‒ 1957a Born 1958‒ 1967 Born 1950‒ 1957a Western Europe Belgium
Direct family-forming 45.3 28.6 ^^ 36.1 46.5 35.4 ^^^ 44.9
Post-cohabitation family-forming 30.7 62.0 ^^^ 47.6 38.3 53.3 ^^^ 38.8
Conception-related legitimizing 22.3 9.4 ^^ 16.3 12.1 8.5 ^ 11.6
Birth-related legitimizing 0.9 0.0 0.0 0.9 1.0 1.2
Reinforcing 0.0 0.0 0.0 1.0 0.4 1.4
Capstone 0.0 0.0 0.0 0.3 0.7 1.0
Other 0.9 0.0 0.0 0.9 0.7 1.1
Percentage ever entered first
marriage 20.8 13.4 4.4 83.5 75.3 88.5
n (unweighted) 480 772 674 480 772 480
France
Direct family-forming 53.0 49.6 45.0 47.6 30.0 ^^^ 45.1
Post-cohabitation family-forming 13.5 24.8 ^^ 41.6 ^^^ 27.3 46.1 ^^^ 29.1
Conception-related legitimizing 31.1 22.1 3.5 ^^^/††† 17.7 13.5 ^ 16.7
Birth-related legitimizing 2.3 1.9 9.9 2.0 2.8 2.3
Reinforcing 0.0 1.6 0.0 2.6 3.2 3.0
Capstone 0.0 0.0 0.0 1.5 2.6 2.2
Other 0.0 0.0 0.0 1.3 1.8 1.5
Percentage ever entered first
marriage 17.0 10.6 2.5 76.7 62.5 83.8
n (unweighted) 785 1,048 1,007 785 1,048 785
Germany
Direct family-forming 34.2 31.6 37.0 32.5 23.5 ^^^ 30.1
Post-cohabitation family-forming 28.7 28.2 30.5 37.8 46.4 ^^^ 37.3
Conception-related legitimizing 29.3 35.0 25.8 19.0 18.1 18.2
Birth-related legitimizing 7.3 5.2 6.7 5.6 5.5 5.9
Reinforcing 0.4 0.0 0.0 0.4 3.5 ^^^ 0.7
Capstone 0.0 0.0 0.0 1.2 1.4 2.5
Other 0.0 0.0 0.0 3.6 1.6 ^^ 5.2
Percentage ever entered first
marriage 20.3 12.6 7.5 75.0 69.2 83.4
n (unweighted) 727 1,239 872 727 1,239 727
Netherlands
Direct family-forming 71.7 65.2 82.4 † 70.6 45.3 ^^^ 67.2
Post-cohabitation family-forming 4.9 16.8 ^^ 6.5 19.0 43.3 ^^^ 20.3
Conception-related legitimizing 22.0 18.0 11.1 8.8 8.0 9.1
Birth-related legitimizing 0.6 0.0 0.0 0.7 1.3 0.8
Reinforcing 0.0 0.0 0.0 0.4 0.6 1.0
Capstone 0.0 0.0 0.0 0.0 0.6 ^^ 0.8
Other 0.8 0.0 0.0 0.4 0.9 0.8
Percentage ever entered first
marriage 15.9 6.9 2.8 83.4 65.3 89.7
Table 3: (Continued)
Age
20 30 40
Born 1950‒ 1957a Born 1958‒ 1967 Born 1968‒ 1977 Born 1950‒ 1957a Born 1958‒ 1967 Born 1950‒ 1957a Northern Europe Norway
Direct family-forming 24.8 30.0 56.0 ^^^/†† 27.7 18.8 ^^^ 26.4
Post-cohabitation family-forming 17.6 28.6 ^ 25.5 29.5 40.7 ^^^ 30.1
Conception-related legitimizing 47.9 29.6 ^^^ 12.5 ^^^/†† 29.9 16.9 ^^^ 27.5
Birth-related legitimizing 7.4 11.7 6.0 5.9 9.2 ^^ 5.9
Reinforcing 1.7 0.0 ^ 0.0 ^ 2.9 7.0 ^^^ 3.3
Capstone 0.0 0.0 0.0 1.7 5.7 ^^^ 3.1
Other 0.6 0.0 0.0 2.4 1.8 3.6
Percentage ever entered first
marriage 18.1 9.0 1.8 76.1 63.6 85.2
n (unweighted) 1,041 1,451 1,509 1,041 1,451 1,041
Sweden
Direct family-forming 12.8 25.5 15.4 11.3 9.6 9.1
Post-cohabitation family-forming 37.3 41.8 66.5 ^ 40.1 41.3 35.8
Conception-related legitimizing 24.4 8.7 ^ 9.8 15.1 12.8 13.3
Birth-related legitimizing 25.6 18.2 8.3 10.6 14.0 9.7
Reinforcing 0.0 0.0 0.0 10.4 7.8 10.1
Capstone 0.0 5.9 0.0 8.1 12.4 ^ 16.3
Other 0.0 0.0 0.0 4.4 2.0 5.8
Percentage ever entered first
marriage 6.2 3.3 2.7 58.7 47.4 76.3
n (unweighted) 617 919 862 617 919 617
Southern Europe Spain
Direct Family-Forming 72.6 67.0 51.8 ^^^/†† 75.8 70.0 ^^ 75.1
Post-cohabitation family-forming 3.4 7.5 14.9 ^^ 6.7 11.9 ^^^ 7.5
Conception-related legitimizing 22.3 23.4 29.3 11.8 13.3 11.7
Birth-related legitimizing 1.6 0.9 3.6 2.5 2.4 2.5
Reinforcing 0.0 0.0 0.4 0.8 0.7 0.7
Capstone 0.0 0.0 0.0 0.0 0.6 ^^ 0.1
Other 0.0 1.2 0.0 2.5 1.1 ^ 2.4
Percentage ever entered first
marriage 12.1 12.5 5.9 84.1 76.2 89.0
n (unweighted) 872 1,522 1,626 872 1,522 872
Central Europe Czech Republic
Direct family-forming 45.5 28.5 ^^^ 31.7 ^^ 38.3 31.8 ^^ 38.0
Post-cohabitation family-forming 19.3 18.9 20.9 24.8 24.6 24.4
Conception-related legitimizing 31.4 48.1 ^^^ 41.7 ^ 30.0 34.2 29.3
Birth-related legitimizing 2.3 2.2 5.0 2.6 3.4 2.9
Reinforcing 0.0 0.4 0.0 1.0 1.9 0.9
Capstone 0.0 0.0 0.0 0.5 0.6 0.9
Other 1.5 1.9 0.7 2.9 3.6 3.4
Percentage ever entered first
marriage 21.4 23.9 21.8 83.7 83.3 86.7
Table 3: (Continued)
Age
20 30 40
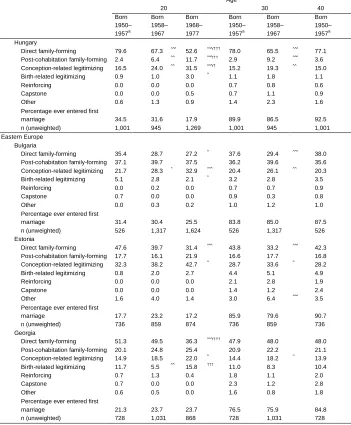
Born 1950‒ 1957a Born 1958‒ 1967 Born 1968‒ 1977 Born 1950‒ 1957a Born 1958‒ 1967 Born 1950‒ 1957a Hungary
Direct family-forming 79.6 67.3 ^^^ 52.6 ^^^/††† 78.0 65.5 ^^^ 77.1
Post-cohabitation family-forming 2.4 6.4 ^^ 11.7 ^^^/†† 2.9 9.2 ^^^ 3.6
Conception-related legitimizing 16.5 24.0 ^^ 31.5 ^^^/† 15.2 19.3 ^^ 15.0
Birth-related legitimizing 0.9 1.0 3.0 ^ 1.1 1.8 1.1
Reinforcing 0.0 0.0 0.0 0.7 0.8 0.6
Capstone 0.0 0.0 0.5 0.7 1.1 0.9
Other 0.6 1.3 0.9 1.4 2.3 1.6
Percentage ever entered first
marriage 34.5 31.6 17.9 89.9 86.5 92.5
n (unweighted) 1,001 945 1,269 1,001 945 1,001
Eastern Europe Bulgaria
Direct family-forming 35.4 28.7 27.2 ^ 37.6 29.4 ^^^ 38.0
Post-cohabitation family-forming 37.1 39.7 37.5 36.2 39.6 35.6
Conception-related legitimizing 21.7 28.3 ^ 32.9 ^^^ 20.4 26.1 ^^ 20.3
Birth-related legitimizing 5.1 2.8 2.1 ^ 3.2 2.8 3.5
Reinforcing 0.0 0.2 0.0 0.7 0.7 0.9
Capstone 0.7 0.0 0.0 0.9 0.3 0.8
Other 0.0 0.3 0.2 1.0 1.2 1.0
Percentage ever entered first
marriage 31.4 30.4 25.5 83.8 85.0 87.5
n (unweighted) 526 1,317 1,624 526 1,317 526
Estonia
Direct family-forming 47.6 39.7 31.4 ^^^ 43.8 33.2 ^^^ 42.3
Post-cohabitation family-forming 17.7 16.1 21.9 16.6 17.7 16.8
Conception-related legitimizing 32.3 38.2 42.7 ^ 28.7 33.6 ^ 28.2
Birth-related legitimizing 0.8 2.0 2.7 4.4 5.1 4.9
Reinforcing 0.0 0.0 0.0 2.1 2.8 1.9
Capstone 0.0 0.0 0.0 1.4 1.2 2.4
Other 1.6 4.0 1.4 3.0 6.4 ^^^ 3.5
Percentage ever entered first
marriage 17.7 23.2 17.2 85.9 79.6 90.7
n (unweighted) 736 859 874 736 859 736
Georgia
Direct family-forming 51.3 49.5 36.3 ^^^/††† 47.9 48.0 48.0
Post-cohabitation family-forming 20.1 24.8 25.4 20.9 22.2 21.1
Conception-related legitimizing 14.9 18.5 22.0 ^ 14.4 18.2 ^ 13.9
Birth-related legitimizing 11.7 5.5 ^^ 15.8 ††† 11.0 8.3 10.4
Reinforcing 0.7 1.3 0.4 1.8 1.1 2.0
Capstone 0.7 0.0 0.0 2.3 1.2 2.8
Other 0.6 0.5 0.0 1.6 0.8 1.8
Percentage ever entered first
marriage 21.3 23.7 23.7 76.5 75.9 84.8
Table 3: (Continued)
Age
20 30 40
Born 1950‒ 1957a Born 1958‒ 1967 Born 1968‒ 1977 Born 1950‒ 1957a Born 1958‒ 1967 Born 1950‒ 1957a Lithuania
Direct family-forming 66.1 54.1 ^ 48.2 ^^^ 63.4 59.8 62.5
Post-cohabitation family-forming 11.5 15.2 14.1 11.1 11.6 12.7
Conception-related legitimizing 21.6 26.2 31.8 ^ 18.7 22.5 18.0
Birth-related legitimizing 0.9 4.5 ^ 5.8 ^^ 3.1 3.7 2.8
Reinforcing 0.0 0.0 0.0 1.2 0.6 1.1
Capstone 0.0 0.0 0.0 0.3 0.1 0.9
Other 0.0 0.0 0.0 2.2 1.6 2.0
Percentage ever entered first
marriage 15.3 16.4 20.0 76.2 80.8 83.8
n (unweighted) 584 894 781 584 894 584
Poland
Direct family-forming 53.1 50.0 43.1 ^^^/† 56.3 53.1 ^ 56.1
Post-cohabitation family-forming 10.4 9.8 10.0 10.4 11.0 10.7
Conception-related legitimizing 32.3 38.2 ^ 43.1 ^^^ 26.2 30.3 ^^ 25.3
Birth-related legitimizing 2.7 2.0 2.8 3.2 2.7 3.3
Reinforcing 0.5 0.0 0.0 1.4 0.9 1.4
Capstone 0.0 0.0 0.0 0.7 0.7 1.2
Other 1.0 0.0 ^^ 0.9 † 1.8 1.4 2.0
Percentage ever entered first
marriage 20.1 21.6 18.5 85.8 83.1 89.4
n (unweighted) 2,018 1,603 1,734 2,018 1,603 2,018
Romania
Direct family-forming 77.2 68.8 ^^ 70.1 ^ 75.3 72.4 74.6
Post-cohabitation family-forming 8.3 12.2 15.3 ^^ 9.6 10.3 10.0
Conception-related legitimizing 10.1 13.2 12.0 7.0 10.4 ^^ 6.9
Birth-related legitimizing 3.9 5.1 2.6 3.8 4.6 3.7
Reinforcing 0.0 0.8 0.0 1.3 1.3 1.2
Capstone 0.4 0.0 0.0 1.1 0.5 1.7
Other 0.0 0.0 0.0 1.8 0.5 ^^ 1.9
Percentage ever entered first
marriage 26.6 28.8 24.7 89.7 87.4 93.4
n (unweighted) 874 847 969 874 847 874
Russia
Direct family-forming 69.0 65.4 52.5 ^^^/††† 66.3 61.2 ^^ 64.9
Post-cohabitation family-forming 8.5 8.0 13.3 ^/†† 11.8 10.5 11.6
Conception-related legitimizing 17.8 23.3 28.3 ^^^ 14.6 21.2 ^^^ 14.4
Birth-related legitimizing 4.3 2.3 5.2 † 3.6 2.9 3.6
Reinforcing 0.3 0.0 0.3 2.3 1.6 2.7
Capstone 0.0 0.0 0.0 0.6 0.9 0.9
Other 0.0 1.1 ^^ 0.3 0.7 1.7 ^ 1.9
Percentage ever entered first
marriage 22.8 31.2 30.4 86.1 86.7 90.8
Table 3: (Continued)
Age
20 30 40
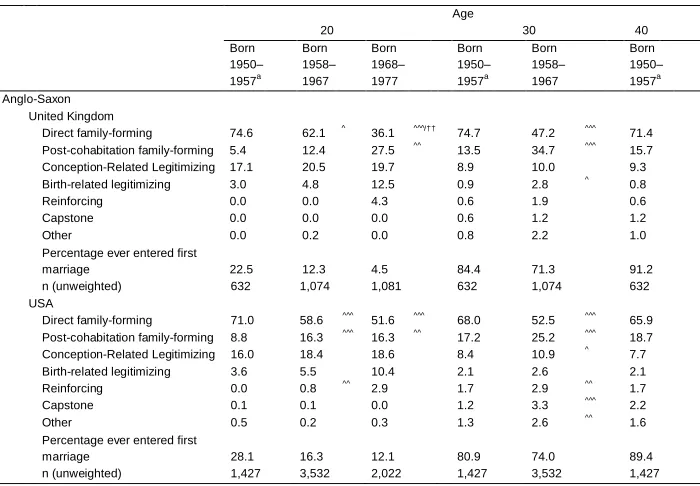
Born 1950‒ 1957a Born 1958‒ 1967 Born 1968‒ 1977 Born 1950‒ 1957a Born 1958‒ 1967 Born 1950‒ 1957a Anglo-Saxon
United Kingdom
Direct family-forming 74.6 62.1 ^ 36.1 ^^^/†† 74.7 47.2 ^^^ 71.4
Post-cohabitation family-forming 5.4 12.4 27.5 ^^ 13.5 34.7 ^^^ 15.7
Conception-Related Legitimizing 17.1 20.5 19.7 8.9 10.0 9.3
Birth-related legitimizing 3.0 4.8 12.5 0.9 2.8 ^ 0.8
Reinforcing 0.0 0.0 4.3 0.6 1.9 0.6
Capstone 0.0 0.0 0.0 0.6 1.2 1.2
Other 0.0 0.2 0.0 0.8 2.2 1.0
Percentage ever entered first
marriage 22.5 12.3 4.5 84.4 71.3 91.2
n (unweighted) 632 1,074 1,081 632 1,074 632
USA
Direct family-forming 71.0 58.6 ^^^ 51.6 ^^^ 68.0 52.5 ^^^ 65.9
Post-cohabitation family-forming 8.8 16.3 ^^^ 16.3 ^^ 17.2 25.2 ^^^ 18.7
Conception-Related Legitimizing 16.0 18.4 18.6 8.4 10.9 ^ 7.7
Birth-related legitimizing 3.6 5.5 10.4 2.1 2.6 2.1
Reinforcing 0.0 0.8 ^^ 2.9 1.7 2.9 ^^ 1.7
Capstone 0.1 0.1 0.0 1.2 3.3 ^^^ 2.2
Other 0.5 0.2 0.3 1.3 2.6 ^^ 1.6
Percentage ever entered first
marriage 28.1 16.3 12.1 80.9 74.0 89.4
n (unweighted) 1,427 3,532 2,022 1,427 3,532 1,427
Source: Harmonized Histories a
For the United States, the oldest cohort consists of those born 1950-54, due to age sampling restrictions of the NSFG (ages 18‒44). ^/^^/^^^
Statistically different from cohorts born 1950 - 1957 at the 10%/5%/1% level, adjusted Wald test. †/††/†††
Statistically different from cohorts born 1958 - 1967 at the 10%/5%/1% level, adjusted Wald test.
3.2.1 Continuity and change in the context of marriage
3.2.2 The continued importance and changing nature of Family-Forming marriage
In all countries, for all cohorts and ages, Family-Forming marriage was the modal or (more typically) the majority pathway into marriage. There was cross-cohort stability in shares of Family-Forming marriage in Western (excluding Belgium), Northern, Southern, and Eastern Europe (excluding Bulgaria, Estonia, and Russia) at age 30. In the Anglo-Saxon countries, Central Europe, and in Bulgaria, Estonia, and Russia, shares of Family-Forming marriage at age 30 declined across cohorts. In these contexts, marriage may increasingly be tied to the conception or birth of a child, rather than the first step in the family-forming process. In Belgium there was a slight increase in the share of Family-Forming marriages across cohorts.
Despite continuing prevalence, the nature of Family-Forming marriages changed in most countries. At age 30, shares of Post-Cohabitation Family-Forming marriage increased and Direct Family-Forming marriage declined in all regions except Sweden and Eastern Europe, consistent with cross-national and temporal patterns of the emergence of pre-marital cohabitation (Hiekel, Liefbroer, and Poortman 2014; Lesthaeghe 2010; Perelli-Harris et al. forthcoming).
Evidence for the shift away from Direct Family-Forming marriage toward Post-Cohabitation Family-Forming marriage was mixed for early marriage. In Southern, Central and Eastern Europe and in the Anglo-Saxon countries there was a shift away from Direct Family-Forming marriage across cohorts. In Spain, Hungary, Romania, Russia, and the Anglo-Saxon countries this was mirrored with a shift toward Post-Cohabitation Family-Forming marriage. In Western Europe, however, the shift from Direct to Post-Cohabitation Family-Forming marriage was not unilateral, and in the Netherlands and Norway there was even evidence of growth in Direct Family-Forming marriage, consistent with increased selectivity into early marriage.
3.2.3 Divergent trends in Conception-Related Legitimizing marriage
3.2.4 Limited growth in post-first-birth marriages
While rare in most countries at age 20 (when childbearing may not yet have begun), marriages occurring after a first birth (i.e., Post-Birth Legitimizing, Reinforcing and Capstone) constitute a non-negligible share of first marriages at ages 30 and 40, particularly in Northern Europe, France, Germany, Georgia, and Estonia. Evidence of significant cross-cohort growth in post-first-birth marriages was limited, except in Northern Europe, Germany, the Netherlands, and the Anglo-Saxon countries. As later birth cohorts transition to parenthood in greater numbers and are exposed to the risk of post-first-birth marriages, further growth may emerge.
4. Discussion
These descriptive findings document declining shares of women entering marriage at each age and increasing diversity in the context of marriage for women born between 1950 and 1977, across 17 European countries and the United States. While these analyses are not explanatory, changes in the incidence, timing, and context of marriage are likely the result of changes in the meaning of marriage and in population composition, as well as individual, background, and macro-level factors (Holland 2013; Ní Bhrolcháin and Beaujouan 2012; Perelli-Harris et al. 2010). For instance, if couples perceive the need to establish themselves in the labor market prior to marrying, individual economic circumstances and the broader macroeconomic climate may prompt couples to delay marriage (Oppenheimer 2003). Couples might delay marriage, even after a first or subsequent birth, if there is an expectation of certain marital rituals, such as a large ceremony or honeymoon, which require extensive planning and financial investment, or may be less feasible when children are young (Kalmijn 2004). The availability and affordability of housing may shape couples’ marriage and childbearing decisions (Mulder 2006; Holland 2012). The diffusion of new family behaviors and norms, such as the acceptability of non-marital childbearing or the perception of marriage as an outmoded institution, might produce cross-cohort and cross-country variation. Investigating how individual-, regional- and country-level factors shape marital behavior will further our understanding of the modern-day meaning of marriage.
5. Acknowledgements
References
Andersson, G. (2004). Childbearing developments in Denmark, Norway, and Sweden from the 1970s to the 1990s: A comparison.Demographic Research S3(7): 155‒ 176.doi:10.4054/DemRes.2004.S3.7.
Andersson, G. and Philipov, D. (2002). Life-table representations of family dynamics in Sweden, Hungary, and 14 other FFS countries: A project of descriptions of demographic behavior. Demographic Research 7(4): 67‒144. doi:10.4054/dem res.2002.7.4.
Billingsley, S. and Ferrarini, T. (2014). Family policy and fertility intentions in 21 European countries. Journal of Marriage and Family 76(2): 428‒445.
doi:10.1111/jomf.12097.
Bøe, S. (2010). Sambos med Barn Bör Gifta Sig [Cohabitors with Children should marry]. inDagens Nyheter. Stockholm.
Cherlin, A.J. (2004). The deinstitutionalization of American marriage. Journal of Marriage and Family 66(4): 848‒861.doi:10.1111/j.0022-2445.2004.00058.x.
Hajnal, J. (1982). Two kinds of preindustrial household formation system.Population and Development Review 8(3): 449‒494.doi:10.2307/1972376.
Heuveline, P. and Timberlake, J.M. (2004). The role of cohabitation in family formation: The United States in comparative perspective. Journal of Marriage and Family 66(5): 1214‒1230.doi:10.1111/j.0022-2445.2004.00088.x.
Hiekel, N., Liefbroer, A.C., and Poortman, A.-R. (2014). Understanding diversity in the meaning of cohabitation across Europe. European Journal of Population 30(4): 391‒410.doi:10.1007/s10680-014-9321-1.
Holland, J.A. (2012). Home and where the heart is: Marriage timing and joint home purchase. European Journal of Population 28(1): 65‒89. doi:10.1007/s10680-011-9242-1.
Holland, J.A. (2013). Love, marriage, then the baby carriage? Marriage timing and childbearing in Sweden.Demographic Research 29(11): 275‒306.doi:10.4054/ DemRes.2013.29.11.
Holland, J.A. and Thomson, E. (2011). Stepfamily childbearing in Sweden: Quantum and tempo effects, 1950‒99.Population Studies 65(1): 115‒128. doi:10.1080/ 00324728.2010.543693.
Kalmijn, M. (2004). Marriage rituals as reinforcers of role transitions: An analysis of weddings in the Netherlands.Journal of Marriage and Family 66(3): 582‒594.
doi:10.1111/j.0022-2445.2004.00039.x.
Kiernan, K. (2001). The rise of cohabitation and childbearing outside marriage in western Europe. International Journal of Law, Policy and the Family 15(1): 1‒ 21.doi:10.1093/lawfam/15.1.1.
Lesthaeghe, R.J. (2010). The unfolding story of the second demographic transition.
Population and Development Review 36(2): 211‒251.doi:10.1111/j.1728-4457. 2010.00328.x.
Mulder, C.H. (2006). Home-ownership and family formation.Journal of Housing and the Built Environment 21(3): 281‒298.doi:10.1007/s10901-006-9050-9.
Nazio, T. and Blossfeld, H.-P. (2003). The diffusion of cohabitation among young women in West Germany, East Germany and Italy. European Journal of Population/Revue européenne de Démographie 19(1): 47‒82.
Ní Bhrolcháin, M. and Beaujouan, E. (2012). Fertility postponement is largely due to rising educational enrolment. Population Studies 66(3): 311‒327. doi:10.1080/ 00324728.2012.697569.
Oppenheimer, V.K. (2003). Cohabiting and marriage during young men’s career-development process.Demography 40(1): 127‒149.doi:10.2307/3180815.
Perelli-Harris, B., Berrington, A., Galezewska, P., Sánchez Gassen, N., and Holland, J.A. (forthcoming). The link between the divorce revolution and the cohabitation boom.Population and Development Review.
Perelli-Harris, B., Kreyenfeld, M., and Kubisch, K. (2010). Harmonized histories: manual for the preparation of comparative fertility and union histories. MPIDR Working Paper WP-2010-011.
Perelli‐Harris, B. and Sánchez Gassen, N. (2012). How similar are cohabitation and marriage? Legal approaches to cohabitation across Western Europe. Population and Development Review 38(3): 435‒467. doi:10.1111/j.1728-4457.2012.00 511.x.
Perelli-Harris, B., Sigle-Rushton, W., Kreyenfeld M., Lappegård, T., Keizer, R., and Berghammer, C. (2010). The educational gradient of childbearing within cohabitation in Europe. Population and Development Review 36(4): 775‒801.
doi:10.1111/j.1728-4457.2010.00357.x.
Van Bavel, J. (2004). Diffusion effects in the European fertility transition: Historical evidence from within a Belgian town (1846–1910). European Journal of Population/Revue européenne de Démographie 20(1): 63‒85.