INNOVATION IN
HEALTH INFORMATICS
Methods to describe referral patterns in a
Canadian primary care electronic medical
record database: modelling multi-level
count data
Bridget L. Ryan
Centre for Studies in Family Medicine, Department of Family Medicine, Schulich School of Medicine & Dentistry, Western University, London, ON, Canada, and Department of Epidemiology and Biostatistics, Schulich School of Medicine & Dentistry, Western University, London, ON, Canada
Joshua Shadd
Department of Family Medicine, McMaster University, Hamilton, ON, Canada
Heather Maddocks
Centre for Studies in Family Medicine, Department of Family Medicine, Schulich School of Medicine & Dentistry, Western University, London, ON, Canada
Moira Stewart
Centre for Studies in Family Medicine, Department of Family Medicine, Schulich School of Medicine & Dentistry, Western University, London, ON, Canada
Amardeep Thind
Department of Family Medicine, Schulich School of Medicine & Dentistry, Western University, London, ON, Canada, Department of Epidemiology and Biostatistics, Schulich School of Medicine & Dentistry, Western University, London, ON, Canada, and Schulich Interfaculty Program in Public Health, Schulich School of Medicine & Dentistry, Western University, London, ON, Canada
Amanda L. Terry
Department of Family Medicine, Schulich School of Medicine & Dentistry, Western University, London, ON, Canada, Department of Epidemiology and Biostatistics, Schulich School of Medicine & Dentistry, Western University, London, ON, Canada, and Schulich Interfaculty Program in Public Health, Schulich School of Medicine & Dentistry, Western University, London, ON, Canada
ABSTRACT
Background A referral from a family physician (FP) to a specialist is an inflec-tion point in the patient journey, with potential implicaA referral from a family physician (FP) to a specialist is an inflec-tions for clinical outcomes and health policy. Primary care electronic medical record (EMR) databases offer opportunities to examine referral patterns. Until recently, software techniques were not available to model these kinds of multi-level count data.
Objective To establish methodology for determining referral rates from FPs to medical specialists using the Canadian Primary Care Sentinel Surveillance Network (CPCSSN) EMR database.
Method Retrospective cohort study, mixed effects and multi-level negative bino-mial regression modelling with 87,258 eligible patients between 2007 and 2012. Mean referrals compared by patient sex, age, chronic conditions, FP visits, and urban/rural practice location. Proportion of variance in referral rates attributable to the patient and practice levels.
Results On average, males had 0.26 and females had 0.31 referrals in a 12-month period. Referrals were significantly higher for females, increased with
Research article
Cite this article: Ryan BL, Shadd J, Maddocks H, Stewart M, Thind A, Terry AL. Methods to describe referral patterns in a Canadian primary care electronic medical record database: modelling multi-level count data. J Innov Health Inform. 2017;24(4):311–316.
http://dx.doi.org/10.14236/jhi.v24i3.888
Copyright © 2017 The Author(s). Published by BCS, The Chartered Institute for IT under Creative Commons license http://creativecommons.org/licenses/by/4.0/
Author address for correspondence:
Bridget L. Ryan 1151 Richmond Street
Centre for Studies in Family Medicine Western Centre for Public Health and Family Medicine
Western University London,
ON N6A 3K7, Canada Email: [email protected]
Accepted November 2017
on September 12, 2020 by guest. Protected by copyright.
INTRODUCTION
This retrospective cohort study described referral patterns from family physicians (FPs) to other medical specialties. Patterns of referrals reflect standards of care, physician prac-tice scope and patient expectations, and are influenced by policy,1,2 geography,3 physician4 and patient characteristics.3, 5, 6 Most variability in referral rates arises from the patient.3, 5, 6 Clinical factors such as chronic conditions are of particular
importance.4,7 Primary care electronic medical record (EMR)
databases are ideally suited to explore these clinical influ-ences. Unlike registries or health administrative databases, primary care EMRs are clinically comprehensive and contain patient data unavailable elsewhere.
In order to take advantage of the rich data available in EMRs, appropriate statistical modelling must be employed. There are many outcomes in primary care research that take the form of counts; for example, physician visits, refer-rals to other providers, chronic conditions, medications and diagnostic tests. Logistic regression, where counts are dichotomised, is often used to model these data. While not incorrect, dichotomizing always results in the loss of valuable information.8 An alternative that maintains the variation in the
outcome is to use a multi-variable technique such as Poisson regression which can model count data. One assumption of the Poisson distribution is that the mean and variance are the same. However, primary care data are often over-dispersed (with a large number of zero counts in the data), meaning that this assumption is not met. For example, in modelling the number of FP visits made by a population in a year, there will be many people who do not visit at all, some who visit only once or twice, and progressively smaller numbers of people with more visits. Poisson regression is not appropriate in this situation. The negative binomial distribution is more flexible and is well suited to handle over-dispersed data.9
Further complicating the study of primary care count vari-ables is the fact that much of primary care data are collected about patients within practice settings. This is especially true in the growing area of EMR database research, where patient level data are collected for many practices. This clustering of the data must be accounted for, using for example, multi-level
modelling techniques which allow for the apportioning of vari-ance between patient and practice levels. Until recently, there was no readily available software that could perform multi-level negative binomial regression, a technique that can both properly model over-dispersed count data and account for the clustering of individual patient level data within practice settings. With the recent inclusion of multi-level negative binomial regression in statistical software packages, its use has grown in popularity.10
This paper provides an illustration of multi-level negative binomial regression which models over-dispersed health care count data (the number of referrals) and accounts for the clustering of patients within practices. The methodologic insights gained from this study have relevance to future stud-ies on many research questions that utilise count data, both within primary care and broader health services research.
METHODS
Setting and sample
This study used data from the Canadian Primary Care Sentinel Surveillance Network (CPCSSN), a national data- base of de-identified primary care EMRs. Eleven practice-based primary care networks contribute patient data from seven provinces and one territory which is merged into a single structured database. For this study, a five-year period of data, from 1 July 2007 to 30 June 2012, was extracted and contained the patient EMRs from five prov-inces, nine networks, and 57 practice sites with a total of 177,093 patients.
At the time of the extract, not all practice sites were con-tributing referral data. As well, some sites were not contribut-ing useable data for the variables of interest for this study. In order to exclude the practice sites with missing or incomplete data, a conservative criterion was set. Practice sites with more than 10% of their referrals of an unknown type were excluded from the analysis. At some practice sites, the EMR referral field is used to record both outgoing referrals and incoming consultations. Therefore, criteria described elsewhere were applied to distinguish outgoing FP-generated referrals from incoming medical specialist consultant letters.11
age, FP visits and the number of chronic conditions (p < 0.0001). Overall, 14% of the variance in referrals could be attributed to the practice level, and 86% to patient level characteristics.
Conclusions Both the patient and practice characteristics influenced referral pat-terns. The methodologic insights gained from this study have relevance to future studies on many research questions that utilise count data, both within primary care and broader health services research. The utility of the CPCSSN database will con-tinue to increase in tandem with data quality improvements, providing a valuable resource to study Canadian referral patterns over time.
Keywords: primary health care, referral and consultation, electronic medical records, multi-level negative binomial regression modelling
on September 12, 2020 by guest. Protected by copyright.
http://informatics.bmj.com/
Within the eligible practice sites, a cohort of patients was selected with at least two in-office visits at least 12 months apart, and complete sex and age information. Within this patient cohort, medical referrals were identified.
Analyses
Analyses were conducted in Stata 13.12 For the descriptive
analysis, the mean annual number of referrals per patient per year was described across patient-level factors: sex, age group, the total number of the eight CPCSSN validated chronic conditions (diabetes, hypertension, chronic obstruc-tive pulmonary disease, depression, osteoarthritis, epilepsy, Parkinson’s disease and dementia),13 and the number of
FP visits. The mean annual number of referrals per patient per year was also described for urban and rural practices, defined as the forward sortation area (first three digits of the postal code)14 which was the only practice-level factor
avail-able in the data.
For the multi-variable analyses, the outcome was the total number of referrals for each patient and was modelled as a count variable. Sex was a categorical factor and the remain-ing patient factors were modelled as continuous: age, the total number of conditions and the total number of FP vis-its. The urban/rural practice site factor was modelled as a categorical variable. Some patients had visits more than 12 months apart, increasing their exposure to receive a referral. To account for the unequal length of time patients appeared in the EMR data, exposure time in months between first and last visit in the time period was included as a variable in the model. The multi-level model was built as a series of steps that explored the clustering of patients (level 1) within practice sites (level 2) and examined the fixed effects of the patient factors.
Step 1. Testing the variance in referral rates
across practice sites
An empty (that is, with no explanatory factors) mixed effects model was run to determine the proportion of variance in the overall referral rate accounted for by the patient and practice levels. This model represented the total variance in the num-ber of referrals between the practice sites and was expressed as the intra-class correlation coefficient of 0.14. This indi-cated that 14% of the variance in referrals could be attributed to the practice level.
Step 2. Selecting a modelling distribution
The mean number of referrals per patient was 0.9, and the variance was 1.83 across practice sites, violating the assumption of the Poisson distribution that the mean and the variance are equal. To test the improvement of the negative binomial over the Poisson, empty models (controlling only for the unequal exposure times of the patients) using each distribution were compared using a likelihood ratio (LR) test with one degree of freedom and a critical chi square value of 11.96. This test was found to be significant (LR = 5024.59
and p < 0.0001). In addition, the extra parameter (/ln alpha) modelling the dispersion of the outcome variable in the negative binomial model was significant (p-value = 0.0001), indicating the appropriateness of the negative binomial dis-tribution for this study.
Step 3. Modelling individual fixed effects of patient
level factors
The individual fixed effects of each of the patient level fac-tors were tested separately, and then included in a full model with all the factors. Coefficients were expressed as incidence rate ratios, and a 95% confidence interval was constructed around all parameters. LR test results found each factor to be a significant improvement over the empty model (results not shown).
A secondary objective at this step in the modelling was to assess whether the count of chronic conditions appeared to be a reasonable representation of the morbidity burden for these patients. Each of the eight CPCSSN-validated condi-tions was added into the model. All were found to be highly significant predictors of an increase in the incidence rate ratio of referrals (results not shown), suggesting that no one chronic condition was more influential in driving referrals. Therefore, to preserve the parsimony of the model, the total number of conditions (0 through 8), rather than individual conditions, was used as a patient-level factor.
Step 4. Modelling practice-level factors
To determine whether the urban/rural practice-level factor improved the model fit, it was included in the full model at level 2. The LR test compared the full model with and without this characteristic, and the inclusion of this level 2 factor was not a significant improvement over the full model. Thus, the final model did not include this additional practice-level factor.
RESULTS
Table 1 shows the location of the eligible practice sites across the provinces and networks and the number of patients within each.
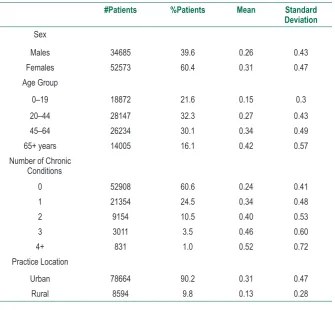
There were 78,731 medical referrals during the study period for 87,258 patients from 28 eligible practice sites. The mean exposure time (first visit to the end of data period) was 39.6 months [Standard Deviation (SD) = 13.5]. Referral rates ranged across practice sites from 0.06 to 0.71 referrals/ patient/year. The mean number of referrals was 0.29 refer- rals/patient/year (SD = 0.46). Table 2 reports the mean refer-ral rates across patient-level variables. Patients had a mean of 14.6 FP visits (SD = 13.3).
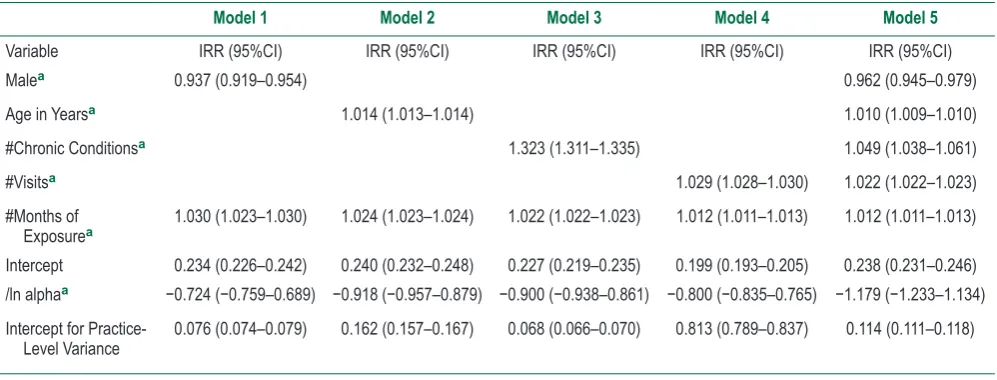
Table 3 reports the independent effects of each patient-level variable and the full model. Males were less likely to have as many referrals as females, and the probability of referrals increased with age, the total number of chronic con-ditions and the number of FP visits.
on September 12, 2020 by guest. Protected by copyright.
http://informatics.bmj.com/
#Patients %Patients Mean Standard Deviation
Sex
Males 34685 39.6 0.26 0.43
Females 52573 60.4 0.31 0.47
Age Group
0–19 18872 21.6 0.15 0.3
20–44 28147 32.3 0.27 0.43
45–64 26234 30.1 0.34 0.49
65+ years 14005 16.1 0.42 0.57
Number of Chronic Conditions
0 52908 60.6 0.24 0.41
1 21354 24.5 0.34 0.48
2 9154 10.5 0.40 0.53
3 3011 3.5 0.46 0.60
4+ 831 1.0 0.52 0.72
Practice Location
Urban 78664 90.2 0.31 0.47
Rural 8594 9.8 0.13 0.28
Table 2 Mean number of referrals per 12-month period in the DELPHI database (1 July 2007–30 June 2012), n = 87258 patients
Total in Network Total Included in the Study
#Sites #Patientsa #Sitesb #Patientsa
British Columbia Primary Care
Research Network (BCPCReN) British Columbia Vancouver, University of British Columbia 1 6541 1 6541
Alberta Family Practice Research
Network (AFPRN) Alberta Edmonton, University of Alberta 5 16083 1 4602
Southern Alberta Primary Care
Research Network (SAPCReN) Alberta Calgary, University of Calgary 5 21078 2 16275
Manitoba Primary Care Research
Network (MaPCReN) Manitoba Winnipeg, University of Manitoba 3 16828 0 0 Deliver Primary Healthcare
Information Project (DELPHI) Ontario London, Western University 8 14969 8 14966
University of Toronto Practice Based
Research Network (UTOPIAN) Ontario Toronto, University of Toronto 13 34441 12 33148
Eastern Ontario Network (EON) Ontario Kingston, Queen’s University 2 17831 0 0 Maritime Family Practice Research
Network (MARNET-FP) Nova Scotia Halifax, Dalhousie University 13 27823 0 0
Atlantic Practice Based Research
Network (APBRN) Newfoundland and Labrador St. John’s, Memorial University of Newfoundland 7 21499 4 11726
Total 57 177093 28 87258
Table 1 Networks and practice sites in the Canadian Primary Care Sentinel Surveillance Network (1 July 2007–30 June 2012)
aPatients with 2+ visits within a 12+ month period, and no missing data on age and sex.
bSites were required to have >=90% of their referrals with a description of the type of referral being made were included.
Note. Some practice sites and entire networks without any referral information were excluded.
on September 12, 2020 by guest. Protected by copyright.
http://informatics.bmj.com/
DISCUSSION
Using multi-level negative binomial regression to account for over-dispersion of data, this study demonstrated statistical modelling that will allow for a more refined understanding of the influence of patient, physician, practice and jurisdictional levels on referrals. While this study extends our statistical modelling for primary care count data, there were limitations in the application of our model.
The number of level 2 groups (practice sites) was not large enough to guarantee unbiased estimates in a multi-level model. Several researchers have used Monte Carlo simulations to investigate the effects of level 1 and level 2 sample sizes on the precision of variance components, esti-mates and standard errors.15 While there is some
disagree-ment over the robustness of fixed and random effects,16
there are similar findings that the standard errors are gener-ally underestimated when the number of groups is below 50 and the model is complex, with additional parameters and a non-linear distribution (such as the negative binomial distri-bution we have used).17 For a more thorough explanation of
cluster robust inference, the reader is referred to Cameron and Miller.18
Regarding representativeness of the data, the current age and sex of the CPCSSN database have been found to be somewhat representative of the Canadian population as measured by the Canadian census.19 Further, for this
study in particular, missing or incomplete referrals data for half of the sites prevented modelling at the regional level in the current study and resulted in over-representation of one region, limiting generalizability. Therefore, improvements in the completeness of EMR data are needed in order to model additional levels in the analysis of count data.
Table 3 Multi-level negative binomial regression models showing the association of patient-level characteristics with the total number of referrals in the CPCSSN database between 1 July 2007–30 June 2012 (n = 28 practices and n = 87258 patients)
Model 1 Model 2 Model 3 Model 4 Model 5
Variable IRR (95%CI) IRR (95%CI) IRR (95%CI) IRR (95%CI) IRR (95%CI)
Malea 0.937 (0.919–0.954) 0.962 (0.945–0.979)
Age in Yearsa 1.014 (1.013–1.014) 1.010 (1.009–1.010)
#Chronic Conditionsa 1.323 (1.311–1.335) 1.049 (1.038–1.061)
#Visitsa 1.029 (1.028–1.030) 1.022 (1.022–1.023)
#Months of
Exposurea 1.030 (1.023–1.030) 1.024 (1.023–1.024) 1.022 (1.022–1.023) 1.012 (1.011–1.013) 1.012 (1.011–1.013)
Intercept 0.234 (0.226–0.242) 0.240 (0.232–0.248) 0.227 (0.219–0.235) 0.199 (0.193–0.205) 0.238 (0.231–0.246) /ln alphaa −0.724 (−0.759–0.689) −0.918 (−0.957–0.879) −0.900 (−0.938–0.861) −0.800 (−0.835–0.765) −1.179 (−1.233–1.134)
Intercept for Practice-
Level Variance 0.076 (0.074–0.079) 0.162 (0.157–0.167) 0.068 (0.066–0.070) 0.813 (0.789–0.837) 0.114 (0.111–0.118)
Note. IRR = incidence rate ratio; CI = confidence interval.
/ln alpha is an added parameter to model over-dispersion of the outcome variable, and its significance indicates the need for negative binomial modelling.
Intercept for practice-level variance is a variance parameter for nesting of patients within practices.
aP < 0.001 for this parameter across all models.
In addition, the distribution of practice locations was unbal-anced with over 90% of the sites urban. This may have limited the improvement in the multi-level model when we included this practice-level factor. Other practice-level factors were not measured, including an analysis by province, as several sites within provinces were ineligible for inclusion in the study, and the remaining sample was predominantly from Ontario. Improvements in our ability to capture accurate practice-level characteristics are needed to model levels beyond the indi-vidual patient level.
The overall referral rate (0.29 referrals/year/patient) was lower than two regional Canadian studies (0.563 and 0.466).
While this may be attributable to time effects, differences in referral practice by jurisdiction, and/or differences in patient populations, it is likely that this reflects the effect of missing and/or incomplete data from some practice sites. Despite the lower referral rate, the model was consistent with previous research,3–5 where referral rates increased with patient age,
female sex and more exposure to the physician through FP visits where a referral might occur. To our knowledge, this is the first referrals study to account for multiple chronic conditions. Unsurprisingly, the number of medical referrals increased with morbidity level.
Despite its limitations, the analysis conducted in this paper is a major step forward in the methods used to under-stand EMR data reported in the primary care literature.6,20
This multi-level negative binomial analysis can serve as an illustration for the modelling of myriad count outcomes that are important in primary and other healthcare research. In particular, researchers using pooled EMR data from several practice sites should employ multi-level modelling to account for the clustering of these data. As the accuracy and com-pleteness of EMR data improve over time, the power of these analytic techniques will further increase.
on September 12, 2020 by guest. Protected by copyright.
http://informatics.bmj.com/
10. Sellers KF and Shmueli G. Data dispersion: now you see it… now you don’t. Communications in Statistics – Theory and Methods 2013;42:3134–47. Available at: https://doi.org/10.108 0/03610926.2011.621575.
11. Maddocks H, Ryan BL, Shadd J, Chevendra V and Terry A. Identifying new referrals from FPs using EMRs. Sentinel
Eye Series. Canadian Family Physician 2014;60:949.
PMid:25316751; PMCid:PMC4196822.
12. StataCorp. Stata Statistical Software: Release 13. College Station, TX: StataCorp LP, 2013.
13. Williamson T, Birtwhistle R, Khan S, Garies S, Wong S, Natarajan N, et al. Validating the 8 CPCSSN case defini -tions for chronic disease surveillance in a primary care data-base of electronic health records. Annals of Family Medicine
2014;12(4):367–72. Available at: https://doi.org/10.1370/ afm.1644. PMid:25024246; PMCid:PMC4096475.
14. Statistics Canada. Postal Code Conversion File. Ottawa, Canada: Statistics Canada, Data Liberation Initiative, 2006. 15. Paccagnella O. Sample size and accuracy of estimates
in multilevel models: new simulation results. European Journal of Research Methods for the Behavioral and Social Sciences 2011;7(3):111–20. Available at: https://doi. org/10.1027/1614-2241/a000029.
16. Moineddin R, Matheson FI and Glazier RH. A simulation study of sample size for multilevel logistic regression models. BMC Medical Research Methodology 2007;7:34. Available at: https:// doi.org/10.1186/1471-2288-7-34.
17. Bryan ML and Jenkins SP. Multilevel modelling of country effects: a cautionary tale. European Sociological Review 2016;32(1):3–22. Available at: https://doi.org/10.1093/esr/jcv059.
18. Cameron AC and Miller DL. A practitioner’s guide to cluster-robust inference. The Journal of Human Resources 2015;50(2):317– 370. Available at: https://doi.org/10.3368/jhr.50.2.317.
19. Queenan JA, Williamson TW, Khan S, Drummond N, Garies S, Morkem R, et al. Representativeness of patients and providers in the Canadian Primary Care Sentinel Surveillance Network: a cross-sectional study. CMAJ Open 2016;4(1):E28–32. Available at: https://doi.org/10.9778/cmajo.20140128. PMid:27331051; PMCid:PMC4866925.
20. Spriensma AS, Hajos TRS, de Boer MR, Heymans MW and Twisk JWR. A new approach to analyse longitudinal epidemio-logical data with an excess of zeros. BMC Medical Research Methodology 2016;13(21):1–7.
REFERENCES
1. Forrest CB, Majeed A, Weiner JP, Carroll K and Bindman AB. Comparison of specialty referral rates in the United Kingdom and the United States: retrospective cohort analysis. BMJ
2002;325:370–71. Available at: https://doi.org/10.1136/ bmj.325.7360.370. PMid:12183310; PMCid:PMC117891. 2. Forrest CB, Nutting P, Werner JJ, Starfield B, von SS and
Rohde C. Managed health plan effects on the specialty referral process: results from the Ambulatory Sentinel Practice Network referral study. Medical Care 2003;41(2):242–53. Available at: https://doi.org/10.1097/00005650-200302000-00006. Available at: https://doi.org/10.1097/01.MLR.0000044903.91168.B6. PMid:12555052.
3. Chan BTB and Austin PC. Patient, physician, and com-munity factors affecting referrals to specialists in Ontario, Canada. Medical Care 2003;41:500–11. Available at: https:// doi.org/10.1097/00005650-200304000-00006. Available at: https://doi.org/10.1097/01.MLR.0000053971.89707.97. PMid:12665714.
4. Franks P, Williams GC, Zwanziger J, Mooney C and Sorbero M. Why do physicians vary so widely in their referral rates?
Journal of General Internal Medicine 2000;15(3):163–68. Available at: https://doi.org/10.1046/j.1525-1497.2000.04079.x. PMid:10718896; PMCid:PMC1495354.
5. O’Donnell CA. Variation in GP referral rates: what can we learn from the literature? Family Practice 2000;7(6):462–71. Available at: https://doi.org/10.1093/fampra/17.6.462
6. Shadd JD, Ryan BL, Maddocks H and Thind A. Patterns of referral in a Canadian primary care electronic health record database: retrospective cross-sectional analysis. Informatics in Primary Care 2011;19:217–23. Available at: https://doi. org/10.14236/jhi.v19i4.816.
7. Sullivan CO, Omar RZ, Ambler G and Majeed A. Case-mix and variation in specialist referrals in general practice. British Journal of General Practice 2005;55(516):529–33. PMid:16004738; PMCid:PMC1472770.
8. Owen SV and Froman RD. Why carve up your continuous data?
Research in Nursing & Health 2005;28(6):496–503. Available at: https://doi.org/10.1002/nur.20107 PMid:16287057.
9. Crotteau JS, Ritchie MW and Varner JM. A mixed-effects heterogeneous negative binomial model for postfire conifer regeneration in Northeastern California, USA. Forest Science
2014;60(2):275–87. Available at: https://doi.org/10.5849/ forsci.12-089.
on September 12, 2020 by guest. Protected by copyright.
http://informatics.bmj.com/