The International Journal of Environmental Resources Research
Vol. 1, No. 1, January 2013
GUASNR
Optimization of Agricultural BMPs Using a Parallel
Computing Based Multi-Objective Optimization Algorithm
Y. Liu1*, H. Shen2, W. Yang1, J. Yang2
1Department of Geography, University of Guelph 2
Singapore-MIT, Singapore
Received: August 2012 Accepted: December 2012
Abstract1
Beneficial Management Practices (BMPs) are important measures for reducing agricultural non-point source (NPS) pollution. However, selection of BMPs for placement in a watershed requires optimizing available resources to maximize possible water quality benefits. Due to its iterative nature, the optimization typically takes a long time to achieve the BMP trade-off results which is not desirable in practice. In this study, an optimization model, consisting of a multi-objective genetic algorithm, ε-NSGA-II, in combination with the Soil Water and Assessment Tool (SWAT) and the parallel computation technique, is developed and tested in the Fairchild Creek watershed in southern Ontario of Canada. The two objectives are to minimize BMPs costs and maximize total phosphorous load reduction. The parallel computation allows the run of multiple SWAT models simultaneously and can reduce the ε-NSGA-II optimization time significantly to achieve the objective. The Pareto-optimal fronts generated between the two objective functions can be used to achieve desired water quality goals with minimum BMP implementation cost to support spatial watershed management and policy making.
Keywords: Agricultural BMPs; ε-NSGA-II; Parallel computation; Spatial optimization; SWAT
*
1. Introduction
In landscapes with intensive agriculture, there have been serious environmental problems such as soil erosion, groundwater pollution, and eutrophication due to non-point sources (NPS) pollution in rivers and lakes. In order to mitigate the adverse environmental effects of agricultural production, various conservation programs or regulations have been established to implement Beneficial Management Practices (BMPs) such as conservation tillage, nutrient management, and buffer strip. Though the study of BMPs has a long history, only until recent years there has been a practical progress in integrated evaluation of agricultural BMPs, e.g., the USDA Conservation Effects Assessment Program (CEAP, 2012), and the Watershed Evaluation of BMPs (WEBs, 2012) program in Canada.
For policy and management purposes, it is critical to evaluate both the economic costs and water quality benefits of these BMPs in order to target locations for BMP implementation to achieve cost effectiveness. One typical approach is to apply mathematical programming algorithms to link economic and hydrologic models (e.g. Wu et al., 2006; Srivastava et al., 2003). These integration studies examined the cost effectiveness of single a BMP based on a single objective function that either minimized costs or maximized benefits. In recent years, genetic algorithms have been applied to integrate economic and hydrologic models, enabling the examination of the placement of multiple BMPs in agricultural watersheds based on a multi-objective function that optimizes both economic and water quality benefits (e.g. Rodríguez et al., 2011; Maringanti et al.,
2011; Gitau et al., 2004). Genetic algorithms allow the evaluation of numerous combinations of BMPs, leading to a more realistic evaluation of the cost effectiveness of conservation programs. These approaches include NSGA-II (Deb et al., 2002), eMOEA (Tan et al., 2003), SPEA2 (Zitzler et al., 2003), MOSCEM-UA (Vrugt et al., 2003), and ε-NSGA-IIKollat and Reed (2006). According to Kollat and Reed (2006) and Tang et al. (2007), the ε-NSGAII greatly exceeds the performance of the NSGA-II, eMOEA, SPEA2, and MOSCEM-UA. In addition,
the ε-NSGA-II includes adaptive population size and automatically termination
conditions. Typically, ε-NSGA-II provides a trade-off (Pareto-optimal front) between multiple conflicting objective functions. The generated Pareto-optimal fronts can be used by decision makers to select a solution from an ensemble of solutions that will meet the economical constraint while generating the best possible environmentally effective solution in the watershed (Maringanti et al., 2009).
Assessment Tool (SWAT). This paper first describes the proposed methodology, including definition of the multi-objective function, ε-NSGA-II algorithm, and parallel computation within a super computer system, and then presents an application of the proposed approach including optimization results and discussions in the Fairchild Creek watershed in southern Ontario, Canada.
2. Materials and Methods
2.1. Definition of Objective Functions
The two objectives formulated in this study are to minimize BMPs cost and to minimize the TP load, which is simulated using the SWAT model. A multi-objective optimization problem can be formulated as:
)
0
,
0
,...,
0
,
0
(
))
(
),
(
),...,
(
),
(
(
)
(
.
.
))
(
),
(
),...,
(
),
(
(
)
(
min
2 1 2 1
X
g
X
g
X
g
X
g
X
G
t
s
X
f
X
f
X
f
X
f
X
F
l i m i (1)where
X
(
x
1,
x
2,...,
x
n)
is an n-dimensional variable to be optimized,f
i(
X
)
is the ith objective function,g
i(
X
)
is the ith constraint condition, and X stands for a BMP application scheme. For a single BMP evaluation, X takes a Boolean value, i.e. either 0 or 1.For multiple BMP evaluation, e.g. three BMPs, X takes binary values of 000, 001, 010, 011, 100, 101, 110, and 111. The relative change of a contaminant loading output with X compared to its corresponding value at the baseline scenario can be an indicator of the environmental benefit, and can be expressed as:)
(
)
(
)
(
)
(
0
0
V
V
X
V
X
f
V
(2)Where V(X) denotes the TP loading at the watershed outlet, for a BMP application scheme, and V(0) is the contaminant loading at the baseline condition without BMP implementation. The total BMP area,
f
A, for a BMP application scheme(ha) can be expressed as:
i ik i
A
X
k
A
x
f
(
,
)
(3)Where
A
i is the area of ith hydrologic response unit (HRU) in SWAT, andx
ikisa Boolean value representing the kth BMP scheme applied to the ith unit. The value 1 indicates the given HRU with BMP application and 0 without BMP application. For the convenience of computation, the area of the unit,A
i, is computed as a percentage of the entire watershed area. The economic cost of a BMP implementation scheme can be estimated as:
k A k
c
X
w
f
X
k
Where
w
kis the BMP cost per unit area ($/ha), andf
c(
X
)
is the total cost ($) for the BMP application scheme. Three BMPs, buffer strip, conservation tillage, and fertilizer reduction, are evaluated in this study.2.2. The ε-NSGA-II Algorithm
NSGA-II is a mimic of natural selection. To select the better one between two different individuals, two metrics, rank and crowding distance, are computed for each individual in current population. To define a rank value for each individual, the non-dominated individuals are all set to rank 1, which form the first front. Except the individuals in the first front, the remaining non-dominated individuals are set to rank 2, which are the individuals in the second front. Likewise, each individual is set to a rank value. The calculation of the crowding distance of each individual can be found in Deb (2002). To evolve a generation, three operators are applied on the individuals, selection, crossover and mutation. In the selection process, for two individuals, the one with smaller rank value is considered to outperform the other. If the two individuals have the same rank value, the one with higher crowding distance is selected.
ε-NSGA-II is developed on the top of NSGA-II, and is viewed as ‘connected runs’ of NSGA-II. The new feature added to NSGA-II is the ‘ε-dominance archive’, which records the non-dominated individuals among different generations
in a run. Within each generation, a parameter, ε, for each objective is prescribed. The ε vector of the objectives splits the search space to grids. Within each grid, if multiple individuals exist, only the one closest to the bottom left corner is added to
the archive. Detailed descriptions of ε-NSGA-II can be found in Kollat and Reed (2006).
2.3. Parallel Computation
evenly in current generation to the model simulation processors, and gathering objectives values from each processor after they are evaluated.
Each SWAT model simulation processors corresponds to a folder, and each folder may need to deal with single or multiple individuals, depending on the number of individuals allocated by the rank 0 processor. With a single individual, the process to compute TP is: 1) modify the SWAT input files according to this individual, 2) run the SWAT executable file, and 3) extract the SWAT output file to calculate TP. In the case of multiple individuals, the individuals are evaluated one by one in sequence following the same steps in evaluating a single individual. After the individuals in current generation are evaluated, their corresponding TP and cost values are sent back to rank 0 for evolution. The individuals in current
population of ε-NSGA-II are allocated evenly to N-1 processors with the MPI Scatter function, where N is the number of available processors. One of these processors (rank 0) is in charge of selection, crossover, and mutation. The ε -NSGA-II applies dynamic population size in different “connected” -NSGA-II runs, therefore it is possible that a population size is not dividable by (N-1).In such a case, the number of individuals is calculated as the smallest integer greater than the result of population size divided by (N-1).
2.4. Applications
2.4.1. The Study Area and Data Availability
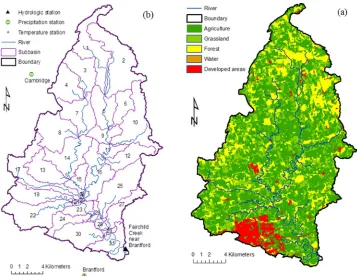
The Fairchild Creek watershed, draining 355 km2at the outlet station (Figure 1), is located in the central part of the Grand River Basin in Ontario, Canada. Topography of the watershed is relatively flat with 90% of the area having slopes less than five degrees. Soils are mainly loams and silt loams. About 64% of the area is for agriculture (Figure 1a), followed by forest (21%), pasture (9%), urban (5%), and open water (1%). The typical crop rotation in the region is corn, soybean, and winter wheat. The study area has a temperate climate with a relative cold winter. Based on the climate data collected during 1990-2005, mean annual temperature is 8.0°C in the watershed, average annual precipitation is 940 mm, and average annual runoff is 277 mm.
Figure 1. Land use (a) and watershed delineation (b) of the Fairchild Creek watershed
2.4.2. SWAT Setup and Calibration
Using a threshold value of 710ha, the watershed was divided into 31 sub-basins with sub-basin areas ranging from 12 to 280 ha (Figure 1b). Based on the land use and soil GIS layers, these sub-basins were further divided into HRUs using threshold of land use (20%) and soil (10%), which resulted in 157 HRUs in total with an average HRU area of 226 ha. Slope was not used for the HRU deviation because of the flat landscape in the watershed. The management inputs for crop HRUs were setup based on the OMAFRA statistical information with a three-year crop rotation, wheat, corn, and soybean.
data available at the outlet monitoring station, calibration and validation of TP were implemented manually. A comparison of observed and simulated monthly flow at the watershed outlet is shown in Figure 2. The long term water balance was very well estimated as demonstrated by the model bias where 0.03 is for calibration period and -0.05 for validation period. High monthly NSC values, 0.82 and 0.87, were obtained for both calibration and validation period. However, the daily flow was relatively poorly reproduced with NSC values of 0.56 and 0.54 respectively for the calibration and validation period but still in acceptable range. Because the grab sampling TP data represented an instantaneous concentration of TP, only manual calibration and validation were performed by comparing the simulated TP with observed data at the watershed outlet. In general, the simulated TP appeared to agree with the measurements. The simulated annual TP yield was 0.6 kg/ha/yr, corresponding to 21,300 kg/yr at the watershed outlet under the existing BMP condition.
Figure 2. Observed and simulated average monthly discharge at the watershed outlet
2.4.3. BMPs Characterization and Scenario Design
scenario for SWAT calibration. If it is selected, the application rate of fertilizer will reduced by 1/3 or 1/2 based on the crop type and rotation.
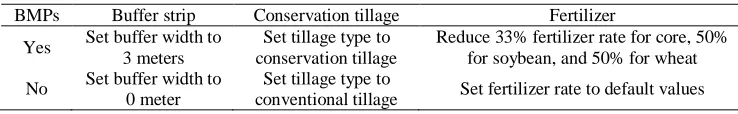
Table 1. Characterization of BMPs in the SWAT model
BMPs Buffer strip Conservation tillage Fertilizer
Yes Set buffer width to 3 meters
Set tillage type to conservation tillage
Reduce 33% fertilizer rate for core, 50% for soybean, and 50% for wheat
No Set buffer width to 0 meter
Set tillage type to
conventional tillage Set fertilizer rate to default values
Four BMP scenarios are evaluated in the ε-NSGA-II optimization with an objective of TP reduction: (1) a single BMP of buffer strip, (2) a single BMP of conservation tillage, (3) a single BMP of fertilizer reduction, and (4) multiple BMPs of the three. The SWAT model for the Fairchild watershed consists of 87 crop HRUs. Accordingly, one individual in a population is represented by a vector of size 1/87, and each individual element represents a setting of the three BMPs within a HRU. Scenarios 1 to 3 utilize the same procedure to encode an individual element value. The element values are either 0 or 1. 0 represents no BMP operation, and 1 represents BMP operations to all crop HRUs. For the 4th BMP scenario, three steps are conducted to parse the element value: (1) rounding it to its nearest integer, (2) converting this integer to a binary of three digits, and (3) interpreting each digit with “Yes/No” BMP setting. For example, if an individual element value is 5.3, it is firstly rounded to 5, and then converted to a three digit binary ‘101’. The first number, ‘1’, indicates the setting of buffer strip is “Yes”, the middle number, ‘0’, represents that no conservation tillage is implemented, and the last number, ‘1’, indicates the BMP of fertilizer reduction is implemented in the HRU. If all BMPs are implemented, the corresponding three-digit is ‘111’corresponding to a number of 7 in its decimal form. In the case of no BMP operation, the three-digit is ‘000’ corresponding to a number of 0 in its decimal form. Thus, the range of the element value is [0, 7], and is the same as individual BMP scenarios.
3. Results and Discussion
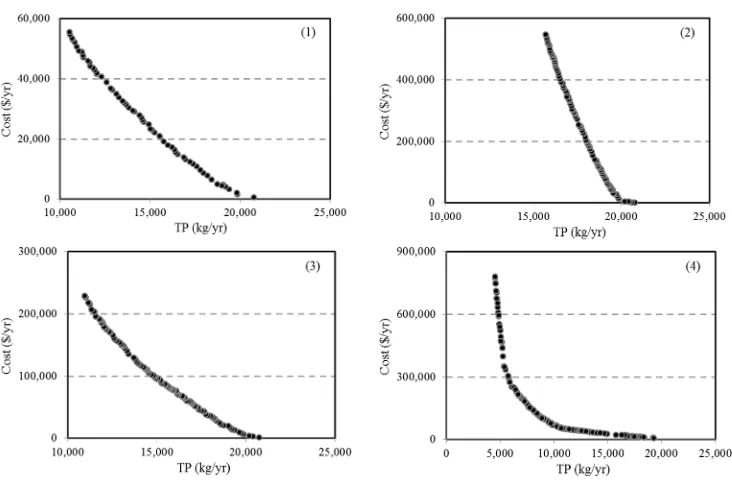
All three Pareto fronts show that economic cost increases with TP reduction, and the buffer strip BMP is more cost-effective than fertilizer reduction and conservation tillage. For the BMP scenarios of 100% application in cropland areas, buffer strip may reduce TP yield at the watershed outlet by 50.7% from 21,300 to 10,500 kg/yr with a total cost of $55,500. Conservation tillage may reduce TP yield by 26.3% to 15,700 kg/yr with cost of $545,000, and fertilizer reduction may reduce TP yield by 34.7% to 13,900 kg/yr with a total cost of $123,000. The corresponding cost-benefit ratios for the TP reductions are 5.14, 97.3, and 16.6 $/kg/yr respectively. If we set a 20% TP reduction objective at the outlet (4,260 kg/yr), the cost for buffer strip would be $13,000, conservation tillage $343,000, and fertilizer reduction $55,000, corresponding cost-benefit ratios of 3.02, 79.8, and 12.8 $/kg/yr respectively. This indicates that the cost-benefit ratio decreases with the TP reduction objective. The BMPs would be more cost effective for a low TP reduction objective, and less cost effective for a high TP reduction objective. Once the solution is defined for a given TP reduction objective, the BMP distribution can be obtained by locating the croplands on the selected HRUs.
Figure 3. Pareto frontiers between TP load and economic cost for the scenarios of (1) buffer strip, (2) conservation tillage, (3) fertilizer reduction, and (4) multiple BMPs of the three
The parallel computation can effectively reduce the required computation time
and increase greatly ε-NSGA-II’s optimization efficiency. Using 30 processors on Sharcnetto optimize TP yield at the HRU level, the total CPU time for scenario 1, 2, 3, and 4 is 61.5, 69.2, 60.1, and 69.9 hours respectively, while the clock time (actual parallel computation time) is 3.70, 4.60, 4.90, and 4.10 hours with reduction efficiency of 94.0%, 93.3%, 91.8%, and 94.1% respectively. When optimizing at basin level using 30 processers, i.e. all crop HRUs are selected within the sub-basin if the sub-sub-basin is selected, the total CPU time is 27.8, 40.0, 21.8, and 27.5 hours for the four scenarios, while the clock time is 1.80, 1.80, 1.60, and 1.60 hours with reduction efficiency of 93.5%, 95.5%, 92.7%, and 94.2% respectively. These performances are dependent on the number of processers, the number of HRUs, the length of simulation period, and the TP reduction objectives. If the numbers are different, the parallel computation efficiency may differ considerably from the above values.
cost, and ε-NSGA-II operation. Therefore, the Pareto lines presented in Figure 3 may not reflect exactly the actual cost-effectiveness of the four BMP application schemes, but a demonstration of the developed parallel computing based multi-objective optimization algorithm in this study. Additional studies are required to improve the SWAT model and the BMP characterization especially the estimate of BMP cost and its variation over the watershed in order to achieve more reliable optimization results.
4. Conclusions
In this study, we developed a parallel computing based multi-objective optimization algorithm for spatial targeting of agricultural BMPs over a watershed in order to achieve cost-effective solutions. The algorithm consists of ε-NSGA-II, the SWAT model, and the parallel computation technique, and was tested in the Fairchild Creek watershed in southern Ontario of Canada. The evaluated BMPs scenarios include three individual BMPs of buffer strip, conservation tillage, and fertilizer reduction, and one multiple BMP scenario. The parallel computation
allows the run of multiple SWAT models simultaneously and can reduce the ε -NSGA-II optimization time significantly.
The case study in the Fairchild Creek watershed shows that the buffer strip is the most cost-effective BMP in reducing TP at the watershed outlet followed by fertilizer reduction and conservation tillage. For each of the BMP scenarios, the cost-benefit ratio decreases along with the increase of TP reduction at the watershed outlet, indicating the BMPs are more cost-effective when covering a small area and less cost-effective when covering a large area. The Pareto-optimal fronts generated between the two optimized objective functions can be used to achieve desired water quality goals with minimum BMP implementation cost. To reduces the optimization result uncertainties, further studies are required to
improve the SWAT model setup, parameterization, BMP characterization, and ε -NSGA-II operation.
Acknowledgements
This research is jointly supported by Ontario Ministry of Agriculture and Food (OMAFRA), Social Sciences and Humanities Research Council (SSHRC), and the Canadian AAFC WEBs project. We would like to thank Grand River Conservation Authority and Ontario Ministry of Environment for providing data.
References
CEAP: Conservation Effects Assessment Program, 2012.
http://www.nrcs.usda.gov/technical/nri/ceap/. Accessed in Oct. 2012.
Gitau, M.W., Veith, T.L., Gburek, W.J., 2004. Farm-level optimization of BMP placement for cost-effective pollution reduction. T ASAE. 47, 1923–1931.
Kollat, J.B., Reed, P., 2006. Comparing state-of-the-art evolutionary multi-objective algorithms for long-term groundwater monitoring design. Adv. Water Res. 29, 792–807. Maringanti, C., Chaubey, I., Arabi, M., Engel, B., 2011. Application of a multi-objective optimization method to provide least cost alternatives for NPS pollution control. Environ Manage.48, 448-461.
Maringanti, C., Chaubey, I., Popp, J., 2009. Development of a multi-objective optimization tool for the selection and placement of best management practices for nonpoint source pollution control. Water Res. 45, 1-15.
Reichert, P., 2006.A standard interface between simulation programs and systems analysis software. Water Sci. Technol. 53, 267-275.
Rodríguez, H.G., Popp, J., Maringanti, C., Chaubey, I., 2011. Selection and placement of best management practices used to reduce water quality degradation in Lincoln Lake watershed. Water Res. Res. 47, 1-13.
Srivastava, P., Hamlett, J.M., Robillard, P.D., 2003. Watershed optimization of agricultural best management practices: Continuous simulation versus design storms. J. AWRA. 39, 1043-1054.
Tan, K.C., Khor, E.F., Lee, T.H., Yang, Y.J., 2003. A tabu-based exploratory evolutionary algorithm for multi-objective optimization. Artif. Intell. Rev. 19, 231-260.
Tang,Y., Reed, P., Kollat, J.B., 2007. Parallelization strategies for rapid and robust evolutionary multi-objective optimization in water resources applications. Adv. Water Resour. 30, 335–353.
Vrugt, J.A., Gupta, H.V., Bastidas, L.A., Bouten, W., Sorooshian, S., 2003. Effective and efficient algorithm for multi-objective optimization of hydrologic models. Water Res. Res, 391-19.
Wu, J., Yu, S.L., Zou, R., 2006. A water quality-based approach to watershed wide BMP strategies. J Am Water Res. As. 42, 1193-1204.