http://www.scirp.org/journal/wjnse ISSN Online: 2161-4962 ISSN Print: 2161-4954
DOI: 10.4236/wjnse.2019.91001 Mar. 29, 2019 1 World Journal of Nano Science and Engineering
A Comparative Study of Force Measurements in
Solution Using Micron and Nano Size Probe
Diganta Dutta1*, Roman Schmidt1, Samodha C. Fernando2, Indrani Ghosh Dastider3
1Department of Physics and Astronomy, University of Nebraska at Kearney, Kearney, NE, USA 2Department of Animal Science, University of Nebraska-Lincoln, Lincoln, NE, USA
31709 West 38th Street, Kearney, NE-68845, Nebraska, USA
Abstract
Atomic force microscopy (AFM) is a device that is used for not only high-resolution imaging but also used for measuring forces. It is possible to quantify the surface density change for both colloid and nano probe as well as silica surface. By changing the quantity of ions within a potassium chloride solution, it then becomes possible to evaluate the quantity of ions that attach themselves to AFM colloid probe, nano probe and silica samples. In this study, the force was measured between AFM probes and silica surface in dif-ferent ionic concentrations. Two difdif-ferent types of AFM probe were used: a colloid probe with a radius of 500 nano-meters and a nano probe with a ra-dius of 10 nano-meters. This study is focused on measuring how the force magnitude, especially electrical double layer force, varied between the two types of probes by changing ionic concentrations. For all test trials, the results agreed with the electrical double layer theory. Although the micron probe was almost an exact match for all ranges, the nano probe was closest within its short-range forces. This is attributed to the formula use when analyzing the electrical double layer force. Because the formula was originally calculated for the micron probe, the shape and size of the nano probe created too many va-riables for an exact match. Along with quantifying the forces, this experiment allowed for an observation of Van der Waals force making it possible to cal-culate the Hamaker constant. Conclusively, all results show that the obtained surface charge density increases as the ionic concentration increases. In addi-tion, through the comparison of the results obtained from the nano-sized probe and the micron-sized probe, it was concluded that nano size probe mapped higher surface charge density above the silica surface than the mi-cron-sized probe under the same conditions.
Keywords
Atomic Force Microscopy, Surface Charge Density, Electrical Double Layer
How to cite this paper: Dutta, D., Schmidt, R., Dastider, I.G. and Fernando, S.C. (2019) A Comparative Study of Force Measurements in Solution Using Micron and Nano Size Probe. World Journal of Nano Science and Engineering, 9, 1-14.
https://doi.org/10.4236/wjnse.2019.91001
Received: February 2, 2019 Accepted: March 26, 2019 Published: March 29, 2019
Copyright © 2019 by author(s) and Scientific Research Publishing Inc. This work is licensed under the Creative Commons Attribution International License (CC BY 4.0).
DOI: 10.4236/wjnse.2019.91001 2 World Journal of Nano Science and Engineering
Force and Van der Waals Force
1. Introduction
DOI: 10.4236/wjnse.2019.91001 3 World Journal of Nano Science and Engineering
and silica particles in an electrolyte. They observed repulsive forces at long ranges and attractive forces when bubbles and AFM tip distance decreases.
Meagher et al. [26] investigated hydrophobic interaction forces between a modified AFM tip and a polypropylene surface within a NaCl solution. They measured the attractive interaction force when the separation distances were about 30 nm. Christenson et al. [27] measured attractive hydrophobic force be-tween two mica surfaces in divalent solutions. In their experiments they used magnesium sulfate at different ionic concentrations and they also showed inte-raction magnitude decreased with increasing ionic concentration. Parker et al., [28] investigated force measurements between AFM tips and functionalize glass surface in a NaCl solution. They showed the magnitude of the force reduced with increasing salt concentration, but the attractive force magnitude increased. Kokkoli et al. [29] found that the strength of attractive force decreased when ethanol was added to water. They also showed a hydrophobic attractive force magnitude close to the Van der Waals force when the ethanol mole fraction in-creased about 75%. Subir et al. [13] performed force measurements investigation between an AFM tip and a gold surface. Both surfaces are functionalized with bacteria. Their results showed agreement with extended DLVO theory.
Colloidal science, biomolecular transport, and drug delivery mostly used silica particles [28][30]-[37]. One of the objectives of this study is to get a fundamen-tal understanding of nano particles in a salt concentration at a very small scale. In this study, we quantify the force magnitude between micro and nano size probes against smooth flat surfaces under varying quantities of a salt solution. We also figured out the force trend in varying salt concentrations. In this study, we investigated how ions change in solutions with increasing salt concentrations. Our study shows that charge density increased with an increase of ionic concen-trations.
2. Method and Materials
DOI: 10.4236/wjnse.2019.91001 4 World Journal of Nano Science and Engineering
the sample surfaces.
2.1. Van der Waals Force
Van der Waals forces are the total of interaction forces between atoms and mo-lecular dipoles of different particles [38]. An electromagnetic field is created when two particles approached each other less than 10 nm apart and electrons moved between particles while Van der Waals force is experienced. Van der Waals forces consist of three different kinds of forces such as Keesom force, De-bey force and Dispersion force [39]. Dipole-dipole interactions between atoms or molecules are also known as Keesom forces. Another name for the Dispersion force is the London force. Dispersion forces are non-additive and bring atoms or molecules closer as well as align them. Dispersion force interacted between in-stantaneous dipole-induced dipole the most simplified approximation of the Van der Waals force between a sphere and a flat surface is [8]
2 6 vdw AR F h
= − (1)
In the above, R is the radius of the sphere, A is the Hamaker constant, and h is the separation distance.
2.2. Electrostatic Force
Due to the ionization or dissociation process, solid surfaces become charged in aqueous solutions [40]. These ions on the silica surfaces are attracted by the equal and opposite charged of the ions in liquid and are distributed very close to the silica surfaces. Consequently, an electrical double layer form between the liquid and silica surface. The thickness of this double layer depends on the ionic concentration and varies from less than a nanometer to hundreds of nanome-ters. The AFM probe also becomes charged when it is immersed in liquid.
Electrostatic force occurs when the double layer of an AFM tip overlays with the double layer of the silica surface. The electrostatic force becomes repulsive when the surface charges of the AFM tip and silica surface are similar.
The corresponding Debye length for binary z:-z electrolyte solution is
2 2 2 2 0 2e 1 B D z n k T α κ εε λ
= = . (2)
When the surface potentials or charge densities of the two objects are rela-tively low, Butt et al. [41] derived the electrical double layer force at constant potentials and surface charge densities,
(
2 2)
20
2
2 e h D e h D
EDL a b a b
D
R
F π εε λ λ
λ
− −
= Ψ Ψ − Ψ + Ψ (3)
And
(
2 2)
20
2
2 e h D e h D
D
EDL a b a b
R
F π λ σ σ λ σ σ λ
εε − −
DOI: 10.4236/wjnse.2019.91001 5 World Journal of Nano Science and Engineering
3. Results
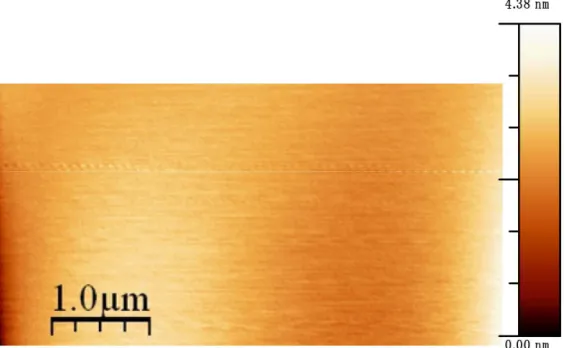
All AFM experiments were carried out by commercially available nanonics Mul-tiview-4000 multi-probe AFM. For AFM image calibration, I have done standard silicon grid imaging. The AFM scanning images were taken in air at room tem-perature. The scanning speed was 30 micron per second. We had to wait for 30 minutes to stabilize the system. Before imaging the sample surface, I checked resonance frequency and quality factors of the AFM tip. The resonance fre-quency was 31,580 Hz and quality factor was 1058. And these values were matched with the manufacture’s value. The AFM nano tip radius of curvature was 10 nm. Before doing interfacial force measurements, we examined silica surfaces roughness. The AFM scanning area is 10 × 10 µm−2. The scanning speed
was 20 microns per second. Figure 1 shows silica surface AFM topography im-age. The resolution of the AFM image is very high and its vertical resolution is less than 1 nm.
3.1. Force Measurements by Colloid Probe
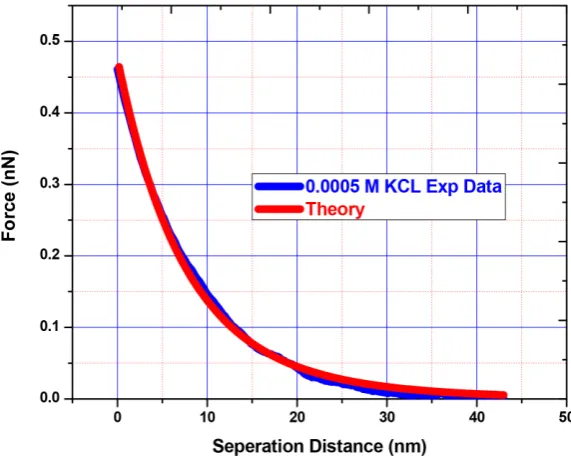
Between AFM colloid tip and silica surface in 0.0005 M KCL solution, interfacial forces were measured as shown in Figure 2. Experimental results along with theory fitted curves are given wherein the solid red line represents the theoretical results, and the solid blue line represents those of the experiment. The experi-mental curve shows a maximum force is about 13 nN, when the probe reaches the sample surface. The double layer thickness is about 13.56 nm at 0.0005 M KCL solution, and hence, the Electrical Double Layer forces are experienced when the AFM tip and the substrate are 32 nm apart. Figure 2 shows repulsive forces due to the similarly charged surfaces and also osmotic pressure of the counter-ions. In 0.0005 M KCL solution, force curve exponentially decreased with the distance of about 15 - 20 nm. The experimental curve was fitted with theoretical results using Matlab programming. The AFM tip and silica surface densities as a result of the curve fit are given in Table 1. The maximum tip sur-face charge density was −0.014398812 C/m2 and the minimum was −0.012296685
C/m2. The maximum silica surface charge density was −0.002906252 C/m2 and
the minimum value was −0.0011996 C/m2. The average and SD curve fit results
in tip and silica surface charge densities of −0.01325 (±0.00106) C/m2 and
−0.00218 (±0.00088) C/m2, respectively.
DOI: 10.4236/wjnse.2019.91001 6 World Journal of Nano Science and Engineering
Figure 1. Silicon wafer 10 × 10 µm AFM topography image.
Figure 2. Force versus separation distance experimental curve fitted with theory in 0.0005 M KCL solution using colloid probe.
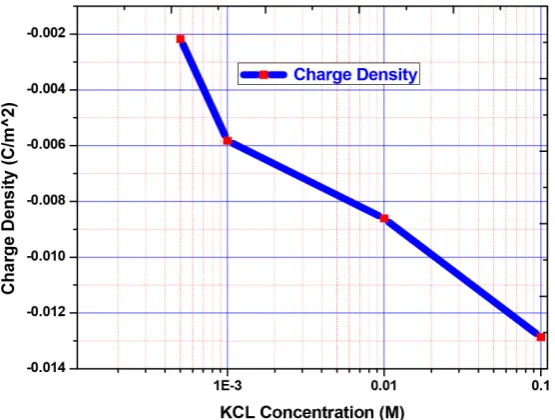
Figure 4 is of the silica surface charge density versus a differential ionic con-centration curve. The lower ionic concon-centration predicted a lower amount of charge density. In the 0.005 M KCL solution charge density is −0.00218 C/m2.
The charge density increased with increasing ionic concentration. At higher io-nic concentrations, it exhibits a higher density whereas in the 0.1 M KCL con-centration it shows that the silica surface density was −0.01287 C/m2 .
3.2. Force Measurements Using Nano Probe
[image:6.595.231.511.288.513.2]DOI: 10.4236/wjnse.2019.91001 7 World Journal of Nano Science and Engineering
Table 1. Tip and Silica surface charge density in different experiments at 0.0005 M KCL solution.
No of Experiments Tip Surface Charge Density (C/m2 )
Silica Surface Charge Density (C/m2 )
1 −0.013056099 −0.002430071 2 −0.012296685 −0.002906252
3 −0.014398812 −0.0011996
[image:7.595.235.513.482.692.2]Avg. (±SD) −0.01325 (±0.00106) −0.00218 (±0.00088)
Figure 3. Four different KCL concentrations force versus separation dis-tance experimental curve fitted with theory.
DOI: 10.4236/wjnse.2019.91001 8 World Journal of Nano Science and Engineering
solid blue line represents those of the experiment. The experimental curve shows a maximum force is about 4.5 nN, when the probe reaches to the sample surface. The double layer thickness is about 13.56 nm at 0.0005 M KCL solution, and hence, the Electrical Double Layer forces are experienced when the AFM tip and the substrate are 32 nm apart. Figure 5 shows repulsive forces due to the simi-larly charged surfaces and also osmotic pressure of the counter ions. In 0.0005 M KCL solution, force curve exponentially decreased with the distance of about 15 - 20 nm. The experimental curve was fitted with theoretical results using Matlab programming. The AFM tip and silica surface densities as a result of the curve fit are given in Table 2. The maximum tip surface charge density was −0.017313576 C/m2 and the minimum was −0.01575993 C/m2. The maximum silica surface
charge density was −0.003525419 C/m2 and the minimum value was −0.001587851
C/m2. The average and SD curve fit results in tip and silica surface charge
densi-ties of −0.01672 (±0.00084) C/m2 and −0.00263 (±0.00098) C/m2, respectively.
Figure 6 shows force versus separation distance curves fitted with theory in different KCL concentrations using nano-probe as opposed to a colloidal probe. Experimental curves were fitted with electrical double layer theory. All of the experimental curves have good agreement with theory. At 0.01 M KCL solution, the double layer thickness is about 3.06 nm and the electrical double layer forces are experienced when the AFM tip and the substrate are 6 nm apart.
[image:8.595.229.515.462.690.2]The experimental curve shows a maximum force is about 0.12 nN, when the probe reaches to the sample surface. At the lowest ionic concentration, the maximum force magnitude is about 4.5 nN.
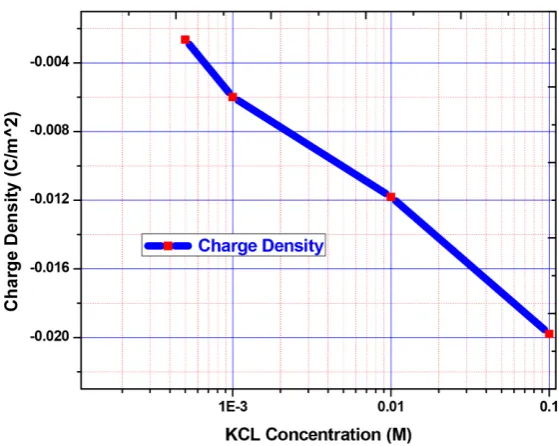
Figure 7 shows silica surface charge density versus different ionic concentra-tion curve. In the 0.0005 M KCL soluconcentra-tion charge density is −0.00263 C/m2. The
DOI: 10.4236/wjnse.2019.91001 9 World Journal of Nano Science and Engineering
Figure 6. Force versus separation distance different experimental curves fit-ted with theory in different KCL solution using nano probe.
Figure 7. Charge density versus different KCL concentrations using nano probe.
Table 2. Tip and Silica surface charge density in different experiments at 0.0005M KCL solution.
Experimental Tip Surface Charge Density (C/m2 ) Silica Surface Charge Density (C/m2 )
1 −0.017078161 −0.002777057
2 −0.017313576 −0.001587851
3 −0.01575993 −0.003525419
[image:9.595.233.513.337.560.2] [image:9.595.206.537.638.721.2]DOI: 10.4236/wjnse.2019.91001 10 World Journal of Nano Science and Engineering
[image:10.595.226.520.464.691.2]density increased with higher ionic concentration as well. 0.1 M KCL concentra-tion shows silica surface density was −0.01978 C/m2.
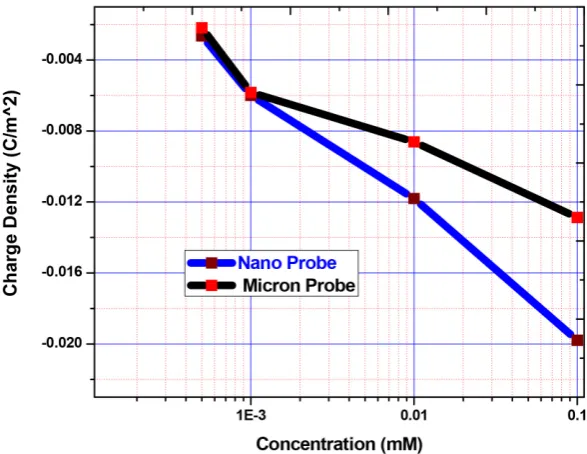
Figure 8 shows charge density measurements in different ionic concentration using different size of AFM probe. It also shows how charge density varies with-in ionic concentrations. Both the micron and nano-sized probe charge density increased with increasing of ionic concentrations. The qualitative increased of charge density with higher ionic concentrations agree with theoretical results got by Atalay et al. [40].
3.3. Van der Waals Forces in DI Water
AFM experiments were carried out in DI water by using the nano-sized AFM probe which radius of curvature is about 10 nm to measure the Van der Waals force. Figure 9 shows the force versus the separation distance in DI water, and attractive Van der Waals force is observed when the separation distance between the tip and the flat silica surface is very close. The measured force is fitted by the Van der Waals theory (symbols in Figure 9) to estimate the Hamaker constant. Based on the fit of the last part of the force curves, the estimated Hamaker con-stant is A = 1.99 × 10⁻¹⁹ J. Hu et al. [42] investigated Van der Waals force
mea-surements between silica and gold surface in DI water, and their Hamaker con-stant is A = 1.6 × 10⁻¹⁹ J, which is close to our result.
4. Conclusion
It is feasible to map the surface charge density of silica surface and AFM collide probes as well as nano probe in KCl solution. To predict how the quantity of ions would affect the acquired force and the surface change density, electrostatic
DOI: 10.4236/wjnse.2019.91001 11 World Journal of Nano Science and Engineering
Figure 9. Force versus distance curves in DI water and fit based on the Van der Waals theory.
theory was used. This theory was tested with both a micro and nano colloid probe. All the testing trials matched the theory, though the micro probe’s results coincided more with the predicted results for all ranges of force, while the nano probe’s test results were good match during the short-ranged forces. This dif-ference in accuracy can be attributed to the formula used for the test theory. In the original model, all calculations were based upon the shape and size of the micro-size probe. Along with measuring surface charge density, this experiment focused on Van der Waals force providing enough information to calculate the Hamaker constant. In an overall conclusion, data analysis from this experiment shows that the obtained surface charge density increases with the ionic concen-tration. In addition, the nano probes predict higher surface charge density above the silica surface in KCl solution than the micro-size probe.
Acknowledgements
We acknowledgement Dr. Shizhi Qian for allowing us to use AFM at Old Domi-nion University, Norfolk, VA.
Conflicts of Interest
The authors declare no conflicts of interest regarding the publication of this pa-per.
References
[1] Graham, T. (1861) X. Liquid Diffusion Applied to Analysis. Philosophical
DOI: 10.4236/wjnse.2019.91001 12 World Journal of Nano Science and Engineering https://doi.org/10.1098/rstl.1861.0011
[2] Lyklema, J. (2005) Fundamentals of Interface and Colloid Science: Soft Colloids. Vol. 5, Elsevier,Amsterdam, Netherlands.
[3] Tabor, D. and Winterton, R. (1969) The Direct Measurement of Normal and Re-tarded Van der Waals Forces. Proceedings of the Royal Society of London, Series A, 312, 435-450. https://doi.org/10.1098/rspa.1969.0169
[4] Klein, J. (1983) Forces between Mica Surfaces Bearing Adsorbed Macromolecules in Liquid Media. Journal of the Chemical Society, Faraday Transactions 1: Physical
Chemistry in Condensed Phases, 79, 99-118. https://doi.org/10.1039/f19837900099
[5] Parker, J.L.,Claesson, P.M., Wang, J.-H. and Yasuda, H.K. (1994) Surface Forces between Plasma Polymer Films. Langmuir, 10, 2766-2773.
https://doi.org/10.1021/la00020a043
[6] Parker, J., Christenson, H. and Ninham, B. (1989) Device for Measuring the Force and Separation between Two Surfaces Down to Molecular Separations. Review of
Scientific Instruments, 60, 3135-3138. https://doi.org/10.1063/1.1140544
[7] Claesson, P.M.,Ederth, T., Bergeron, V. and Rutlandc, M.W. (1996) Techniques for Measuring Surface Forces. Advances in Colloid and Interface Science, 67, 119-183. https://doi.org/10.1016/0001-8686(96)00302-8
[8] Israelachvili, J. (1991) Intermolecular and Surface Forces. AcademicPress, London. [9] Israelachvili, J. and Berman, A.D. (1999) Surface Forces and Microrheology of Mo-lecularly Thin Liquid Films. In: Bhushan, B., Ed., Handbook of Micro/Nanotribology, 2nd Edition, CRC Press,Boca Raton, Fl.
[10] Israelachvili, J.N. and Adams, G.E. (1978) Measurement of Forces between Two Mica Surfaces in Aqueous Electrolyte Solutions in the Range 0 - 100 nm. Journal of
the Chemical Society, Faraday Transactions 1: Physical Chemistry in Condensed
Phases, 74, 975-1001. https://doi.org/10.1039/f19787400975
[11] Larson, I., Drummond, C.J., Chan, D.Y.C. and Grieser, F. (1997) Direct Force Measurements between Silica and Alumina. Langmuir, 13, 2109-2112.
https://doi.org/10.1021/la960684h
[12] Parker, J.L. (1994) Surface Force Measurements in Surfactant Systems. Progress in
Surface Science, 47, 205-271. https://doi.org/10.1016/0079-6816(94)90019-1
[13] Dorobantu, L.S.,Bhattacharjee, S., Foght, J.M. and Gray, M.R. (2009) Analysis of Force Interactions between AFM Tips and Hydrophobic Bacteria Using DLVO Theory. Langmuir, 25, 6968-6976. https://doi.org/10.1021/la9001237
[14] Ducker, W.A., Xu, Z. and Israelachvili, J.N. (1994) Measurements of Hydrophobic and DLVO Forces in Bubble-Surface Interactions in Aqueous Solutions. Langmuir, 10, 3279-3289. https://doi.org/10.1021/la00021a061
[15] Pashley, R. (1981) DLVO and Hydration Forces between Mica Surfaces in Li+, Na+,
K+, and Cs+ Electrolyte Solutions: A Correlation of Double-Layer and Hydration
Forces with Surface Cation Exchange Properties. Journal of Colloid and Interface
Science, 83, 531-546. https://doi.org/10.1016/0021-9797(81)90348-9
[16] Pashley, R. and Israelachvili, J. (1984) DLVO and Hydration Forces between Mica Surfaces in Mg2+, Ca2+, Sr2+, and Ba2+ Chloride Solutions. Journal of Colloid and
In-terface Science, 97, 446-455. https://doi.org/10.1016/0021-9797(84)90316-3
[17] Yoon, R.-H. and Mao, L. (1996) Application of Extended DLVO Theory, IV: Deri-vation of Flotation Rate Equation from First Principles. Journal of Colloid and
In-terface Science, 181, 613-626. https://doi.org/10.1006/jcis.1996.0419
Trans-DOI: 10.4236/wjnse.2019.91001 13 World Journal of Nano Science and Engineering location through a Nanopore. Analytical Chemistry, 82, 8217-8225.
https://doi.org/10.1021/ac101628e
[19] Daiguji, H., Yang, P. and Majumdar, A. (2004) Ion Transport in Nanofluidic Channels. Nano Letters, 4, 137-142. https://doi.org/10.1021/nl0348185
[20] He, Y., et al. (2011) Gate Manipulation of DNA Capture into Nanopores. ACS Na-no, 5, 8391-8397. https://doi.org/10.1021/nn203186c
[21] Hsu, C., Lo, T.-W., Lee, D.-J. and Hsu, J.-P. (2013) Electrophoresis of a Charge-Regulated Zwitterionic Particle: Influence of Temperature and Bulk Salt Concentration. Langmuir, 29, 2427-2433. https://doi.org/10.1021/la3047752
[22] Jin, X. and Aluru, N.R. (2011) Gated Transport in Nanofluidic Devices.
Microflui-dics and NanofluiMicroflui-dics, 11, 297-306. https://doi.org/10.1007/s10404-011-0796-3
[23] Matovic, J., et al. (2012) Field Effect Transistor Based on Ions as Charge Carriers.
Sensors and Actuators B: Chemical, 170, 137-142.
https://doi.org/10.1016/j.snb.2011.03.011
[24] Singh, K.P. and Kumar, M. (2012) Effect of Gate Length and Dielectric Thickness on Ion and Fluid Transport in a Fluidic Nanochannel. Lab on a Chip, 12, 1332-1339. https://doi.org/10.1039/c2lc20869e
[25] Vinogradova, O.I., Yakubov, G.E. and Butt, H.-J. (2001) Forces between Polystyrene Surfaces in Water-Electrolyte Solutions: Long-Range Attraction of Two Types? The
Journal of Chemical Physics, 114, 8124-8131. https://doi.org/10.1063/1.1365954
[26] Fielden, M.L., Hayes, R.A. and Ralston, J. (1996) Surface and Capillary Forces Af-fecting Air Bubble-Particle Interactions in Aqueous Electrolyte. Langmuir, 12, 3721-3727. https://doi.org/10.1021/la960145c
[27] Christenson, H.K., et al. (1990) Effect of Divalent Electrolyte on the Hydrophobic Attraction. Journal of Physical Chemistry, 94, 8004-8006.
https://doi.org/10.1021/j100384a002
[28] Parker, J.L., Claesson, P.M. and Attard, P. (1994) Bubbles, Cavities, and the Long-Ranged Attraction between Hydrophobic Surfaces. The Journal of Physical
Chemistry, 98, 8468-8480. https://doi.org/10.1021/j100085a029
[29] Kokkoli, E. and Zukoski, C.F. (1999) Effect of Solvents on Interactions between Hydrophobic Self-Assembled Monolayers. Journal of Colloid and Interface Science, 209, 60-65. https://doi.org/10.1006/jcis.1998.5862
[30] Zhmud, B., Meurk, A. and Bergström, L. (1998) Evaluation of Surface Ionization Parameters from AFM Data. Journal of Colloid and Interface Science, 207, 332-343. https://doi.org/10.1006/jcis.1998.5783
[31] Weisenhorn, A.,Maivald, P., Butt, H.-J. and Hansma, P.K. (1992) Measuring Adhe-sion, Attraction, and Repulsion between Surfaces in Liquids with an Atomic-Force Microscope. Physical Review B, 45, 11226.
https://doi.org/10.1103/PhysRevB.45.11226
[32] Hoh, J.H., Revel, J.-P. and Hansma, P.K. (1991) Tip-Sample Interactions in Atomic Force Microscopy: I. Modulating Adhesion between Silicon Nitride and Glass.
Na-notechnology, 2, 119. https://doi.org/10.1088/0957-4484/2/3/003
[33] Hüttl, G., Beyer, D. and Müller, E. (1997) Investigation of Electrical Double Layers on SiO2 Surfaces by Means of Force vs. Distance Measurements. Surface and
Inter-face Analysis, 25, 543-547.
https://doi.org/10.1002/(SICI)1096-9918(199706)25:7/8<543::AID-SIA268>3.0.CO; 2-T
DOI: 10.4236/wjnse.2019.91001 14 World Journal of Nano Science and Engineering Characterization of Surface Acid-Base Properties. The Journal of Physical Chemi-stry, 97, 7272-7276. https://doi.org/10.1021/j100130a025
[35] Toikka, G., Hayes, R.A. and Ralston, J. (1996) Adhesion of Iron Oxide to Silica Stu-died by Atomic Force Microscopy. Journal of Colloid and Interface Science, 180, 329-338. https://doi.org/10.1006/jcis.1996.0311
[36] Rutland, M.W. and Senden, T.J. (1993) Adsorption of the Poly (Oxyethylene) Non-ionic Surfactant C12E5 to Silica: A Study Using Atomic Force Microscopy. Lang-muir, 9, 412-418. https://doi.org/10.1021/la00026a009
[37] Meagher, L. (1992) Direct Measurement of Forces between Silica Surfaces in Aqueous CaCl2 Solutions Using an Atomic Force Microscope. Journal of Colloid
and Interface Science, 152, 293-295. https://doi.org/10.1016/0021-9797(92)90030-P
[38] Cosgrove, T. (2010) Colloid Science: Principles, Methods and Applications. John Wiley & Sons,Hoboken, NJ.
[39] Israelachvili, J.N. and Tabor, D. (1972) The Measurement of Van der Waals Disper-sion Forces in the Range 1.5 to 130 nm. Proceedings of the Royal Society of London.
Series A, 331, 19-38. https://doi.org/10.1098/rspa.1972.0162
[40] Atalay, S., et al. (2014) Surface Charge of a Nanoparticle Interacting with a Flat Substrate. The Journal of Physical Chemistry C, 118, 10927-10935.
https://doi.org/10.1021/jp5023554
[41] Butt, H.-J., Cappella, B. and Kappl, M. (2005) Force Measurements with the Atomic Force Microscope: Technique, Interpretation and Applications. Surface Science
Reports, 59, 1-152. https://doi.org/10.1016/j.surfrep.2005.08.003