Synthesis, Properties, and Light-Emitting Electrochemical Cell (LEEC)
Device Fabrication of Cationic Ir(III) Complexes Bearing
Electron-Withdrawing Groups on the Cyclometallating Ligands
Amlan K. Pal,
†David B. Cordes,
‡Alexandra M. Z. Slawin,
‡Cristina Momblona,
§Enrique Ort
ı
,
́
§Ifor D. W. Samuel,
∥Henk J. Bolink,
§and Eli Zysman-Colman
*
,††
Organic Semiconductor Centre, EaStCHEM School of Chemistry, University of St Andrews, St Andrews, Fife KY16 9ST, United
Kingdom
‡
EaStCHEM School of Chemistry, University of St Andrews, St Andrews, Fife KY16 9ST, United Kingdom
§Instituto de Ciencia Molecular, Universidad de Valencia, C/J. Beltran 2, 46980 Paterna, Spain
∥
Organic Semiconductor Centre, SUPA, School of Physics and Astronomy, University of St Andrews, St Andrews, Fife KY16 9SS,
United Kingdom
*
S Supporting InformationABSTRACT:
The structure
−
property relationship study of a
series of cationic Ir(III) complexes in the form of [Ir(C^N)
2-(d
t
Bubpy)]PF
6[where d
t
Bubpy = 4,4
′
-di-
tert
-butyl-2,2
′
-bipyridine and C^N = cyclometallating ligand bearing an
electron-withdrawing group (EWG) at C
4of the phenyl
substituent, i.e.,
−
CF
3(
1
),
−
OCF
3(
2
),
−
SCF
3(
3
),
−
SO
2CF
3(
4
)] has been investigated. The physical and optoelectronic
properties of the four complexes were comprehensively
characterized, including by X-ray di
ff
raction analysis. All the
complexes exhibit quasireversible d
t
Bubpy-based reductions
from
−
1.29 to
−
1.34 V (vs SCE). The oxidation processes are
likewise quasireversible (metal + C^N ligand) and are between 1.54 and 1.72 V (vs SCE). The relative oxidation potentials follow
a general trend associated with the Hammett parameter (
σ
) of the EWGs. Surprisingly, complex
4
bearing the strongest EWG
does not adhere to the expected Hammett behavior and was found to exhibit red-shifted absorption and emission maxima.
Nevertheless, the concept of introducing EWGs was found to be generally useful in blue-shifting the emission maxima of the
complexes (
λ
em= 484
−
545 nm) compared to that of the prototype complex [Ir(ppy)
2(d
t
Bubpy)]PF
6(where ppy =
2-phenylpyridinato) (
λ
em= 591 nm). The complexes were found to be bright emitters in solution at room temperature (
Φ
PL= 45
−
66%) with microsecond excited-state lifetimes (
τ
e= 1.14
−
4.28
μ
s). The photophysical properties along with density functional
theory (DFT) calculations suggest that the emission of these complexes originates from mixed contributions from
ligand-centered (LC) transitions and mixed metal-to-ligand and ligand-to-ligand charge transfer (LLCT/MLCT) transitions, depending
on the EWG. In complexes
1
,
3
, and
4
the
3LC character is prominent over the mixed
3CT character, while in complex
2
, the
mixed
3CT character is much more pronounced, as demonstrated by DFT calculations and the observed positive
solvatochromism e
ff
ect. Due to the quasireversible nature of the oxidation and reduction waves, fabrication of light-emitting
electrochemical cells (LEECs) using these complexes as emitters was possible with the LEECs showing moderate e
ffi
ciencies.
■
INTRODUCTION
Over the past few decades, heteroleptic cationic Ir(III)
complexes have garnered widespread interest due to their
frequently bright phosphorescence that can be tuned across the
visible spectrum through simple ligand modi
fi
cation.
1−4Due to
facile color tuning, high photoluminescence quantum yield
(
Φ
PL) and short emission lifetimes (
τ
e), iridium complexes are
ideal emissive materials for electroluminescent (EL) devices
and remain the most popular materials for use in organic
light-emitting diodes (OLEDs) and in light-light-emitting electrochemical
cells (LEECs). For lighting and display applications, bright and
stable red, green, and blue emitters are all required. Whereas
the performance of phosphorescent red and green
organo-metallic emitters is satisfactory, there is presently a dearth of
bright and stable blue emitters for OLEDs and a nearl complete
absence of blue emitters for LEECs.
Generally, two strategies are adopted to blue-shift the
luminescence of cationic cyclometalated Ir(III) complexes of
the form [Ir(C^N)
2(N^N)]
+: (a) increase the energy of the
emissive metal-to-ligand, intraligand or ligand-to-ligand charge
transfer state (MLCT, ILCT or LLCT, respectively) by
Received: July 5, 2016 Published: September 28, 2016
Article
pubs.acs.org/IC
introducing electron-donating groups (EDGs) on the ancillary
N^N ligand or electron-withdrawing groups (EWGs) on the
cyclometallating C^N ligands;
5and (b) increase the energy of
the emissive
π−π
*
ligand-centered states by limiting
con-jugation within the ligand.
6,7With EWGs positioned on the
C^N ligands, the HOMO is stabilized more than the LUMO,
which translates to an increased band gap and, generally, bluer
emission. Currently, it is a near-universal strategy to employ
C^N ligands like 2-(4,6-di
fl
uorophenyl)-pyridine, dFppy, to
obtain blue/blue-green-emitting Ir complexes in solution, a
subset of which have been used in LEECs.
8−16While the Ir(III)
complexes containing
fl
uorinated C^N ligands exhibit sky-blue
to blue emission, they are prone to degradation via
de
fl
uorination.
17,18Thus, while the presence of
fl
uorine atoms
on the C^N ligands blue-shifts the emission, its deleterious
e
ff
ect on device lifetime mitigates against its inclusion in the
emitter design. Apart from
fl
uorination, the other EWGs that
have been used to blue-shift the phosphorescence of Ir(III)
complexes include the following: sulfonyl (
−
SO
2R),
19,20tri
fl
uoromethyl (
−
CF
3),
21−25penta
fl
uoro-
λ
6-sulfanyl (SF
5),
26and cyclometalated heterocycles such as 2,3
′
-bipyridinato.
27−33Sky-blue and deep-blue emitting cationic Ir(III) complexes
bearing biimidazole,
34−36bis(NHC),
37substituted triazole or
tetrazole,
38−40or pyrazolyl-pyridine
10as ancillary ligands have
also been explored, but challenges still remain regarding
e
ffi
ciencies and stabilities of these emitters in devices, primarily
as a consequence of thermal population of metal-centered
states (
3MC).
41Thus, there is still a demand for blue-emitting
phosphors as emitters in lighting devices.
Among various other EWGs,
42those that
fi
nd interest in
organometallic chemistry are
fl
uorocarbon groups, given the
fact that these groups are bulky, polar, hydrophobic, and
chemically inert. They are therefore attractive for reducing
interactions between iridium complexes, which could otherwise
lead to aggregation-induced broadening and red-shifting of the
phosphorescence.
43−47This is particularly important in blue
electroluminescent devices and in particular LEECs as the
light-emitting layer is often a neat
fi
lm. Tuning of optoelectronic
properties in organometallic Ir(III) complexes using bulky
fl
uorocarbon groups is also relatively rare compared to those
with other transition metal ions.
21,25,39,45,47−49Thus, stable,
bulky, and electron-withdrawing
fl
uorocarbon groups are
desirable alternatives to the commonly used C(aryl)
−
F motif
and should serve the similar purpose of
fi
ne-tuning of
optoelectronic properties of their Ir(III) complexes.
Herein we report a systematic and comparative synthetic,
structural, electrochemical, and spectroscopic study of
phosphorescent Ir(III) complexes with a series of
electron-Chart 1. Chemical Structures of Ligands L1
−
L4 and Cationic Ir(III) Complexes 1
−
4 under Discussion
withdrawing
fl
uorocarbon groups attached at the 4-position of
the C^N ligands (ligands
L1
−
L4
in
Chart 1
), including the
following: tri
fl
uoromethyl (
−
CF
3), tri
fl
uoromethoxy (
−
OCF
3),
tri
fl
uoromethylsulfanyl (
−
SCF
3), and tri
fl
uoromethylsulfonyl
(
−
SO
2CF
3). These C^N ligands were used in combination
with the electron-donating 4,4
′
-di-
tert
-butyl-2,2
′
-bipyridine
(d
t
Bubpy) as the ancillary N^N ligand (complexes
1
−
4
in
Chart 1
). The e
ff
ects of the presence of di
ff
erent EWGs on the
optoelectronic properties in conjunction with density
func-tional theory (DFT) calculations are discussed, and the results
are compared with six benchmark complexes (complexes
R1
−
R6
in
Chart 2
) along with the application of the new complexes
in LEECs as solid-state lighting devices.
■
RESULTS AND DISCUSSION
Synthesis.
The syntheses of the C^N ligands
L1
−
L4
and
the heteroleptic iridium complexes
1
−
4
are shown in
Scheme
1
. Each of the substituted C^N ligands was prepared in high
yield via Stille palladium-catalyzed cross-coupling reaction in
moderate to good yield.
50Ligands
L1
and
L2
were synthesized
following literature procedure.
51The tin byproducts were
removed by passing the reaction mixture through silica gel and
(10 wt %) potassium carbonate.
52The C^N ligands,
L1
−
L4
,
were complexed with either IrCl
3·
3H
2O or [Ir(COD)(
μ
-Cl)]
2(where COD = 1,5-cyclooctadiene) and the resulting
μ
-dichloro-bridged iridium dimers [Ir(
L1
)
2(
μ
-Cl)]
2,
D-L1
;
[Ir-(
L2
)
2(
μ
-Cl)]
2,
D-L2
; [Ir(
L3
)
2(
μ
-Cl)]
2,
D-L3
; and [Ir(
L4
)
2(
μ
-Cl)]
2,
D-L4
were formed in good yields under standard
conditions
53and were used without further puri
fi
cation. The
heteroleptic cationic iridium(III) complexes
1
−
4
were isolated
in high yields through cleavage of
D-L1
−
D-L4
with the
d
t
Bubpy ligand. All cationic complexes were puri
fi
ed by column
chromatography and isolated as the PF
6−salt following an
anion metathesis reaction using aqueous NH
4PF
6. Complexes
1
−
4
are air- and moisture-stable solids that are soluble in polar
organic solvents including acetonitrile and dichloromethane.
The ligands
L1
−
L4
, dimers
D-L1
−
D-L4
, and cationic
complexes
1
−
4
were characterized by
1H and
19F NMR
spectroscopy (see
Figures S1
−
S6
for stacked NMR spectra and
Figures S7
−
S37
for individual NMR spectra), HRMS, melting
point determination, and elemental analyses. Complexes
1
−
4
were further characterized by single crystal X-ray structural
analysis. Inherent
C
2symmetry in the solution state of
complexes
1
−
4
was con
fi
rmed by both
1H and
19F NMR
Scheme 1. Synthesis of C^N Ligands, L1
−
L4, and [Ir(C^N)
2(d
t
Bubpy)]PF
6Complexes, 1
−
4
aReagents and conditions: 1.6−2 mol % Pd(PPh
3)4, N2, dry degassed PhMe (10−15 mL), 120°C, 24−48 h.b2-EtOC2H4OH/H2O (3:1 v/v) or
[image:3.625.85.556.225.476.2]2-EtOC2H4OH (4 mL), 120−130°C, N2, 5−24 h.c(1) CH2Cl2/MeOH (5:1 v/v), 40°C, 24 h, N2, (2) excess aqueous NH4PF6.
Figure 1. Solid-state structures of complexes 1−4. Hydrogen atoms, PF6− counterions, solvent molecules, minor components of disordered
molecules, and additional independent molecules are omitted for clarity. Thermal ellipsoids correspond to a 50% probability level.
spectroscopy. The e
ff
ect of the EWG on the electronics of the
phenyl ring is pronounced, evidenced by the gradual and linear
down
fi
eld shift of the proton
ortho
to the nitrogen atom of the
pyridyl ring of the C^N ligands from complex
2
to
3
to
1
to
4
(
Figure S5
) in accordance with the increasing Hammett
constant (
σ
m) from
−
OCF
3(0.38) to
−
SCF
3(0.40) to
−
CF
3(0.43) to
−
SO
2CF
3(0.83) as calculated by Hansch et al.
(
Figure S38
).
42The
19F NMR spectra exhibit the characteristic
singlet peak in the range
−
42 ppm to
−
80 ppm for a
substituted
−
CF
3group and a doublet (
J
= 713 Hz at 400 MHz
instrument due to
31P
−
19F nuclear coupling) at
∼−
73 ppm for
the six magnetically equivalent
fl
uorine atoms in the PF
6−anion
(
Figure S6
). The HRMS analyses of
L2
−
L4
and
1
−
4
showed
the diagnostic peaks of the protonated ligand [M + H
+] and the
cation [Ir(C^N)
2(d
t
Bubpy)]
+, respectively (
Figures S39
−
S45
).
[image:4.625.62.566.87.199.2]Crystal Structures.
Crystals of the complexes, suitable for
X-ray analysis, were grown by slow di
ff
usion of diethyl ether
into moderately concentrated solutions of the complexes in
dichloromethane (
1
and
2
) and by slow evaporation of mixed
solutions of CH
2Cl
2/heptanes (
3
) or CH
2Cl
2/hexanes (
4
)
(
Figure 1
). Selected crystallographic parameters are tabulated
in
Table S1
. Selected bond distances and angles in comparison
to those predicted by DFT calculations are summarized in
Table S2
. In each of the complexes, the Ir(III) ion exhibits a
coordinatively saturated distorted octahedral coordination
environment with the two N atoms of the C^N ligands
trans
to each other, similar to the solid-state structure of the
archetypal complex
R2
.
54The average Ir
−
C
ppy(2.015 Å) and
Ir
−
N
ppy(2.050 Å) bond distances in
1
−
4
are similar to those in
complex
R2
(Ir
−
C
ppy: 2.013 Å; Ir
−
N
ppy: 2.045 Å). In each of
the four complexes, the Ir
−
N bond to the ancillary d
t
Bubpy
ligand [2.113(10)
−
2.134(9) Å] is longer than that to the C^N
ligands [2.039(4)
−
2.061(11) Å], and the N
N^N−
Ir
−
N
N^Nbite
angle [75.89(15)
−
76.8(4)
o] is narrower than that of C
C^N−
Ir
−
N
C^N[80.1(3)
−
80.6(4)
°
]. The DFT calculated bond distances
and angles are in line with those observed for the solid-state
structures. In all the complexes, the presence of bulky
substituents in the cyclometallating ligand and the
t
Bu groups
onto the backbone of the bipyridine unit prevents any
face-to-face
π−π
stacking of the complexes.
Electrochemical Properties.
The electrochemical
proper-ties of the ligands and mononuclear complexes have been
investigated by both cyclic and di
ff
erential pulse voltammetry
(CV and DPV, respectively) in degassed MeCN, and the
fi
rst
redox potentials, reported with respect to SCE (Fc/Fc
+= 0.38
V in MeCN),
55are compiled in
Table 1
, while the full set of
redox potentials are detailed in
Table S3
, and the CVs along
with DPVs are shown in
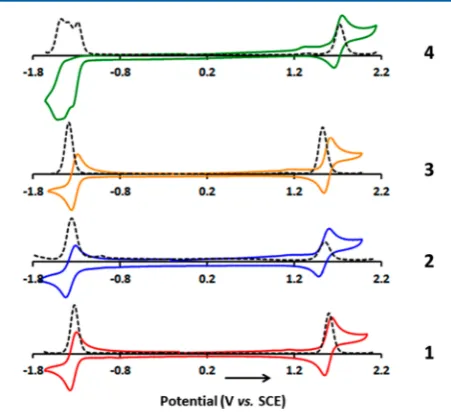
Figure 2
. Electrochemistry data of
R1
,
R3
,
R5
, and
R6
have been corrected to account for the
experimental setup and referencing versus SCE (see
Electro-chemistry
section in the Supporting Information for full
details).
At positive potential, complexes
1
−
4
exhibit a quasireversible
single electron oxidation between 1.54 and 1.72 V. DFT
calculations using the B3LYP functional indicate that
incorporation of various electron-withdrawing groups results
in a stabilization of the HOMOs (HOMO = highest occupied
molecular orbital) of complexes
1
−
4
compared to that of
reference complex
R1
and the HOMOs of these complexes are
almost equally constituted of the metal center as well as the
C^N ligands (
Figure 3
). Thus, and also following literature data
of structurally similar cationic Ir(III) complexes,
4,56the
oxidation potentials of complexes
1
−
4
are assigned to the
removal of an electron from an admixture of the (metal +
Table 1. Redox Data of Complexes 1, 2, 3, and 4 in Degassed MeCN
aHammett constant (σ)
compd E1/2ox(ΔEp) E
1/2red(ΔEp) ΔEredoxb EHOMOc ELUMOc |ELUMO−HOMO|c σm σp
1 1.60 (70) −1.33 (72) 2.93 −5.87 −2.39 3.48 0.43 0.54
2 1.54 (128) −1.34 (115) 2.88 −5.76 −2.35 3.41 0.38 0.35
3 1.58 (82) −1.31 (78) 2.89 −5.83 −2.37 3.46 0.40 0.50
4 1.72 (90) −1.29 (104) 3.01 −6.13 −2.45 3.68 0.83 0.96
R1d 1.29 (106) −1.42 (87) 2.71 −5.56 −2.29 3.27
R3e 1.59 (88) −1.36 (83) 2.95 0.54
R5f 1.65 (68) 0.61
R6f 1.66 (68) 0.68
aPotentials are in volts (V) vs SCE for acetonitrile solutions, 0.1 M in [n-Bu
4N]PF6, recorded at room temperature at a sweep rate of 100 mV/s
using a glassy carbon electrode as the working electrode, a platinum wire as the counter electrode, and a silver wire as the reference electrode. The difference between cathodic,Epc, and anodic,Epa, peak potentials,ΔEp, (mV) is given in parentheses.bΔEredoxis the difference (V) betweenfirst
oxidation andfirst reduction potentials.cDFT calculated energy in eV.dFrom ref57(a correction factor of 0.38 V instead of 0.4 V as reported in the literature has been applied for direct comparison).eFrom ref58(a correction factor of 0.38 V has been applied for direct comparison).55fFrom ref
26(a correction factor of 0.38 V has been applied for direct comparison).55
[image:4.625.330.556.323.529.2]C^N)-based orbitals. The lower energies calculated for the
HOMOs of
1
(
E
HOMO=
−
5.87 eV),
2
(
E
HOMO=
−
5.76 eV),
3
(
E
HOMO=
−
5.83 eV), and
4
(
E
HOMO=
−
6.13 eV) compared to
that of
R1
(
E
HOMO=
−
5.56 eV) are in good agreement with the
higher anodic potentials measured for complexes
1
−
4
in
comparison to that of
R1
(
Table 1
). The
−
SO
2CF
3substituted
ppy moiety (
L4
) in complex
4
acts as the strongest
electron-withdrawing group (EWG) compared to
−
CF
3,
−
OCF
3, and
−
SCF
3, as demonstrated by the highest oxidation potential of
this complex, while the
−
OCF
3substituted ppy moiety (
L2
)
acts as the poorest EWG. This fact is in line with the increasing
energy of the HOMO from complexes
4
to
1
to
3
to
2
as
calculated by DFT and also in good agreement with the higher
Hammett
meta-
constant (
σ
m) of the
−
SO
2CF
3group (0.83)
compared to
−
CF
3(0.43),
−
SCF
3(0.40), and
−
OCF
3(0.38)
groups.
42A linear relationship (
R
2= 0.93) was found between
the Hammett constants of the di
ff
erent EWGs of
1
−
4
, those
found on the reference complexes, and the oxidation potentials
of the corresponding complexes (
Figure 4
).
Upon scanning to negative potential, several ligand-based
reductions are exhibited by complexes
1
−
4
. While for
complexes
1
,
3
, and
4
, the
fi
rst reductions are monoelectronic,
for complex
2
this reduction is found to be dielectronic as
inferred from the DPVs of these complexes (
Figure 2
). The
reduction pro
fi
le of
4
was found to be irreversible while the
reduction for
1
−
3
was quasireversible in nature, thus suggesting
an electrochemical instability of
4
. DFT calculations point to a
LUMO (LUMO = lowest unoccupied molecular orbital) that
has predominantly d
t
Bubpy character. Therefore, the
fi
rst
reduction can unambiguously be assigned to reduction of the
d
t
Bubpy moiety, while LUMO + 1 and LUMO + 2 are
localized mainly on the
L1
−
L4
ligands. Thus, in a coarse
approximation, the second and third reduction waves may be
assigned to reduction of the
L1
−
L4
moieties. Unlike the other
EWGs found in
1
−
3
, the strongest
−
SO
2CF
3EWG group in
4
is prone to undergo irreversible reduction. This second
irreversible reduction of
4
, presumably localized on the
−
SO
2CF
3group of
L4
as suggested by DFT calculation,
occurs very closely to the
fi
rst quasireversible reduction, thus
contributing to the overall irreversible nature of the reduction
pro
fi
le of complex
4
. Such behavior had previously been
observed for SF
5-containing cationic iridium complexes.
26The
trend in the redox gap (
Δ
E
redox) of complexes
1
−
4
, along with
that of
R1
, satisfactorily matches the trend in the calculated
HOMO
−
LUMO energy di
ff
erences (
Table 1
). The EWGs
found on the C^N ligands stabilize both the HOMO and the
LUMO though the former is a
ff
ected to a much more
appreciable degree than the latter. Thus, the electronics of
1
−
4
are essentially HOMO-modulated (
Figure 3
). Due to the
[image:5.625.149.478.63.323.2]strong electron-withdrawing nature of the
−
SO
2CF
3group, the
Figure 3.Calculated frontier MO energies of [1]+, [2]+, [3]+, [4]+, and [R1]+, obtained from DFT [(B3LYP/SBKJC-VDZ for Ir(III)) and (6-31g**
for C,H,N,(O),F,(S)] with CPCM(CH3CN) and 0.5 eV threshold of degeneracy (orbitals are isocontoured at 0.03). Kohn−Sham MOs of [1]+,
[2]+, [3]+, [4]+, and [R1]+are also shown.
Figure 4.Plot of Hammett constant (σ) of the EWG (or X) group with the corresponding oxidation potentials of the complexes1−4and benchmark complexes R1, R3, R5, and R6.
[image:5.625.324.565.370.539.2]fi
rst reduction of
4
is anodically shifted by between 20 and 50
mV compared to those of
1
−
3
.
The reduction potential of
1
, where the
−
CF
3substituent is
positioned
meta
to the Ir
−
C
ppybond, is found to be anodically
shifted by
∼
30 mV compared to those of
R3
, where the
−
CF
3substituent is positioned
para
to the Ir
−
C
ppybond. In a
comparison of both the oxidation and reduction potentials, the
result demonstrates that
1
is harder to oxidize, but easier to
reduce compared to
R3
. This fact does not follow the trend of
Hammett constants (
σ
) of the electron-withdrawing
−
CF
3substituent when regiospeci
fi
cally positioned (
σ
m= 0.43,
σ
p=
0.54).
42Photophysical Properties.
The UV
−
vis absorption
properties of complexes
1
−
4
have been investigated in
[image:6.625.145.477.67.290.2]MeCN solution at room temperature and the respective
spectra are shown in
Figure 5
; the data are summarized in
Table 2
and
Table S4
. Overlays of each of the experimentally
observed UV
−
vis absorption spectra of the complexes with
their predicted transitions at di
ff
erent wavelengths as obtained
by singlet TD-DFT calculations are shown in
Figure S46
. The
absorption spectra of all the complexes are characterized by two
intense bands between 250 and 300 nm and several
lower-intensity bands beyond 300 nm. Predominant spin-allowed
singlet
1π
→
π
*
ligand-centered (
1LC) transitions centered
both on cyclometallating and the ancillary ligands, as predicted
by TD-DFT calculations of complexes
1
−
4
(
Tables S5
−
S8
),
are observed at the highest-energy band, whereas the other
intense peaks at
∼
290 nm result mainly from
1LC transitions
and along with minor amounts of
1MLCT transitions. Between
300 and 400 nm the electronic transitions constitute
1LC and
1MLCT transitions, with varying contributions of
1MLCT and
singlet ligand-to-ligand transition (
1LLCT) from one complex
to another. For complexes
1
,
3
, and
4
the electronic transitions
between 410
−
436 nm are assigned as HOMO
→
LUMO
transitions, whereas for complex
2
the similar peak at 400 nm is
assigned as a HOMO
→
LUMO + 1 transition (
Tables S5
−
[image:6.625.60.572.336.490.2]S8
). For
2
, the lowest-energy HOMO
→
LUMO transition is
Figure 5.UV−vis spectra of complexes1,2,3, and4recorded in MeCN at 298 K (inset shows magnified spectra from 400 to 525 nm).Table 2. Relevant Photophysical Data for Complexes 1-4
emissiona
absorption (in MeCN) λem/nm
compd λabs/nm (ε×10−3/M−1cm−1) MeCN DCM τe/μs ΦPL/% 10−5×kr/s−1 10−5×knr/s−1
1 411 (3.6), 470 (0.22) 484, 516 487(sh), 517 1.79 45 2.51 3.08
2 400 (3.8), 460 (0.31) 527 530 1.14 50 4.38 4.39
3 420 (4.1), 479 (0.19) 491, 525 494(sh), 524 3.31 66 1.99 1.03
4 436 (2.7), 494 (0.16) 515, 545 510, 543 4.28 55 1.28 1.06
R1b 415 (4.8), 465 (1.0) 591 0.386 27 7 19
R2 411 (3.3), 465 sh (0.67)c 602b 0.275b 9.3b 3.4b 33b
R3d ∼410, 460 512 1.2 66
R4e 543 1.2 26
R5f 384 (5.0) 482 482 4.7 79
R6f 368 (5.2, sh) 496 498 2.0 71
aIn degassed MeCN at room temperature. Steady-state emission spectra were also recorded in degassed DCM. Steady-state emission (in MeCN): λexc= 360 nm. Time-resolved emission (in MeCN):λexc= 378 nm. SolutionΦPLvalues were measured using quinine sulfate as the external reference
(λem= 450 nm in MeCN,Φr= 54.6% in 0.5 M H2SO4as found in ref66).bFrom ref8.cFrom ref67.dPhotophysical data in degassed DCM solution
(ΦPLwas determined using quinine hemisulfate salt monohydrate (Φref= 54.6% in 0.5 M H2SO4) as standard) from ref58.ePhotophysical data in
predicted at 452 nm. All the complexes exhibit a shoulder band
at
λ
> 450 nm, albeit with poor molar absorptivity, which is also
present in the complex
R1
at 465 nm.
57These hypochromic
bands at lower energy are the result of poor spatial overlap
between the HOMO and LUMO and are similar to those of
many other cationic iridium complexes of the form [Ir(C^N)
2-(N^N)]
+found in the literature.
59,60This spectral feature is
predicted by TD-DFT calculations,
61−64and these bands are
assigned to a mixture of spin-allowed and spin-forbidden charge
transfer transitions (
1MLCT,
3MLCT, and
1LLCT) due to
strong spin
−
orbit coupling of the Ir-metal center. Although a
blue-shift in the lowest-energy absorption band is expected for
complex
4
in the presence of the strongly electron-withdrawing
−
SO
2CF
3group compared to those of complexes
1
,
2
, and
3
,
surprisingly, a strong bathochromic shift is observed for this
complex. Contrary to the DFT calculated HOMO
−
LUMO gap
for
1
−
4
(
Figure 3
), the lowest-energy absorption maxima of
these complexes are red-shifted compared to that of
R1
, which
may suggest an additional stabilization of the LUMOs of the
complexes
1
−
4
compared to the energy of the LUMO of
complex
R1
due to the strong electron-withdrawing nature of
the EWGs.
Figure 6
illustrates the normalized room temperature
emission spectra of
1
−
4
upon photoexcitation into the CT
band (at 360 nm) in degassed acetonitrile. Emission maxima
(
λ
em), excited-state lifetime (
τ
e), and photoluminescence
quantum yield (
Φ
PL) values along with the low-energy
absorption maxima of
1
−
4
are summarized in
Table 2
. In
MeCN solution, sky-blue to blue-green emission with maxima
ranging from 484 to 545 nm is observed for
1
−
4
(
Figure 6
a).
The emission intensity increases upon degassing with nitrogen,
which is a hallmark of phosphorescence. In degassed dilute
MeCN solution,
1
,
3
, and
4
exhibit structured emission that is
characteristic of emission origination from a
3LC state while
2
displays broad and unstructured emission, typical of mixed
3CT
emission. Spin-unrestricted DFT calculations point to a spin
density that is more localized on the C^N ligands and the
central Ir(III) ion for
1
,
3
, and
4
while it is distributed to some
extent to the d
t
Bubpy ligand for
2
(
Figure 7
). These
predictions are consistent with the presence of vibronic
structure in both the phosphorescence and low-energy
absorbance spectra and relatively long radiative lifetimes
present in
1
,
3
, and
4
; calculations likewise predict the mixed
CT character of the excited state found in
2
.
2,4,60,65Unexpectedly,
4
, with the strongest
−
SO
2CF
3EWG group,
(
σ
m= 0.83) exhibits the most red-shifted emission maximum in
MeCN whereas
1
with the
−
CF
3(
σ
m= 0.43) exhibits the most
blue-shifted emission in MeCN. With the exception of
2
,
concomitant to the red-shift in the low-energy absorption
maxima from
1
to
3
to
4
, the emission maxima are also
red-shifted (
Table 2
). The predicted emission maxima,
E
AE=
E
(T
1)
−
E
(S
0), at the
T
1optimized geometries (adiabatic electronic
emission) obtained by DFT calculations for complexes
1
,
3
,
and
4
are at 541, 544, and 588 nm and match closely those
observed experimentally and also fall in agreement with the
observed trend of red-shifted emission maxima from complex
1
to
3
to
4
. By contrast, for complex
2
the predicted emission
maximum at 494 nm is blue-shifted. (The predicted emission
maxima were calculated with relative errors of 8%, 6%, 7%, and
10% for
1
,
2
,
3
, and
4
, respectively, using the equation Error =
|
[
λ
em(298 K)
−
E
AE]/
λ
em(298 K)
|
in eV.) The emission pro
fi
les
of the complexes in degassed DCM essentially mirror those in
degassed MeCN with similar emission energies (
Figure 6
b and
Table 2
).
Incorporation of electron-withdrawing substituents on the
C^N ligands promotes the expected stabilization of the frontier
molecular orbitals (
Figure 3
) and the blue-shift in the emission
observed for complexes
1
−
4
compared to the reference
Figure 6.Normalized photoluminescence spectra of complexes1−4recorded in degassed (a) MeCN and (b) DCM at 298 K (λexc: 360 nm.).
Figure 7.Triplet spin density distributions of complexes1−4, obtained from DFT [(UB3LYP/SBKJC-VDZ for Ir(III)) and (6-31g**for C,H,N, (O),F,(S))] with CPCM(MeCN). Contours are isovalued at 0.02.
complexes
R1
and
R2
(
Table 2
).
1,8The observed blue-shift in
emission maxima (either in MeCN or DCM) of reference
complexes
R3
,
R5
, and
R6
compared to those of
1
−
3
are in
line with the higher Hammett parameter of the regiospeci
fi
cally
positioned EWGs (see
Table 1
for Hammett parameters of
di
ff
erent EWGs). The F atom in
R4
acts as a moderate EWG
(
m
-F,
σ
m= 0.34), and thus, the emission maximum of
R4
is
red-shifted compared to those of
1
−
3
. While the trend in
σ
mcorrelates well with complexes
1
−
3
, this paradigm does not
fi
t
with the red-shifted emission maximum of
4
(
m
-SO
2CF
3,
σ
m=
0.83) compared to the emission maxima observed for
R5
and
R6
.
All the complexes are found to be bright emitters with high
Φ
PLvalues in the range 45
−
66%. Time-resolved
phosphor-escence measurements were performed, and the decays were
found to be monoexponential, indicating the presence of a
single emissive species (
Figure S47
). The results are shown in
Table 2
, and the phosphorescence lifetimes are in the range
1.14
−
4.28
μ
s. The observed higher
τ
evalues for
3
and
4
may be
attributed to the presence of increased steric shielding around
the iridium in these two complexes that inhibits nonradiative
intermolecular charge recombination. The calculated radiative,
k
r, and nonradiative,
k
nr, decay constants, where [
k
r=
Φ
PL/
τ
εand
k
nr= (
k
r/
Φ
PL)
−
k
r], are shown in
Table 2
and fall in the
ranges (1.28
−
4.38)
×
10
5and (1.06
−
4.39)
×
10
5s
−1.
2,61Among
1
,
3
, and
4
that exhibit greater LC emission,
compounds
3
and
4
have lower
k
rand much lower
k
nrthan
compound
1
, leading to higher
Φ
PLvalues for
3
and
4
that are
supported by the decrease in nonradiative decay by about 3
times compared to that of
1
. Both the radiative and
nonradiative decay rates are counterbalanced in the case of
complex
2
, which has more CT character in its emission.
Light-Emitting Electrochemical Cells (LEECs).
Single-layer LEECs were fabricated with complexes
1
−
4
acting as the
emitters. The device architecture consisted of an indium tin
oxide (ITO) semitransparent anode on which a thin layer of
poly(3,4-ethylenedioxythiophene):polystyrenesulfonate,
PE-DOT:PSS, was spin-coated in order to facilitate charge
injection into the emissive layer. The emissive layer consisted
of a 4-to-1 molar ratio of the complex to the ionic liquid (IL)
1-butyl-3-methylimidazolium hexa
fl
uorophosphate [Bmim][PF
6].
[image:8.625.122.507.70.209.2]The small amount of IL was added to shorten the turn-on time
of the LEEC by increasing the concentration of ionic species
and the ionic mobility in the active layer.
68−70The
time-dependence of the luminance and average voltage of the LEECs
prepared with complexes
1
−
4
(for clarity, denoted as LEECs
1
−
4
) as well as the electroluminescence spectra (EL) were
evaluated using a pulsed-current driving mode. Pulsed-current
compared to
fi
xed current/voltage driving leads to devices with
longer lifetimes and faster turn-on times (
t
on).
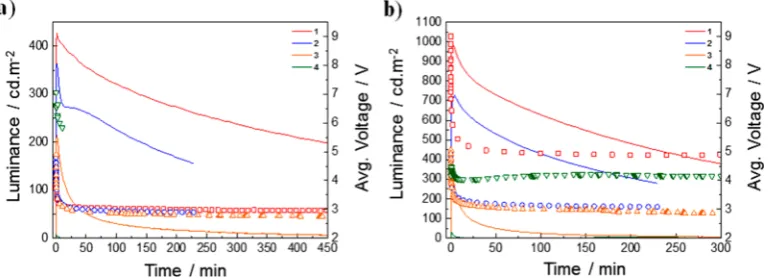
71Figure 8
shows the luminance and operating voltage versus
time of LEECs
1
−
4
driven at an average current density of 50
(
Figure 8
a) or 100 A m
−2(
Figure 8
b). The luminance in all
LEECs shows the typical behavior under pulsed-current
driving: after biasing the device, the luminance increases, and
once the maximum luminance is reached, the luminance starts
to decay. However, the typical operating voltage behavior (a
fast drop toward a steady-state low voltage level) was not
observed in all LEECs. At 50 A m
−2, the operating voltage of
[image:8.625.63.565.276.398.2]LEECs
1
−
3
presents a fast decrease and reaches a steady-state
Figure 8.Luminance (solid lines) and average voltage (open symbols) vs time for LEECs1−4. Block-wave pulsed current driving mode (frequency, 1 kHz; duty cycle, 50%): (a) 50 A m−2, (b) 100 A m−2.Table 3. Key Parameters of LEECs 1
−
4 under Block-Wave Pulsed-Current Driving Mode (Frequency, 1 kHz; Duty Cycle, 50%)
at 50 A m
−2and 100 A m
−2compd Lumoa/cd m−2 Lummaxb/cd m−2 tonc/s tmaxd/min t1/2e/min efficiency/cd A−1 EQEf/% PCEg/lm W−1
50 A m−2
1 312 427 <2 1.5 228.2 8.9 2.7 4.4
2 153 364 <2 1.0 53.7 7.2 2.3 3.1
3 9 215 16 1.3 15.9 4.3 1.4 1.9
4 0 5 1.4 5.7 0.1 0.03 0.02
100 A m−2
1 19 987 5 2.3 179.0 9.8 3.0 2.6
2 88 726 5 4.3 109.3 7.3 2.3 3.3
3 8 350 12 1.0 9.1 3.5 1.1 1.4
4 0 32 0.7 2.7 0.3 0.10 0.1
aInitial luminance.bMaximum luminance reached.cTime to reach 100 cd m−2luminance.dTime to reach the maximum luminance.eTime to reach
value at 2.8
−
3.0 V, indicating no charge injection barrier.
However, higher steady-state voltage values are required for
LEEC
1
at a current density of 100 A m
−2and for LEEC
4
at a
current density of 50 A m
−2that denotes an issue of a charge
injection barrier during operation in these devices. Moreover,
LEEC
4
at 100 A m
−2has a continuous increase of the
operating voltage. An increase in driving voltage is generally
associated with device degradation, yet the particular origin of
the degradation mechanism is not easily identi
fi
ed. One
possible device degradation mechanism can be related to the
chemical degradation of the complex. The presence of an
electrochemically unstable group in the complex could lead the
complex to be electrochemically degraded under LEEC
operation. Complex
4
has the strongest EWG group of the
series (
−
SO
2CF
3), and it is the only complex of the series that
has an irreversible wave in the reduction process detected in the
cyclic voltammetry (cf.
Figure 2
). This irreversibility in the
reduction process produces an unbalanced amount of charges
during LEEC operation causing poor LEEC performance. A
similarly poor LEEC performance with lack of
electro-luminescence was previously reported by us when cationic
iridium complexes incorporating strongly electron-withdrawing
penta
fl
uorosulfanyl groups (
−
SF
5) on the cyclometalating
ligand were used in the emissive layer.
26These groups were
also found to be electrochemically unstable.
For clarity, the device comparisons will be done at 50 A m
−2,
but similar conclusions can be extracted from the data of the
respective LEECs driven at 100 A m
−2. LEEC performance is
summarized in
Table 3
. LEECs
1
−
3
only require a short
turn-on time (
t
on), here de
fi
ned as the time needed to reach a
luminance of 100 cd m
−2. In all cases
t
on
was determined to be
faster than 20 s, and the LEECs reached their maximum
luminance after a few minutes. For LEEC
4
t
oncould not be
determined because of the low luminance levels achieved. The
maximum luminance reached was 427, 364, 215, and 5 cd m
−2for LEECs
1
,
2
,
3
, and
4
, respectively. The trend in device
lifetime (
t
1/2), de
fi
ned as the time to reach one-half of the
maximum luminance, mirrors that observed for maximum
luminance with
t
1/2of 228 min for LEEC
1
, 54 and 16 min for
LEECs
2
and
3
, respectively, and 6 min for LEEC
4
.
The current e
ffi
ciency, external quantum e
ffi
ciency (EQE),
and power conversion e
ffi
ciency (PCE) were also analyzed for
the LEECs. LEEC
1
has the highest values of current e
ffi
ciency,
EQE, and PCE of the series with 8.9 cd A
−1, 2.7%, and 4.4 lm
W
−1, respectively. However, these values are lower compared to
the most e
ffi
cient green-emitting LEEC (
λ
PL(in MeCN)= 512 nm,
CIE = 0.299, 0.451) reported until now with 38 cd A
−1, 14.9%,
and 39.8 lm W
−1under constant voltage driving conditions.
63However, further comparison with green-emitter LEECs driven
at constant voltage
72cannot be considered due to the voltage
dependence of the LEECs
’
performance under constant
voltage. LEECs
2
and
3
are less e
ffi
cient than LEEC
1
with
metrics of 7.2 cd A
−1, 2.3%, and 3.1 lm W
−1, and 4.3 cd A
−1,
1.4%, and 1.9 lm W
−1, respectively. LEEC
4
has the lowest
values of e
ffi
ciency with 0.1 cd A
−1, 0.03%, and 0.02 lm W
−1.
Considering ohmic contact, thin-
fi
lm photoluminescence
quantum yields of 15.9%, 32.6%, 15.7%, and 20.1% for
complexes
1
−
4
, and a typical outcoupling of 20%, the
theoretical maximum external quantum e
ffi
ciency (EQEmax)
for LEECs
1
−
4
is 3.2%, 6.5%, 3.1%, and 4.0%, respectively,
which elucidate low radiative losses for LEEC
1
and moderate
losses for LEECs
2
−
4
. Two mechanisms cause rapid
radiationless deactivation. On the one hand, the formation
and continuous growth of the doped zones during the LEEC
operation leads to e
ffi
cient quenching of the excitons.
73,74On
the other hand, the quasireversible reduction for complexes
1
−
3
and the electrochemical instability of complex
4
suggest an
unbalanced hole/electron carrier that leads to exciton
quenching at one electrode interface.
75As mentioned before,
the e
ffi
ciency of the radiative process is directly related to the
photoluminescence quantum yield of the material. However,
here the trend observed in the e
ffi
ciency of the device
performance due to the di
ff
erent EWGs,
−
CF
3(
1
) >
−
OCF
3(
2
) >
−
SCF
3(
3
) >
−
SO
2CF
3(
4
), cannot be related to the
Φ
TFPLvalues measured in the thin-
fi
lm con
fi
guration (see
Table
4
), where all complexes show moderate
Φ
TFPLvalues, with
15.9%, 32.6%, 15.7%, and 20.1% for complexes
1
,
2
,
3
, and
4
,
respectively.
It is important to highlight that there is a detrimental e
ff
ect of
the
−
CF
3substituent position from
para
to the Ir
−
C
C^Nin
R3
to the
meta
Ir
−
C
C^Nin
1
at both current densities,
58
where the
maximum luminance decreases from 852 cd m
−2(
R3
) to 427
cd m
−2(
1
) and the external quantum e
ffi
ciency (EQE) is
reduced from 5.4% (
R3
) to 2.7% (
1
), both at 50 A m
−2. LEEC
4
with the strongest EWG,
−
SO
2CF
3, installed on the C^N
ligands presents the lowest performance of the series, which we
attribute exclusively to the electrochemical instability of this
group. Through this study it has become evident that the C^N
ligands cannot be too electron-poor as this results in greater
electrochemical irreversibility leading detrimentally to signi
fi
-cantly poorer LEEC performance.
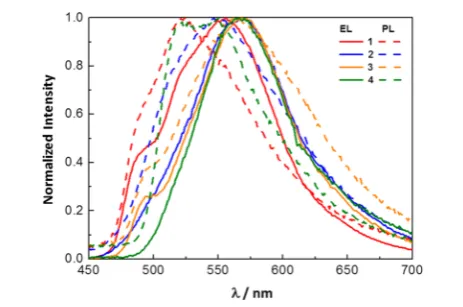
The electroluminescence (EL) and thin-
fi
lm
photolumines-cence (PL) spectra are shown in
Figure 9
. Thin-
fi
lm
photoluminescence (PL) spectra and thin-
fi
lm
Φ
TFPLwere
[image:9.625.328.560.567.720.2]measured using the device composition of the emissive layer
Table 4. Electroluminescence (EL) Data for LEECs 1
−
4 and
Thin-Film Photoluminescence (TFPL) Data for Complexes
1
−
4
compd λmax,EL/nm CIE λmax,TFPLa/nm Φ
TFPLa/% 1 493(sh), 556 (0.37, 0.55) 493(sh), 524 15.9
2 566 (0.44, 0.53) 546 32.6
3 496(sh), 568 (0.44, 0.53) 498(sh), 561 15.7
4 566 (0.45, 0.53) 523, 545 20.1
aλ
exc= 320 nm.
Figure 9.Electroluminescence (EL) spectra (solid line) of LEECs1− 4 and thin-film photoluminescence (PL) spectra (dashed line) of complexes1−4.
spin-coated on a quartz plate. EL and thin-
fi
lm PL maximum
emission wavelengths as well as
Φ
TFPLvalues are provided in
Table 4
. All devices present similar EL maxima at 556, 566, 568,
and 566 nm for LEECs
1
,
2
,
3
, and
4
, respectively. Additionally,
LEECs
1
and
3
have a high-energy shoulder at 493 nm (
1
) and
496 nm (
3
). The thin-
fi
lm PL maxima for
1
−
3
are modestly
blue-shifted at 524, 546, 561 nm, respectively. Similar to their
EL spectra, the thin-
fi
lm PL spectra for
1
and
3
present a
shoulder at 493 nm (
1
) and 498 nm (
3
). The thin-
fi
lm PL
spectrum for
4
presents two maximum emission peaks at 523
and 545 nm. The structured nature of the thin-
fi
lm PL spectra
for
1
,
3
, and
4
mirrors the structured spectra observed in
MeCN solution. Likewise, the broad and unstructured thin-
fi
lm
PL spectrum for
2
has the same form as that observed in
MeCN solution. All EL maxima are red-shifted with respect to
the thin-
fi
lm PL maxima and with respect to the PL maxima
observed in solution, but the position of the shoulder in
complexes
1
and
3
remains at the same wavelength. This
red-shifting of the EL and thin-
fi
lm PL maxima with respect to the
PL maxima in solution is due to the aggregation in the solid
state.
72The similar EL and PL emission pro
fi
les and energies of
3
denote that the nature of the emission is produced from the
same excited state. The absence of structured emission in the
EL spectrum of
4
and its coincident emission energy and pro
fi
le
with that observed in the EL spectrum of
3
could imply an
electrochemical reduction of the
−
SO
2CF
3moiety to an
−
SCF
3group.
The Commision Internationale de l
’
Eclairage (CIE)
coordinates were determined from the electroluminescence
spectra for
1
−
4
(
Table 4
). LEEC
1
presents a blue-green
emission with CIE coordinates (0.37, 0.55), and LEECs
2
−
4
have a green emission with similar CIE coordinates (0.44, 0,53)
for LEEC
2
, (0.44, 0,53) for LEEC
3
, and (0.45, 0.53) for
LEEC
4
.
■
CONCLUSIONS
In summary, four sky-blue to blue-green emitting (
λ
em484
−
525 nm) cationic heteroleptic iridium(III) complexes bearing
electron-withdrawing
fl
uorocarbon ligands have been
synthe-sized, and their optoelectronic properties were investigated.
The complexes exhibit quasireversible
fi
rst oxidation and
reduction peaks, thereby rendering them suitable as emitters
in LEECs. Surprisingly, despite containing stronger EWGs, the
lowest-energy absorption maxima of
1
−
4
are more red-shifted
compared to the reference complexes
R1
and
R2
. While the
trends observed in the absorption spectra of
1
−
4
are not in line
with the predicted trend obtained from singlet TD-DFT
calculations, the triplet spin density calculations are in
agreement with the trend observed for the emission behavior,
except for
2
. However,
1
−
4
were shown to exhibit blue-shifted
emission maxima compared to those of
R1
and
R2
. Thus, this
study demonstrates that the common design paradigm of
achieving bluer emission upon introduction of increasingly
stronger EWG may not always be applicable. Successful
applications of these complexes in LEECs have been achieved,
albeit with moderate external quantum e
ffi
ciencies.
■
EXPERIMENTAL SECTION
General Synthetic Procedures.Commercial chemicals were used as supplied. All reactions were performed using standard Schlenk techniques under inert (N2) atmosphere with reagent grade solvents.
Flash column chromatography was performed using silica gel (Silia-P
from Silicycle, 60 Å, 40−63μm). Analytical thin layer chromatography (TLC) was performed with silica plates with aluminum backings (250
μm with indicator F-254). Compounds were visualized under UV light.1H (for ligands and dimers),13C, and19F NMR spectra were recorded on a Bruker Avance spectrometer at 400, 125, and 376 MHz, respectively.1H NMR spectra for charged complexes were recorded on a Bruker Avance spectrometer at 500 MHz. The following abbreviations have been used for multiplicity assignments: “s” for singlet,“d”for doublet,“t”for triplet,“m”for multiplet, and“br”for broad. Deuterated dimethyl sulfoxide (DMSO-d6) and deuterated
dichloromethane (CD2Cl2) were used as the solvents of record.1H
NMR spectra were referenced to the solvent peak. Melting points (Mp’s) were recorded using open-ended capillaries on an Electro-thermal melting point apparatus and are uncorrected. High-resolution mass spectra were recorded at the EPSRC UK National Mass Spectrometry Facility at Swansea University on a quadrupole time-of-flight (ESI-Q-TOF), model ABSciex 5600 Triple TOF, in positive electrospray ionization mode, and spectra were recorded using sodium formate solution as the calibrant. Elemental analyses were performed by Mr. Stephen Boyer, London Metropolitan University.
Syntheses of Ligands: L1−L4. 2-(4-(Trifl uoromethyl)phenyl)-pyridine (L1). The synthesis is a modification to that previously reported.51 4-Bromotrifluoromethylbenzene (1.2 g, 5.3 mmol, 1.18 equiv), 2-(tri-n-butylstannyl)pyridine (85−95%; 1.66 g, 4.5 mmol, 1 equiv), and [Pd(PPh3)4] (0.23 g, 2 mol %, catalyst) were stirred in dry
degassed toluene at 120°C for 48 h to give a yellow solution. The product was purified by column chromatography twice (the reaction mixture was loaded on the column directly):first on afine mixture of silica and K2CO3 (1.5 g, anhydrous) to remove tin byproducts, and
then just on silica (20 g). The elution was performed with hexane/ dichloromethane (2/1 to 1.5/1 v/v) to afford the compound as a white crystalline solid. Yield: 0.56 g, 56%. 1H NMR (400 MHz,
DMSO-d6)δ(ppm): 8.73 (ddd,J= 4.79, 1.80, 0.94 Hz, 1H), 8.31 (dd, J= 8.90, 0.86 Hz, 2H), 8.08 (dt,J= 8.04, 1.03 Hz, 1H), 7.92−7.98 (m, 1H), 7.86 (dd,J= 8.81, 0.77 Hz, 2H), 7.45 (ddd,J= 7.48, 4.75, 1.11 Hz, 1H).19F{1H} NMR (376 MHz, DMSO-d
6)δ(ppm):−61.03. The
characterization matches that previously reported.51
2-(4-(Trifluoromethoxy)phenyl)pyridine (L2). 1-Bromo-4-(trifluoromethoxy)benzene (1.27 g, 5.3 mmol), 2-(tri-n -butylstannyl)-pyridine (85−95%; 1.53 g, 4.2 mmol), and [Pd(PPh3)4] (0.21 g, 1.82
mol %) were stirred in dry degassed toluene at 120°C for 48 h to give yellow solution. The product was purified by column chromatography twice (the reaction mixture was loaded on the column directly):first on a fine mixture of silica and K2CO3 (1.5 g) to remove tin
byproducts, and then just on silica (20 g). The elution was performed with hexane/dichloromethane (2/1 by volume) to afford the compound as a white crystalline solid. Yield: 0.8 g, 80%. Rf: 0.28
(1:1, v/v dichloromethane/hexanes on silica). Mp: 52−54 °C. 1H
NMR (400 MHz, DMSO-d6)δ(ppm): 8.67−8.70 (m, 1H), 8.19−8.24
(m, 2H), 8.01 (dt,J= 8.04, 1.03 Hz, 1H), 7.89−7.94 (m, 1H), 7.46− 7.50 (m, 2H), 7.39 (ddd,J= 7.44, 4.79, 1.11 Hz, 1H).13C NMR (125
MHz, DMSO-d6) δ (ppm): 154.56, 149.67, 148.97, 137.87, 137.44,
128.49, 123.17, 123.02, 121.19, 120.47, 119.09, and 117.05.19F{1H}
NMR (376 MHz, DMSO-d6)δ(ppm):−56.67. HR NSI+MS: [M +
H]+ calcd 240.0631 ([C
12H9F3NO]+); found 240.0632. Anal. Calcd
(C12H8F3NO): C, 60.26; H, 3.37; N, 5.86%. Found: C, 60.38; H, 3.26;
N, 5.88%. The characterization matches that previously reported.51
2-(4-((Trifluoromethyl)thio)phenyl)pyridine (L3). 4-Bromophenyl-trifluoromethyl sulfide (1.22 g, 4.719 mmol), 2-(tri-n -butylstannyl)-pyridine (85−95%; 1.43 g, 3.9 mmol), and [Pd(PPh3)4] (0.22 g, 1.90
mol %) were stirred in dry degassed toluene (15 mL) at 120°C for 48 h to give yellow solution. The product was purified by column chromatography twice (the reaction mixture was loaded on the column directly):first on afine mixture of silica (15 g) and K2CO3
(1.5 g, anhydrous) to remove tin byproducts, and then just on silica (20 g). The elution was performed with hexane/dichloromethane (2/1 by volume) to afford the compound as a white crystalline solid. Yield: 0.76 g, 77%.Rf: 0.34 (1:1, v/v dichloromethane/hexanes on silica).
Mp: 64−66°C.1H NMR (400 MHz, DMSO-d
1H), 7.94 (td,J= 7.8, 1.8 Hz, 1H), 7.86−7.81 (m, 2H), 7.43 (ddd,J= 7.4, 4.7, 1.1 Hz, 1H). 13C NMR (125 MHz, DMSO-d
6) δ (ppm):
154.42, 149.80, 141.45, 137.52, 136.49, 130.85, 128.40, 127.92, 125.96, 123.59, 123.51, and 120.90.19F{1H} NMR (376 MHz, DMSO-d
6) δ
(ppm): −41.9. HR APCI MS: [M + H]+ calcd 256.0402
([C12H9F3NS]+); found 256.0402. Anal. Calcd (C12H8F3NS): C,
56.47; H, 3.16; N, 5.49%. Found: C, 56.40; H, 3.00; N, 5.61%.
2-(4-((Trifluoromethyl)sulfonyl)phenyl)pyridine (L4).The reaction was performed under nitrogen. 1-Bromo-4-[(trifl uoromethyl)-sulfonyl]benzene (1 g, 3.5 mmol, excess), 2-(tri-n -butylstannyl)-pyridine (85−95%; 1.2 g, 3.3 mmol), and [Pd(PPh3)4] (0.18 g, 1.56
mol %, catalyst) were stirred in dry degassed toluene (10 mL) at 120 °C for 24 h to give orange solution. The product was purified by column chromatography twice (the reaction mixture was loaded on the column directly):first on afine mixture of silica (15 g) and K2CO3
(1.5 g, anhydrous) to remove tin byproducts, and then just on silica (20 g). The elution was performed with hexane/dichloromethane (2/1 to 1/1 by volume). The impurities closely precede and follow the product. One of the preceding impurities coelutes with the product and can be removed by recrystallization using the following protocol. The crude product was dissolved in dichloromethane (10 mL). Ethanol (10 mL) was added to this solution. Dichloromethane was rotor-evaporated to give a suspension of the impurity in ethanol. The mixture was allowed to settle and crystallize at room temperature overnight. The suspension was filtered. The solid was mainly the impurity. Thefiltrate was evaporated to give sufficiently pure product as a white crystalline solid to be used in the next step. We note that recrystallization from dichloromethane/hexane in the same manner does not separate the impurity from the product. Yield: 0.52 g, 55%.
Rf: 0.20 (1:1, v/v dichloromethane/hexanes on silica). Mp: 71−73°C. 1H NMR (400 MHz, DMSO-d
6)δ(ppm): 8.78 (ddd,J= 4.8, 1.8, 1.0
Hz, 1H), 8.57−8.51 (m, 2H), 8.28−8.23 (m, 2H), 8.19 (dt,J= 8.0, 1.0 Hz, 1H), 8.01 (td,J= 7.7, 1.8 Hz, 1H), 7.52 (ddd,J= 7.6, 4.8, 1.1 Hz, 1H). 13C NMR (125 MHz, DMSO-d6) δ (ppm): 153.18, 150.13,
146.99, 137.83, 131.35, 129.26, 128.51, 124.57, 121.95, 120.75, 118.16, and 115.57.19F{1H} NMR (376 MHz, DMSO-d6)δ (ppm):−78.5.
HR NSI+MS: [M + H]+calcd 288.0301 ([C12H9F3NO2S]+); found
288.0301. Anal. Calcd (C12H8F3NO2S): C, 50.18; H, 2.81; N, 4.88%.
Found: C, 50.30; H, 2.72; N, 4.85%.
Syntheses of Precursor Ir-Dimers of General Molecular Formula [Ir(C^N)2(μ-Cl)]2: D-L1−D-L4. Tetrakis[2-(4-(trifluoromethyl)phenyl)pyridinato-N,C2′]-bis(μ-chloro)diiridium(III)
[Ir(L1)2(μ-Cl)]2(D-L1).IrCl3·3H2O (142 mg, 0.40 mmol; iridium(III)
chloride hydrate) was dissolved in a degassed mixture of 2-ethoxyethanol (6 mL) and water (2 mL) at 70°C (bath temperature). LigandL1(203 mg, 0.91 mmol) was added as a solid. The mixture was stirred at 120°C (bath temperature) for 24 h to give a pale orange solution. The solution was cooled to room temperature. Water (5 mL) was added dropwise to give a precipitate. The solid wasfiltered and washed with small volumes of ethanol/water (1/1 v/v) and with a large volume of hexane. The solid was dried under vacuum to afford the compound as a yellow solid. The product was used as a reagent for the next step without further purification. Yield: 0.205 g, 76%. 1H NMR (400 MHz, CD2Cl2)δ(ppm): 9.16−9.22 (m, 1 H), 8.05 (d,J=
7.87 Hz, 1 H), 7.90−7.96 (m, 1 H), 7.68 (d,J= 8.04 Hz, 1 H), 7.06− 7.11 (m, 1 H), 6.97 (ddd,J= 7.44, 5.82, 1.45 Hz, 1 H), 6.08 (d,J= 1.20 Hz, 1 H).19F{1H} NMR (376 MHz, CD2Cl2)δ(ppm):−63.26.
The characterization matches to that previously reported.51
Tetrakis[2-(4-(trifluoromethoxy)phenyl)pyridinato-N,C2′]-bis(μ
-chloro)diiridium(III), [Ir(L2)2(μ-Cl)]2 (D-L2).[Ir(COD)Cl]2 (250 mg,
0.37 mmol) and ligand L2 (375 mg, 1.57 mmol) were stirred in degassed 2-ethoxyethanol (4 mL) at 130°C (bath temperature) for 5 h. The mixture briefly turned black on mixing and heating, but became a dark orange solution by the end of the reaction. The solution was cooled to room temperature. Water (4 mL) was added dropwise to give a precipitate. The solid wasfiltered and washed with ethanol/ water (1/1 v/v) and hexane. The solid was dried under vacuum to afford the compound as a yellow solid. The product was used as a reagent for the next step without further purification. Yield: 0.377 g, 72%.1H NMR (400 MHz, CD
2Cl2)δ(ppm): 9.12−9.17 (m, 1 H),
7.95 (d,J= 7.53 Hz, 1 H), 7.87 (td,J= 7.74, 1.63 Hz, 1 H), 7.61 (d,J
= 8.55 Hz, 1 H), 6.89 (ddd,J= 7.36, 5.82, 1.54 Hz, 1 H), 6.69−6.74 (m, 1 H), 5.64 (dd,J= 2.31, 1.11 Hz, 1 H).19F{1H} NMR (376 MHz,
CD2Cl2) δ (ppm): −57.74. The characterization matches that
previously reported.51
Tetrakis[2-(4-((trifluoromethyl)thio)phenyl)pyridinato-N,C2′
]-bis-(μ-chloro)diiridium(III), [Ir(L3)2(μ-Cl)]2 (D-L3). [Ir(COD)Cl]2 (250
mg, 0.37 mmol) and ligandL3(403 mg, 1.58 mmol) were stirred in degassed 2-ethoxyethanol (4 mL) at 130°C (bath temperature) for 5 h. The mixture briefly turned black on mixing and heating but became a pale red solution by the end of the reaction. The solution was cooled to room temperature. Water (4 mL) was added dropwise to give a precipitate. The solid wasfiltered and washed with ethanol/water (1/1 by volume) and hexane. The solid was dried under vacuum to afford the compound as a yellow-orange solid. The product was used as a reagent for the next step without further purification. Yield: 0.498 g, 91%.1H NMR (400 MHz, CD
2Cl2)δ(ppm): 9.19 (ddd,J= 5.8, 1.6,
0.8 Hz, 4H), 8.02 (ddd,J= 8.3, 1.4, 0.7 Hz, 4H), 7.90 (ddd,J= 9.0, 7.5, 1.6 Hz, 4H), 7.61 (d,J= 8.1 Hz, 4H), 7.11 (dd,J= 8.1, 1.8 Hz, 4H), 6.93 (ddd,J= 7.4, 5.8, 1.4 Hz, 4H), 6.09 (d,J= 1.2 Hz, 4H).
19F{1H} NMR (376 MHz, CD
2Cl2)δ(ppm):−42.8.
Tetrakis[2-(4-((trifluoromethyl)sulfonyl)phenyl)pyridinato-N,C2′
]-bis(μ-chloro)diiridium(III), [Ir(L4)2(μ-Cl)]2 (D-L4). IrCl3·3H2O (220
mg, 0.62 mmol; iridium(III) chloride hydrate) was dissolved in a degassed mixture of 2-ethoxyethanol (6 mL) and water (2 mL) at 70 °C (bath temperature). LigandL4(400 mg, 1.39 mmol) was added as a solid. The mixture was stirred at 120°C (bath temperature) for 24 h to give a red solution. The solution was cooled to room temperature to give a red suspension. Water (2 mL) was added dropwise to give precipitate. The solid wasfiltered and washed with ethanol/water (1/1 v/v) and with hexane. The solid was dried under vacuum to afford the compound as an orange solid. The product was used as a reagent for the next step without further purification. Yield: 0.445 g, 90%. 1H
NMR (400 MHz, CD2Cl2)δ(ppm): 9.21 (ddd,J= 5.8, 1.5, 0.8 Hz,
4H), 8.19 (d,J= 7.7 Hz, 4H), 8.07 (ddd,J= 9.1, 7.5, 1.6 Hz, 4H), 7.84 (d,J= 8.2 Hz, 4H), 7.49 (dd,J= 8.2, 1.9 Hz, 4H), 7.11 (ddd,J= 7.4, 5.8, 1.4 Hz, 4H), 6.38 (d,J= 1.4 Hz, 4H).19F{1H} NMR (376 MHz,
CD2Cl2)δ(ppm):−79.4.
Syntheses of Cationic Ir-Complexes of General Molecular F o r m u l a [ I r ( C ^ N )2( d t B u b p y ) ] ( P F6) : 1−4 . B i s [ 2 ( 4 -(trifluoromethyl)phenyl)pyridinato-N,C2′](4,4′-di-tert-butyl-2,2′
-dipyridyl)iridium(III) hexafluorophosphate, [Ir(L1)2(dtBubpy)](PF6), 1.Precursor dimer complexD-L1(200 mg, 0.15 mmol) and 4,4′
-di-tert-butyl-2,2′-bipyridine (88 mg, 0.33 mmol) were stirred in a degassed mixture of dichloromethane (20 mL) and methanol (4 mL) at 40°C (bath temperature) for 24 h to give a yellow solution. The solution was evaporated. The complex was purified by column chromatography on silica (12 g). The elution was performed with 3% of methanol in dichloromethane to remove the impurities and with 6% of methanol in dichloromethane to give a yellow eluate of the product. The fractions were evaporated to dryness. The product was redissolved in methanol (5 mL), and added to a vigorously stirred aqueous solution (30 mL) of NH4PF6(1.4 g, 8.6 mmol) over 30 min
to give a precipitate of the hexafluorophosphate salt. The product was filtered and washed with water and ether/hexane (1/1 v/v). The product was dissolved in 2 mL of dichloromethane and added to 40 mL of vigorously stirred ether. The product separatedfirst as oil, but then it crystallized to a solid. The product wasfiltered, washed with ether, and dried under vacuum to afford a yellow solid. Yield: 0.221 g, 70%.Rf: 0.71 (5% MeOH in dichloromethane on silica). Mp: 276−
280°C.1H NMR (500 MHz, CD
2Cl2)δ(ppm): 8.32 (d,J= 1.7 Hz,
2H), 8.07 (d,J= 8.0 Hz, 2H), 7.91 (dt,J= 7.6, 1.5 Hz, 2H), 7.86 (d,J
= 8.2 Hz, 2H), 7.82 (d,J= 5.8 Hz, 2H), 7.59 (dd,J= 5.8, 0.7 Hz, 2H), 7.47 (dd,J= 5.9, 1.9 Hz, 2H), 7.34 (dd, J= 8.2, 1.1 Hz, 2H), 7.16 (ddd,J= 7.3, 5.8, 1.4 Hz, 2H), 6.46 (d,J= 0.8 Hz, 2H), 1.43 (s, 18H).
13C NMR (125 MHz, CD
2Cl2) δ (ppm): 166.17, 164.60, 155.42,
150.15, 149.83, 149.00, 147.41, 138.91, 131.45, 131.21, 127.27, 125.88, 124.87, 124.72, 121.34, 120.93, 119.88, 35.69, 29.94.19F{1H} NMR
(376 MHz, CD2Cl2)δ(ppm):−73.3 (d,J= 713 Hz, PF6−),−63.2 (s,
CF3). HR NSI+ MS: [M − PF6]+ (100%) calcd 905.2627