ISSN Online: 1945-3124 ISSN Print: 1945-3116
DOI: 10.4236/jsea.2019.126013 Jun. 28, 2019 215 Journal of Software Engineering and Applications
Optimization Model for
School Transportation Based on
Supply-Demand Analyses
Jairo Ortega
1, János
Tóth
1, Juan Palaguachi
2, Imad Sabbani
31Department of Transport Technology and Economics, Budapest University of Technology and Economics, Budapest, Hungary 2Department of Transportation, Escuela Superior Politécnica of Chimborazo, Riobamba, Ecuador
3Department of Sciences and Techniques, University of Hassan II and Franche-Comté University, Besançon, France
Abstract
This paper presents a new conception model of school transportation supply-demand ratio (STSDR) in order to define the number of school buses needed in a limited area and to describe the conditions of school transport system. For this purpose, a mathematical equation was elaborated to simulate the real system based on the school transport conditions and on the estimated results of STSDR from 15 zones of Cuenca city in Ecuador. The data used in our model was collected from several diverse sources (i.e. administrative data and survey data). The estimated results have shown that our equation has de-scribed efficiently the school transport system by reaching an accuracy of 96%. Therefore, our model is suitable for statistical estimation given adequate data and will be useful in school transport planning policy. Given that, it is a support model for making decisions which seek efficiency in supply and de-mand balance.
Keywords
School Transport, Model Optimization, Supply-Demand, Travel to School
1. Introduction
School transportation is the process of generating a set of school buses that effi-ciently transports students to and from their schools safely and on time. Mean-while, school travel is short journey reliably made for several students together. Therefore, school transportation and School travel are vital for policy decisions How to cite this paper: Ortega, J., Tóth, J.,
Palaguachi, J. and Sabbani, I.(2019) Opti-mization Model for School Transportation Based on Supply-Demand Analyses. Jour-nal of Software Engineering and Applica-tions, 12, 215-225.
https://doi.org/10.4236/jsea.2019.126013
Received: May 2, 2019 Accepted: June 25, 2019 Published: June 28, 2019
Copyright © 2019 by author(s) and Scientific Research Publishing Inc. This work is licensed under the Creative Commons Attribution International License (CC BY 4.0).
http://creativecommons.org/licenses/by/4.0/
DOI: 10.4236/jsea.2019.126013 216 Journal of Software Engineering and Applications which may have a substantial impact on school district funding, student safety, and student access to different schools. However, the school bus transportation has been traditionally viewed as secondary or even tertiary concerns relative to mobility impacts by the governments and authorities across the globe. The rela-tive lack of academic and policy attention in this area merits nowadays more implications in policy, planning and projects.
Recently some researchers have focused on optimizing school transport from different viewpoints in literature i.e. demand analysis [1] school transport time [2] supply transport [3] number of students [4] number of seats [5] number of vehicles [6], and so on. For example in [7], authors have described and evaluated a practical computer-based method for translating data concerning 1) the loca-tion of each school 2) the localoca-tion of each student, 3) the time, and 4) the availa-ble buses. Other authors have proposed [8] a multi-objective problem, for which there are 71 possible optimal options, which minimize school transport cost be-tween 2.7% and 35.1% regarding current school transport routes, with different school start time and minimum travel time for students. [9] has developed an es-timation model of urban transportation supply-demand ratio (TSDR) to quanti-tatively describe the conditions of an urban transport system and to support a theoretical basis for transport policy-making. According to authors, the esti-mated results indicate that an urban TSDR can be classified into four grades representing four transport conditions: “scarce supply”, “short supply”, “supply-demand balance” and “excess supply”.
The purpose of this paper is to propose a new conception model of school transportation supply-demand ratio (STSDR) in order to describe the conditions of school transport system and to support theoretical and mathematical basis for transport policy-making. Based on these, this paper is organized as follows. Sec-tion II details our data used in our model. SecSec-tion 3 describes the area of this study and presents results of STSDR from 15 zones of Cuenca city in Ecuador. Concluding and discussion are given in Section 4.
2. Data and Research Design
DOI: 10.4236/jsea.2019.126013 217 Journal of Software Engineering and Applications
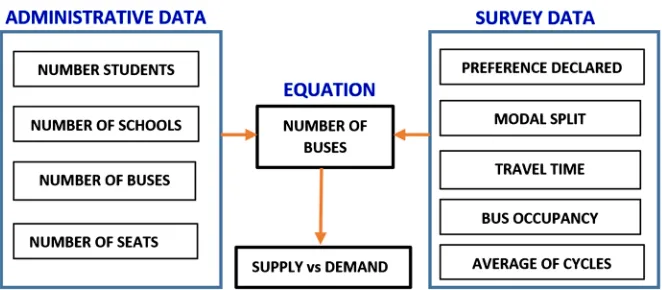
Figure 1. Linked administrative and survey data.
2.1. Administrative Data
Administrative-data is a source of large and complex quantitative information which derive from operation of administrative systems, typically by government departments and other organization for the purpose of registration, transaction and record keeping [10]. These datasets have been used to produce official sta-tistics to inform policymaking. The potential for this data to be accessed for the purposes of social science research is increasingly recognized, although as yet has not been fully exploited. In our case, administrative-data is collected using data from the following sources:
• School Ministry—2016 • Mobility Plan 2015-2017
School Ministry data was provided by the Education Government and con-tains information about the number of students and location of schools per zone (Z), using all transports modes bus, taxi, private vehicle and their combinations, which represent the future-demand in our model. On the other hand, the Mobil-ity Plan 2015-2017 provided us the total number of buses (417) and their dis-patching per zone, which represent supply. Figure 2 shows the geographical dis-tribution of students in Cuenca city in comparison with the number of buses dedicated per zone.
DOI: 10.4236/jsea.2019.126013 218 Journal of Software Engineering and Applications
Figure 2. (a) Students, (b) number of buses.
2.2. Survey Data
Survey data has become one of the most important sources of information for policymakers and source of data with great potential for forecasting social and economic topics. This method allowed us to produce certain statistical measures in a relatively short period. More recently, researchers have tended to link survey data with administrative records [11] [12], in order to collect the necessary data that cannot be obtained by the administrative data, and the ability to drive the design, rather than being limited to existing data. In this study, we elaborated two surveys based on supply and demand with the purpose to define the stu-dent’s preferences and the buses occupancy.
2.2.1. Demand Approach
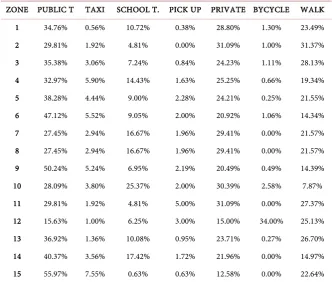
DOI: 10.4236/jsea.2019.126013 219 Journal of Software Engineering and Applications alternative modal choice, car ownership, and basic demographics. We used a level of confidence around 95% and margin mistake 5%. According to the design of the sample, it is appropriate to apply this expansion factor to each selected student, which depends on the number of students, in our case 75.574. Accord-ing to the equation of the sample size, we had to survey 4929 students. The ex-pansion factors include a population adjustment, according to the projections to the date of the survey, in order to increase the precision of the estimates. Table 1 shows a summary of the student’s travel mode choice after completion of our survey in each zone, which represents one of the most influence factors in polit-ic-maker decision. We can distinguish that walking to school, using public or private transport are the most frequent in Cuenca city. The school transport is restricted in less than 20% in majority of zones. Public Transport and private ve-hicle are clearly the two primary modes chosen for school trips. Non-motorized modes (pedestrian and bicycle) accounted for less than 25% of all school trips. Travel by contracted taxi about 1% of the trips as shown in Table 1.
[image:5.595.206.539.355.637.2]The declared preference of Cuenca city students is shown in Table 2. We can understand from Table 2, that we have an equitable repartition of around 50%
Table 1. Model split school transportation of Cuenca city.
ZONE PUBLIC T TAXI SCHOOL T. PICK UP PRIVATE BYCYCLE WALK 1 34.76% 0.56% 10.72% 0.38% 28.80% 1.30% 23.49% 2 29.81% 1.92% 4.81% 0.00% 31.09% 1.00% 31.37% 3 35.38% 3.06% 7.24% 0.84% 24.23% 1.11% 28.13% 4 32.97% 5.90% 14.43% 1.63% 25.25% 0.66% 19.34% 5 38.28% 4.44% 9.00% 2.28% 24.21% 0.25% 21.55% 6 47.12% 5.52% 9.05% 2.00% 20.92% 1.06% 14.34% 7 27.45% 2.94% 16.67% 1.96% 29.41% 0.00% 21.57% 8 27.45% 2.94% 16.67% 1.96% 29.41% 0.00% 21.57% 9 50.24% 5.24% 6.95% 2.19% 20.49% 0.49% 14.39% 10 28.09% 3.80% 25.37% 2.00% 30.39% 2.58% 7.87% 11 29.81% 1.92% 4.81% 5.00% 31.09% 0.00% 27.37% 12 15.63% 1.00% 6.25% 3.00% 15.00% 34.00% 25.13% 13 36.92% 1.36% 10.08% 0.95% 23.71% 0.27% 26.70% 14 40.37% 3.56% 17.42% 1.72% 21.96% 0.00% 14.97% 15 55.97% 7.55% 0.63% 0.63% 12.58% 0.00% 22.64%
Table 2. Preference declared.
DOI: 10.4236/jsea.2019.126013 220 Journal of Software Engineering and Applications of students would like to use school buses and the other 50% opt for other mod-es of transport.
2.2.2. Supply Approach
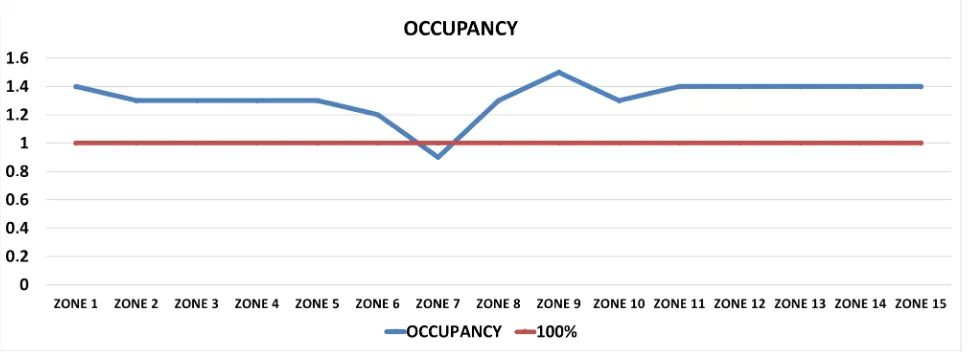
The supply measurement aimed to define the buses occupancy and their number of cycles. We conducted a survey dedicated to 417 bus drivers between June and August in 2016, which comprises questions about the number of students and travel time per cycle bus. C values represent the range of the index occupancy which one zone is less than 100%. One hundred per cent of occupancy is consi-dered when each school bus carried twenty students (Figure 3).
The methodology is based on the determination of the average of number of cycles in each zone. For this proposed, the number of cycles in each bus is deter-mined. Table 3 shows us a result of the average number of cycles in each zone.
2.3. Model Formulation
The proposed model uses a mathematical formula for obtaining the optimum number of school buses related to each zone and supply level. The principal as-sumption is the relation between the number of students to be transported and the bus school capacity. Equation (1).
1 2
1 1 1 2 2 2
i i
i i i
D D D
Nv z
S IO NC S IO NC S IO NC
= = + +
∗ ∗ ∗
∗ ∗ ∗
∑
(1)where Nv is the number of school buses, Z represents the zone index, Di is the
number of students * declared preference, Si is the bus capacity, IOiindex
occu-pancy and NCi represents the average of cycles.
[image:6.595.222.539.354.387.2]The model considers a cycle (NCi) the dynamic of the student taking the
Figure 3. Occupancy per zone.
Table 3. Number of cycles.
[image:6.595.59.543.465.641.2]DOI: 10.4236/jsea.2019.126013 221 Journal of Software Engineering and Applications school transport at a daily time from home to school or from school to home, in our model the number of cycles varies between one to four per bus. The fu-ture-demand (number of students * declared preference Equation (2)), who are willingness to use for a bus school is indicated by Di, as result, high
fu-ture-demand for bus school induce to increase of the number of school buses. The opposite may also occur, decreasing demand resulting in a decrease in the number of school buses. The number of buses needed is a function of the num-ber of bus capacity, which has a seating capacity of twenty seats represent by Si.
The percentage of occupancy (IOi)is relation between the number of student per
bus and bus capacity, in our case the occupancy increases when increasing the number of students. The number of buses is grouped into three scenarios in-cluding one above (short-supply) and one below (excess supply) average catego-ry supply-demand equilibrium.
3. Experimental Analysis
In this section, we present the results obtained by our approach. Firstly, we in-troduce our results based on three scenarios short supply, excess supply and equilibrium supply. Then, we evaluate our model by the equilibrium graphic.
3.1. Estimated Results of the STSDR Model
The problem of the school buses repartition has been solved in Cuenca city us-ing our new mathematical formulation. Table 4 and Figure 4 show the findings of the bus school transport supply measurement using the STSDR model as de-scribed above. For example, the number of buses needed within zone number seven was calculated as following:
(
number of students declared preference)
number of surveysi
D = ∗
(
)
7 642 130 241
D = ×
7 346
D =
i i
i i i
D
Nv z
S IO NC
= ∗ ∗
∑
7 346 20 1 4Nv =
× × 7 4 Nvneeded = 7 5 Nvbefore =
7 7 1
Results=Nvneeded −Nvbefore = −
We introduce our results on three scenarios:
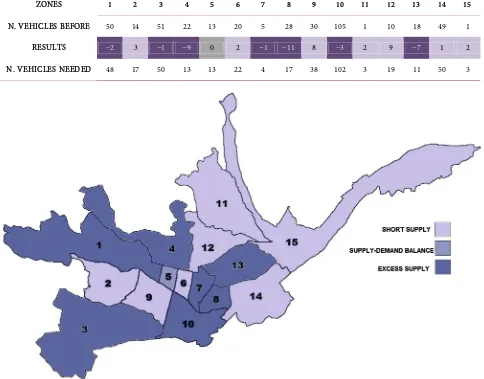
1) Short supply is provided for seven zones (2, 6, 9, 11, 12, 14 and 15) includ-ing 30,514 of 75,000 students, which are considered future-demand.
DOI: 10.4236/jsea.2019.126013 222 Journal of Software Engineering and Applications which there are seven zones (1, 3, 4, 7, 8, 10 and 13) with 42,272 students where the number of buses is more than the future-demand as seen in Table 4.
3) The Supply-demand equilibrium is applied only in zone 5, where all the factors (i.e. future-demand, bus capacity, index occupancy and the number of cycles) are in balance and not leading to further change.
3.2. Evaluation of Our Proposed Model Formulation
[image:8.595.57.541.325.704.2]We evaluate our model formulation using two supply-demand graphs, which reproduce the supply-demand behavior in Cuenca city based on 417 school bus-es distributed in 15 zonbus-es with 75,000 students as seen in Figure 5. Figure 5 il-lustrates the negative relationships between the number of students and the number of school buses in Cuenca city before applying our model. Figure 6 represents the optimum repartition of school buses in each zone in Cuenca city based on our mathematical formulation with an accuracy of 96%.
Table 4. Number of buses in Cuenca city.
ZONES 1 2 3 4 5 6 7 8 9 10 11 12 13 14 15
N. VEHICLES BEFORE 50 14 51 22 13 20 5 28 30 105 1 10 18 49 1
RESULTS −2 3 −1 −9 0 2 −1 −11 8 −3 2 9 −7 1 2
N. VEHICLES NEEDED 48 17 50 13 13 22 4 17 38 102 3 19 11 50 3
DOI: 10.4236/jsea.2019.126013 223 Journal of Software Engineering and Applications
[image:9.595.58.538.289.525.2]Figure 5. Graph evaluation supply-demand.
Figure 6. Graph evaluation supply-demand application STSDR.
4. Conclusion
This paper has developed a new model of school transportation supply-demand ratio (STSDR) for calculating the number of buses needed within a limited area, from a model formulation and a linking between administrative and survey data. This applied methodology resolves two main problems: 1) to identify and to theorize the causal relationship between administrative and survey data and, 2) to repartition school buses within a limited area.
capaci-DOI: 10.4236/jsea.2019.126013 224 Journal of Software Engineering and Applications ty, 3) index occupancy; and 4) average of cycles.
The results obtained to improve the buses distribution have reached an accu-racy of 96%. Therefore, future research can make use of this model to further the current understanding of school transportation behavior. This understanding, in due course, will help the development of interventions focused on student’s mo-bility and will contribute towards the development of methodologies in the years to come.
Acknowledgements
The authors would like to thank Rodrigo Moreno and Juan Jose Carrasco for his technical support and assistance with this project. This research was supported by The Budapest University of Technology and Economics, Hungary.
Conflicts of Interest
The authors declare no conflicts of interest regarding the publication of this pa-per.
References
[1] Rodrigue, J.-P. (2017) The Geography of Transport System. Routledge, New York, 440.
[2] Ibeas, A., Moura, J.L. and dell’Olio, L. (2009) Planning School Transport: Design of Routes with Flexible School Opening Times. Transportation Planning and Tech-nology, 32, 527-544. https://doi.org/10.1080/03081060903374734
[3] Florian, M. and Gaudry, M. (1980) A Conceptual Framework for the Supply Side in Transportation Systems. Transportation Research Part B: Methodological, 14, 1-8.
https://doi.org/10.1016/0191-2615(80)90029-6
[4] De Witte, A., Macharis, C., Lannoy, P., Polain, C., Steenberghen, T. and Van de Walle, S. (2006) The Impact of “Free” Public Transport: The Case of Brussels.
Transportation Research Part A: Policy and Practice, 40, 671-189.
https://doi.org/10.1016/j.tra.2005.12.008
[5] Spada, M., Bierlaire, M. and Liebling, T.M. (2005) Decision-Aiding Methodology for the School Bus Routing and Scheduling Problem. Transportation Science, 39, 443-556. https://doi.org/10.1287/trsc.1040.0096
[6] Schlossberg, M., Greene, J., Phillips, P.P., Johnson, B. and Parker, B. (2006) School Trips: Effects of Urban Form and Distance on Travel Mode. Journal of the Ameri-can Planning Association, 72, 337-346. https://doi.org/10.1080/01944360608976755
[7] Newton, R.M. and Thomas, W.H. (1974) Bus Routing in a Multi-School System.
Computers & Operations Research, 1, 213-222.
https://doi.org/10.1016/0305-0548(74)90047-1
[8] Ezquerro Eguizábal, S., Moura Berodia, J.L., Ibeas Portilla, Á. and Benavente Ponce, J. (2018) Optimization Model for School Transportation Design Based on Economic And Social Efficiency. Transport Policy, 67, 93-101.
[9] Wu, C., Pei, Y. and Gao, J. (2015) Model for Estimation Urban Transportation Supply-Demand Ratio. Mathematical Problems in Engineering, 2015, Article ID: 502739. https://doi.org/10.1155/2015/502739
DOI: 10.4236/jsea.2019.126013 225 Journal of Software Engineering and Applications
and Benefits. A Perpective from the United Kingdom. Facing the Future: European Research Infrastructure for the Humanities and Social Sciences.
[11] O’Hara, A., Shattuck, R.M. and Goerge, R.M. (2016) Linking Federal Surveys with Administrative Data to Improve Research on Families. The Annals of the American Academy of Political and Social Science, 669, 63-74.
https://doi.org/10.1177/0002716216678391