ISSN Online: 2164-5396 ISSN Print: 2164-5388
Role of Self-Loop in Cell-Cycle Network of
Budding Yeast
Shu-ichi Kinoshita
1,2, Hiroaki Yamada
31Department of Mathematical Engineering, Faculty of Engeneering at Musashino University, Tokyo, Japan 2Institute for Advanced Study of Mathematical Sciences (MIMS), Meiji University, Tokyo, Japan
3Yamada Physics Research Labolatory (YPRL), Niigata, Japan
Abstract
Study of network dynamics is very active area in biological and social sciences. However, the relationship between the network structure and the attractors of the dynamics has not been fully understood yet. In this study, we numerically investigated the role of degenerate self-loops on the attractors and its basin size using the budding yeast cell-cycle network model. In the network, all self-loops negatively suppress the node (self-inhibition loops)
and the attractors are only fixed points, i.e. point attractors. It is found that
there is a simple division rule of the state space by removing the self-loops when the attractors consist only of point attractors. The point attractor with largest basin size is robust against the change of the self-inhibition loop. Fur-thermore, some limit cycles of period 2 appear as new attractor when a self-activation loop is added to the original network. It is also shown that even in that case, the point attractor with largest basin size is robust.
Keywords
Gene Regulatory Network, Attractors, Budding Yeast, Degenerate Self-Loop
1. Introduction
Recently, some networks representing metabolic reactions in the cell and gene regulatory responses through transcription factors have been elucidated along with progress of experimental systems and accumulation technology in the
da-tabase [1]. In addition, researches on characterizing the state of the cells as a
complex network utilizing these databases have been actively investigated [2] [3]
[4] [5].
Moreover, the deterministic discrete-time dynamics for discrete-state model
How to cite this paper: Kinoshita, S. and Yamada, H. (2019) Role of Self-Loop in Cell-Cycle Network of Budding Yeast. Open Journal of Biophysics, 9, 10-20.
https://doi.org/10.4236/ojbiphy.2019.91002
Received: November 9, 2018 Accepted: December 14, 2018 Published: December 17, 2018
Copyright © 2019 by authors and Scientific Research Publishing Inc. This work is licensed under the Creative Commons Attribution International License (CC BY 4.0).
http://creativecommons.org/licenses/by/4.0/
Open Access
with such network structures have been widely studied on the properties of the attractors that represent cellular activity states. This is because the state space is finite, so it is easy to search the fixed points and the periodic solutions using
computer power. For example, Kauffman et al. modeled the early cells before
differentiation with the dynamics of the network, and made the type of the
at-tractors correspond to the type of cells after the differentiation [6] [7] [8] [9]. On
the other hand, Li et al. discovered that in the model of the gene regulatory
net-work related to the cell-cycle, there is a fixed point with a very large basin size, and the transition process to the fixed point corresponds to the expression
pat-tern of the gene in each process of the cell-cycle [10]. It should be noticed that in
the network of the Kauffman et al., there is no self-regulating factor (self-loop),
but in the model of Li et al. the existence of the self-loops has influence on the
attractors. Very recently, in other systems such as fission yeast cell cycle and mammalian cell cycle, the Boolean network models for the regulation have also been studied [11] [12] [13].
In this study, using the same gene regulatory network as Li et al. for the
bud-ding yeast, we clarify the relationship between the fixed points (point attractors) with large basin size and the presence of the self-loops in the network. It is found that there is a simple division rule of the state space by removing the self-loops, and the point attractors with largest basin size (BS) is robust against the
chang-ing the self-loops. The similar results are obtained for C. elegans early embryonic
cell cycles as well [14].
2. Model
Here, we give some basic properties of the Boolean network model of the
cell-cycle regulation for the budding yeast. Let us take the binary value
{ }
0,1 asthe state Si of each node i corresponding to the numbered genes as given in
Table 1. The states 1 and 0 correspond to expressed and unexpressed genes, re-spectively and the attractors of the dynamics are associated to cell differentia-tion. The effect on the node i from the other node j
( )
≠i is defined as( ) ,
N i ij j
j i
B a S
≠
=
∑
(1)where N is the total number of the nodes, and aij denotes matrix element of
the weighted adjacency matrix A representing the interaction between the genes.
We take aij = +1 when the node j positively regulates the node i (positive
inte-raction), and aij = −1 when the node j negatively suppresses the node i
(nega-tive interaction).
The node without the self-loop, i.e. aii =0, follows a threshold dynamics from
discrete time t to t+1 (t∈N) by using the parallel updating scheme as follows:
(
)
(
(
( )
( )
)
)
( )
(
( )
)
0
1 1
i i
i i i
i i i
B t
S t B t
S t B t
θ
θ
θ
<
+ = >
=
(2)
Table 1. Seven attractors in the original gene regulatory network. (All are point attrac-tors.) The third line shows that there is a degenerate self-loop when mark ○ is present in the node. In the decimal notation, each attractor is displayed as, ( )0
1 68 A = , ( )0
2 384
A = ,
( )0 3 580 A = , ( )0
4 4
A = , ( )0
5 0
A = , ( )0 6 516 A = , ( )0
7 64
A = . The last column (BS) represents the basin size of the attractors. Note that Cln 1 represents Cln 1, 2, Clb 5 represents Clb 5, 6, and Clb 1 represents Clb 1, 2.
Cln3 MBF SBF Cln1 Cdh1 Swi5 Cdc20 Clb5 Sic1 Clb1 Mcm1
No. 1 2 3 4 5 6 7 8 9 10 11 BS
○ ○ ○ ○ ○
( )0 1
A 0 0 0 0 1 0 0 0 1 0 0 1764
( )0 2
A 0 0 1 1 0 0 0 0 0 0 0 151
( )0 3
A 0 1 0 0 1 0 0 0 1 0 0 109
( )0 4
A 0 0 0 0 0 0 0 0 1 0 0 9
( )0 5
A 0 0 0 0 0 0 0 0 0 0 0 7
( )0 6
A 0 1 0 0 0 0 0 0 1 0 0 7
( )0 7
A 0 0 0 0 1 0 0 0 0 0 0 1
where θi denotes the threshold value of the node i. Also, if the self-loop acts
inactively when B ti
( )
=θ
i, the effect of the protein degradation called“degene-ration”, which is distinguished from a simple inhibition effect, is given as fol-lows;
(
)
(
( )
)
( )
(
)
0 , 1
1
1 , 1
i i ii i
i i ii
B t a
S t
B t a
θ
θ
= = − + = = = + (3)
The budding yeast cell-cycle network model (denoted by G( )0 ) by Li et al. is a
special one in a sense that all nodes of the existing self-loops are given as
1 ii
a = − . The network is shown in Figure 1. We take the values θ =i 0 for all i
in this report. Each regulatory factor is represented by each numbered node (i=1,2, ,11 ), and the activation effect (aij = +1) and suppression effect
(aij = −1) are indicated by solid and dashed arrows between the nodes. There
are self-degeneration loops on the 5 nodes, Cln3, Cln1-2, Swi5, Cbe/Cdc14,
Mcm1/SFF. Note that this rule is the same as that of Refs. [5] and [10], but it
differs from that of [15]. In this network, the total state number is W =211=2048,
and all steady states are seven point attractors by numbering as
( )0
{
( )0 ( )0 ( )0 ( )0 ( )0 ( )0 ( )0}
1 , 2 , 3 , 4 , 5 , 6 , 7
A A A A A A A =
A .
The state of the point attractor with the largest basin size among these is
( )0
1 00001000100 68
A = = , where the last number is in decimal. According to the
study of Li et al. the following facts are known. 1) The attractor with the largest
basin ( )0
1 68
A = corresponds to the stationary G1 state in the cell-cycle of the
budding yeast. 2) When creating the random network model of the same system
size N=11, there is no attractor that corresponds to ( )0
1
A with a very large
Figure 1. (Color online) Gene regulatory network of the cell-cycle of budding yeast [10]. Each circle represents a protein (cyclin or transcription factor) involved in the gene regu-lation. For the links connecting the respective proteins, the blue-solid lines represent the effect of the activation control, and the red-dashed lines represent the effect of the sup-pression control. In addition, the self-loops by green-dotted lines represent the effect (ubiquitin-proteasome system) of protein degradation in the absence of external input.
basin size. 3) One of the trajectories to reach the attractor ( )0
1
A coincides with
the trajectory of the actual biological cell-cycle. 4) The trajectory corresponding to the biological cell-cycle leading to ( )0
1
A is stable against external perturbation.
In addition, the result for the basin size of the attractors in the similar random
networks with same conditions of the structure as the G( )0 is given in
Appen-dix A. We confirmed that the occurrence probability of the point attractors with the large basin size (≥1700) is less than 20 percent. This result is consistent with those in Ref. [4].
These results may be due to all self-loops being degenerate and threshold val-ues being zero, and all the attractors are point attractors only. Generally, the threshold values are related to adding the active self-loops at each node. Note that for fission yeast cell-cycle model with similar network structure some limit cycles of period two appear as the attractor because some of the threshold value
are not zero [15] [16]. Further, notice that when an active self-loop is attached to
the node the state update rule becomes different from those of Tran et al. due to
the existence of rule (3).
3. Numerical Result
In this section, we investigate the effect of the degenerate self-loops on the
at-tractors of the original network G( )0 . Therefore, we write the network from
which the degenerate self-loop of the kth node is removed from G( )0 as G( )−k ,
and the network with self-activating loop is added to the mth node of G( )0 as
( )m G+
. Here, k selects from the nodes with the self-loop, and m selects from the
nodes without the self-loop. The attractor sets are indicated as
( )
{
( ) ( ) ( )}
1 , 2 , , k
k
k k k
n
A A A−−
− = − −
A , ( )
{
1( ), 2( ), , ( )m}
m
m m m
n
A A A++
+ = + +
A ,
and so on, respectively, where n−k and n+m means the number of attractors in
the networks G( )−k and G( )+m , respectively. We can numerically decide the all
attractors and the basin size because the network has a state space of 211=2048
states.
3.1. Case of Removing Degenerate Self-Loop
In Figure 1 of the original network, degenerate self-loops are included in five
control factors of Cln3, Cln1-2, Swi5, Cbc20/Cdc14, Mcm1/SFF, and Table 1
shows the 7 attractors. We show in Table 2 the 11 attractors of the gene
regula-tory network G( )−1 which removed the degenerate self-loop of Cln3 (the first
node).
We compare the attractors of the network G( )−1 with those of G( )0 . It is
found that ( )1 ( )0
2 1
A− =A , ( )1 ( )0
3 2
A− =A , ( )1 ( )0
5 3
A− =A , ( )1 ( )0
8 4
A− =A , ( )1 ( )0
9 5
A− =A , ( )1 ( )0
10 6
A− =A
, ( )1 ( )0
11 7
A− =A
. That is, all of the attractor sets A( )0 of the original
network G( )0 is included the attractor set of A( )−1 of the network G( )−1 .
Next, we focus on the change of the basin size. It follows that the basin size of the attractor ( )0
1
A with the largest basin size is reduced by the elimination of the
degenerate self-loop. Also, the basin size of the other attractors are also reduced
[image:5.595.210.540.437.742.2]from those of A( )0 . Figure 2 shows the basin structure of the 2048 initial states
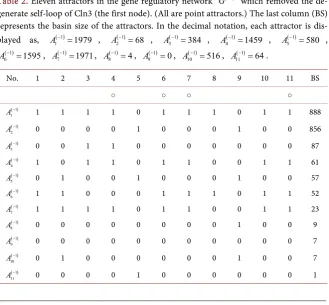
Table 2. Eleven attractors in the gene regulatory network G( )−1
which removed the de-generate self-loop of Cln3 (the first node). (All are point attractors.) The last column (BS) represents the basin size of the attractors. In the decimal notation, each attractor is dis-played as, ( )1
1 1979
A− = , ( )1 2 68
A− = , ( )1
3 384
A− = , ( )1 4 1459
A− = , ( )1
5 580
A− = , ( )1
6 1595 A− = , ( )1
7 1971 A− = , ( )1
8 4
A− = , ( )1
9 0
A− = , ( )1 10 516 A− = , ( )1
11 64 A− = .
No. 1 2 3 4 5 6 7 8 9 10 11 BS
○ ○ ○ ○
( )1 1
A−
1 1 1 1 0 1 1 1 0 1 1 888
( )1 2
A−
0 0 0 0 1 0 0 0 1 0 0 856
( )1 3
A−
0 0 1 1 0 0 0 0 0 0 0 87
( )1 4
A− 1 0 1 1 0 1 1 0 0 1 1 61
( )1 5
A−
0 1 0 0 1 0 0 0 1 0 0 57
( )1 6
A− 1 1 0 0 0 1 1 1 0 1 1 52
( )1 7
A−
1 1 1 1 0 1 1 0 0 1 1 23
( )1 8
A− 0 0 0 0 0 0 0 0 1 0 0 9
( )1 9
A− 0 0 0 0 0 0 0 0 0 0 0 7
( )1 10
A−
0 1 0 0 0 0 0 0 1 0 0 7
( )1 11
A− 0 0 0 0 1 0 0 0 0 0 0 1
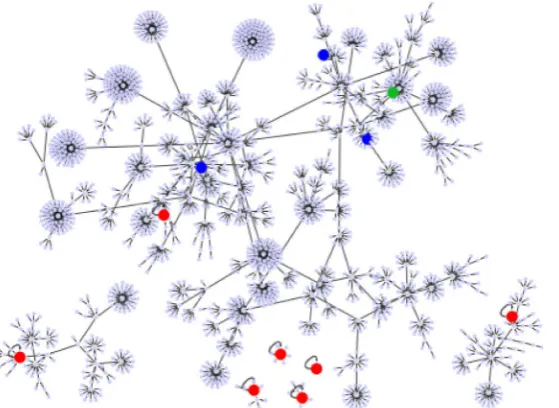
Figure 2. (Color online) The point attractors and the basin structures of the network
( )1 G−
. The 7 red circles present the common point attractors to G( )0 and G( )−1 . The blue and green circles present attractors newly added by the network becoming G( )−1
. The poin attractor with the largest basin of G( )−1
is indicated by green circle.
flowing to the fixed points given in Table 2. The red circles are the point
attrac-tors of G( )0 , and the blue circles indicate the four point attractors newly added
by the network becoming G( )−1 . Obviously, the basin size of the same attractor
of G( )−1 to those of attractor of G( )0 is smaller than those of G( )0 , and they
are caused by branching from the basin of G( )0 . Accordingly, it is also easy to
understand that all attractors (attractor sets) of the original network G( )0 are
included in the attractor set of G( )−1 . The attractor of the large BS of G( )0
cor-responds to the attractor of the relatively large BS of G( )−1 .
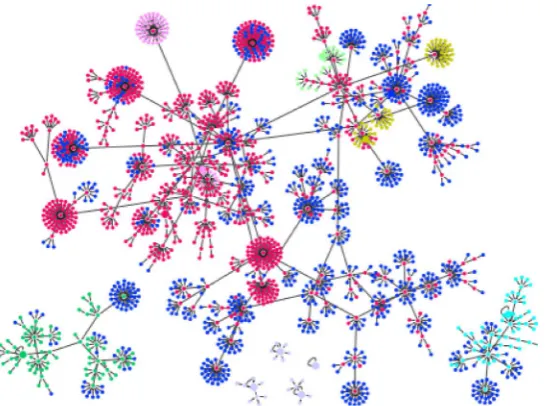
In Figure 3, we show the coloring basin structure of G( )0 depending on each
basin of the attractors of G( )−1 . (Figure 4 shows the one that removed the
col-or-coded state other than red from the attractor of the largest basin.) It is found
that the newly appearing attractors of G( )−1 are created by connecting the the
leaf states to the other leaf states in the original gene state in the transition dia-gram.
Although above results are for the specific case which the degenerate self-loop of Cln3 has been removed, but also it is found that the similar results are also true for the cases removing the other degenerate self-loops. Furthermore, if we apply this rule repeatedly in the process of removing the self-loops, we can see that in general the above relations of the attractors and the basin size also applies to the relationship before and after removing the self-loops.
3.2. Case of Adding Active Self-Loop
It is noting that in the general network which both the self-regression loops and self-activation loops exist, limit cycles can appear as the attractors, as shown in case of the fission yeast. In networks which the self-activation loop is added to
Figure 3. (Color online) The basin structure of G( )0 classificated by colors depending on the basins for each attractor of G( )−1
. The states are color-coded so that we can see basins of the 11 attractors of G( )−1
.
Figure 4. The basin structure that removed the color-coded states other than red in
Fig-ure 3 from the attractor with the largest basin of G( )0 .
the original network G( )0 , not only point attractors but also other types of
peri-odic attractors exist.
As an example, the attractors A( )+8 of the network G( )+8 which an active
self-loop added to Clb5 (the 8th node) of the G( )0 is given in Table 3. It follows
that the attractors ( )8 ( )0
1 1
A+ =A , ( )8 ( )0
5 4
A+ =A , exist also in the network G( )0 , and
the limit cycle attractors of period 2, ( )8
2 A+
, ( )8 3 A+
, ( )8 4 A+
, are newly emerging as the attractors of the network G( )+8 . Also, it follows that many attractors of G( )0
have disappeared, but the attractor with largest basin size has survived. The
ba-sin structure of the attractors in the Table 3 is shown in Figure 5. It is found
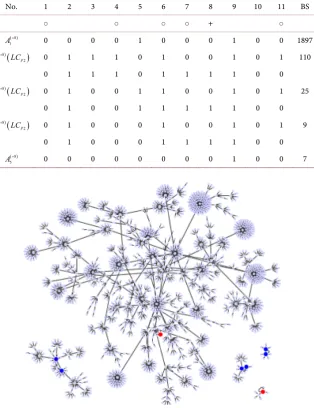
Table 3. Five attractors present in gene regulatory network G( )+8
which an active self-loop is added to Clb5 (the 8th node). The three attractors ( )8
2 A+ , ( )8
3 A+ , ( )8
4 A+ are
limit cycle. LCP2 means the limit cycle with the period 2. The last column (BS) represents the basin size of the attractors. In the decimal notation, each attractor is dis-played as, ( )8
1 59
A+ = , ( )8
(
)
2 933,956
A+ =
, ( )8
(
)
3 613,633
A+ =
, ( )8
(
)
4 549,572
A+ =
,
( )8
5 4
A+ = .
No. 1 2 3 4 5 6 7 8 9 10 11 BS
○ ○ ○ ○ + ○
( )8 1
A+
0 0 0 0 1 0 0 0 1 0 0 1897
( )8( )
2 P2
A+ LC 0 1 1 1 0 1 0 0 1 0 1 110
0 1 1 1 0 1 1 1 1 0 0
( )8( )
3 P2
A+ LC
0 1 0 0 1 1 0 0 1 0 1 25
0 1 0 0 1 1 1 1 1 0 0
( )8( )
4 P2
A+ LC 0 1 0 0 0 1 0 0 1 0 1 9
0 1 0 0 0 1 1 1 1 0 0
( )8 5
[image:8.595.221.536.169.578.2]A+ 0 0 0 0 0 0 0 0 1 0 0 7
Figure 5. The attractors and the basin structures of G( )+8
. The 2 red circles present the point attractors. The 6 blue circles represent the states that belong to the three limit cycles of period 2 two each, respectively.
that the limit cycles are constituted by combining the gene states with the rela-tively small basin size. In such a case the limit cycles with large basin size do not occur.
These features occur even if the self-activated loop is added to the other nodes without the self-loop. Furthermore, the similar phenomena can also be confirmed by changing any of the degenerate self-loop of the five nodes to the active one.
4. Summary and Discussion
In this short report, we investigated the influence of the degenerate self-loop on attractor of the gene regulatory network model of the cell-cycle of budding yeast. In the case of networks with degenerate self-loops removed from the original
network G( )0 , only the point attractor appears because all of the self-loops are
degenerate. The attractor set of the network without the degenerate self-loops
includes all attractors of the original network G( )0 . In addition, when
self-regression loops and self-activation loops coexist, limit cycles with the
pe-riod more than 2 appear other than point attractor, and many attractors of G( )0
are not included in the attractor set, but the attractor with the largest basin size was relatively stable against the deletions and additions of the self-loop. Above
result can apply to Boolean genetic network model of C. elegans early embryonic
cell-cycle network as it is, because the self-loops of network are only
self-inhibitation loops, and the attractors are only fixed points [4] [14].
Note that necessary and sufficient condition that the network attractors does
not become limit cycle but only point attractors is not known yet [5] [15] [17].
However, we expect that the result in Subsec. 3.1 holds when at least the attrac-tors are only fixed points in the random network with only degenerate self-loops.
There is a theorem in the graph theory [15]: Consider a Boolean network such
that each gene is governed with a threshold function. Then, if the associated in-cidence graph, without considering the diagonal elements, is a directed acyclic graph (DAG) and the thresholds are non negative, θ ≥i 0, then the attractors
are only fixed points. The network of the budding yeast satisfies the following sufficient condition for the fixed points. The result of the Subsec. 3.2 seems to contradict above theorem at first glance. However, considering that the update
rule (3) is different from one in Ref. [15], we can see that it is not necessarily
contradictory to the theorem.
Acknowledgements
This work was supported with funds from research funding at Musashino Uni-versity.
Conflicts of Interest
The authors declare that they have no competing interests.
References
[1] Salgado, H., et al. (2003) RegulonDB v8.0: Omics Data Sets, Evolutionary Conserva-tion, Regulatory Phrases, Cross-Validated Gold Standards and More. Nucleic Acids
Research, 41, D203-D213.
[2] Han, B. and Wang, J. (2007) Quantifying Robustness and Dissipation Cost of Yeast Cell Cycle Network: The Funneled Energy Landscape Perspectives. Biophysical Journal, 92, 3755-3763. https://doi.org/10.1529/biophysj.106.094821
[3] Ferhat, A., et al. (2009) Scalable Steady State Analysis of Boolean Biological
tory Networks. PLoS ONE, 12, e7992.
[4] Huang, X., et al. (2013) Boolean Genetic Network Model for the Control of C. ele-gans Early Embryonic Cell Cycles. BioMedical Engineering OnLine, 12, S1.
https://doi.org/10.1186/1475-925X-12-S1-S1
[5] Tran, V., et al. (2013) On the Underlying Assumptions of Threshold Boolean Net-works as a Model for Genetic Regulatory Network Behavior Frontiers in Genetics.
Bioinformatics and Computational Biology, 4, Article 263.
[6] Kauffman, S.A. (1969) Metabolic Stability and Epigenesis in Randomly Constructed Genetic Nets. Journal of Theoretical Biology, 22, 437-467.
https://doi.org/10.1016/0022-5193(69)90015-0
[7] Iguchi, K., Kinoshita, S. and Yamada, H.S. (2007) Boolean Dynamics of Kauffman Model with a Scale-Free Network. Journal of Theoretical Biology, 247, 138-151.
https://doi.org/10.1016/j.jtbi.2007.02.010
[8] Kinoshita, S., Iguchi, K. and Yamada, H.S. (2009) Intrinsic Properties of Boolean Dynamics in Complex Networks. Journal of Theoretical Biology, 256, 351-369.
https://doi.org/10.1016/j.jtbi.2008.10.014
[9] Daniels, B.C., et al. (2018) Criticality Distinguishes the Ensemble of Biological Reg-ulatory Networks. Physical Review Letters, 121, 138102.
https://doi.org/10.1103/PhysRevLett.121.138102
[10] Li, F., Long, T., Lu, Y., Ouyang, Q. and Tang, C. (2004) The Yeast Cell-Cycle Net-work Is Robustly Designed. Proceedings of the National Academy of Sciences of the
United States of America, 101, 4781-4786. https://doi.org/10.1073/pnas.0305937101
[11] Yang,L.J., et al. (2013) Robustness and Backbone Motif of a Cancer Network Regu-lated by miR-17-92 Cluster during the G1/S Transition. PLoS ONE, 8, 1-9.
https://doi.org/10.1371/journal.pone.0057009
[12] Barberis, M., Todd, R.G. and van der Zee, L. (2016) Advances and Challenges in Logical Modeling of Cell Cycle Regulation: Perspective for Multi-Scale, Integrative Yeast Cell Models. FEMS Yeast Research, 17, fow103.
[13] Luo, X., Xu, L., Han, B. and Wang, J. (2017) Funneled Potential and Flux Land-scapes Dictate the Stabilities of Both the States and the Flow: Fission Yeast Cell Cycle. PLOS Computational Biology, 13, e1005710.
https://doi.org/10.1371/journal.pcbi.1005710
[14] Kinoshita, S. and Yamada, H. (2018) The Effect of Removal of Self-Loop for At-tractor on Cell Cycle Network. In: Morales, A.J., et al., Eds., Unifying Themes in
Complex Systems IX: Proceedings of the Ninth International Conference on
Com-plex Systems, Springer Proceedings in Complexity, Springer Nature Switzerland
AG, 346-351.
[15] Goles, E., Montalva, M. and Ruz, G.A. (2013) Deconstruction and Dynamical Ro-bustness of Regulatory Networks: Application to the Yeast Cell Cycle Networks.
Bulletin of Mathematical Biology, 75, 939-966.
https://doi.org/10.1007/s11538-012-9794-1
[16] Davidich, M.I. and Bornholdt, S. (2008) Boolean Network Model Predicts Cell Cycle Sequence of Fission Yeast. PLoS ONE, 3, e1672.
https://doi.org/10.1371/journal.pone.0001672
[17] Richard, A. (2015) Fixed Point Theorems for Boolean Networks Expressed in Terms of Forbidden Subnetworks. Theoretical Computer Science, 583, 1-26.
https://doi.org/10.1016/j.tcs.2015.03.038
Appendix A: Case of the Random Network Models
We randomly construct the cell-cycle network with the same number of nodes
and links as the budding yeast, and examined the attractors and its basin size x
by re-linking in the network. The number of nodes is 11, the number of active links is 14, number of suppressing links is 15, and (suppressing) self loop num-ber is 5. For each sample, attractors with the largest basin size were examined. In the cases, all are point attractors because the networks satisfy the sufficient
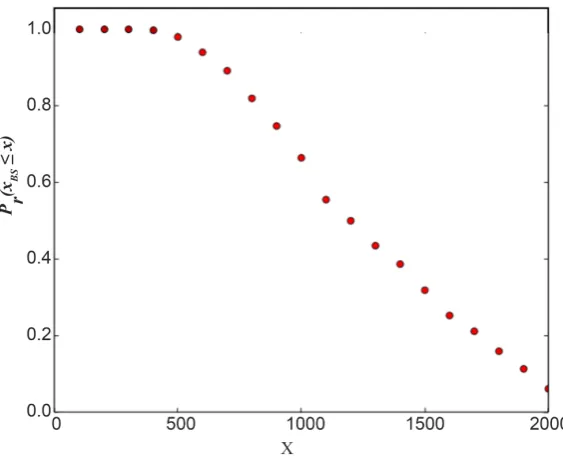
con-dition. Figure 6 shows the probability distribution Pr x
(
BS ≤x)
of the randomnetwork that the largest basin size xLBS is smaller than x. It follows that about
[image:11.595.232.514.282.511.2]20 percent even on a random network maintaining the same structure as the budding yeast have attractor with the similar or the larger basin size (≥1700) than the budding yeast. The result is similar with those for ES cell network of C. elegans in Ref. [4].
Figure 6. The probability distribution Pr x
(
BS≤x)
of the random network that thelargest basin size xBS is smaller than x. We used 1000 network samples that the number
of nodes is 11, the number of active links is 14, number of suppressing links is 15, and (suppressing) self-loop number is 5.

![Figure 1. (Color online) Gene regulatory network of the cell-cycle of budding yeast [10]](https://thumb-us.123doks.com/thumbv2/123dok_us/9242156.411675/4.595.262.481.70.291/figure-color-online-gene-regulatory-network-cycle-budding.webp)