Prolonging the Shelf Life of Ready-to-Serve Pizza
through Modified Atmosphere Packaging: Effect
on Textural and Sensory Quality
Preeti Singh1*, Ali Abas Wani1, Gyanendra Kumar Goyal2
1Chair of Food Packaging Technology, Technical University of Munich, Freising, Germany; 2Food Packaging Lab, Dairy Technol-ogy Division, National Dairy Research Institute, Karnal (Haryana), India.
Email: *[email protected]
Received April 11th, 2011; revised August 22nd, 2011; accepted August 29th, 2011.
ABSTRACT
The effects of different modified atmospheres (air: atm1;100% CO2: atm2;100% N2: atm3; 50% CO2/50% N2: atm4) on the textural and sensory characteristics of the ready-to-serve pizza at 7˚C ± 1˚C were investigated. The values of hard-ness, gumminess and chewiness were found to be increased during the storage period while cohesiveness and springi-ness exhibited a decreasing trend. Overall, the 100% CO2 product yielded the best textural and sensorial characteris-tics followed by 50% CO2/50% N2 and 100% N2 when compared to conventional packed pizza at 7˚C ± 1˚C. Carbon dioxide caused microbial inhibition as well. The shelf life of ready-to-serve pizza significantly increased upto 45 days (a
300% increase) for the samples packaged under 100% CO2 (atm2), 50% CO2/50% N2(atm4) and 100% N2 (atm3), compared to conventional air pack (15 days).
Keywords: Modified Atmosphere Packaging, Textural Profile Analysis, Pizza, Shelf Life, Storage
1. Introduction
Fresh foods are increasingly preferred to frozen foods. However, spoilage is faster in the fresh state and, there-fore, effective ways of slowing down deteriorative proc-esses are needed. Modified atmosphere packaging (MAP) is extensively used to preserve a wide array of food products 1-3. MAP is used to maintain the product’s initial quality for much longer period and to extend the product’s shelf life, and retains appeal to consumers. With regards to bakery products, there are many dis-crepancies concerning which mixture of gases is optimal
3,4, since optimal MAP conditions are not universal, but system-dependent.
The textural quality is an overall physical sensation perceived about a food during mastication. The heating performance of a food system in a microwave oven is governed by oven parameters, food parameters and type of packaging 5. There are a number of factors that ren-der it difficult to prepare cereal-based products that can be baked, heated or reheated in a microwave oven and which will be accepted to the consumer. These have re-sulted in major obstacles in the development of pre- baked microwaveable pizza products. The textural
prop-erties of pizza are very important as the difficulties of time-temperature-moisture relations associated with the microwave heating of bakery products often culminate in the development of inferior textural product characteris-tics 6.
Foods usually spoil as a result of microbial activity, which causes severe changes in chemical and sensory properties, hence study was undertaken to determine the effect of selected food grade test gases on the textural and sensory characteristics of microwave-reheated pizza through objective evaluation and the interaction of the product and modified atmospheres after storage under refrigerated conditions. Acidification and CO2
produc-tion are typically ascribed to fermentative metabolism. The growth of yeasts is inhibited under highly CO2-en-
attributes obtained from this type of textural analysis are hardness, cohesiveness, springiness, gumminess and che- winess.
2. Methodology
The study was carried out at National Dairy Research Institute, Karnal, India. The methodology for this study included both qualitative and quantitative.
2.1. Processing of Pizza
For the preparation of mozzarella cheese from mixed milk (buffalo:cow: 60:40), the method of Alam [7] was followed. The cheddar cheese and table butter were col-lected from the Experimental Dairy, NDRI, Karnal, India. Pizza bases each of 20 cm in diameter and weighing approx. 120 ± 10 g were used. The microwave oven hav-ing power output 900 W with internal dimensions of 36 × 37 × 23 cm3 and 32 lit capacity (Samsung, South Korea;
Model Bio ceramic, CE118KF) was used for baking. The vegetables used for the preparation of pizza were first thoroughly washed and then dipped in solution of potas-sium metabisulphite (2000 mg/l) for 20 min and air-dried. The vegetables were sliced in round shape (approx. 0.5 cm thick) by using ‘Philips’ make Food Processor (Es-sence HR7754). The pizza samples were prepared by adapting the procedure of Alam 7 with slight modifica-tion. Firstly the lower side of each pizza base was grilled (heated) for a minute in a microwave oven on a rotating table, and then the upper side of the pizza base was smeared with approx. 5 g table butter followed by spread- ing of tomato sauce (approx. 40 g) over the butter smeared pizza surface. Then green chillies and grated ginger were evenly spread all over the pizza base fol-lowed by grated mozzarella and cheddar cheese (80:20) (approx 120 g/pizza) concluded by vegetable toppings. The baking of pizza was done, in a preheated (220˚C) microwave oven, by placing on a stainless steel, elevated susceptor, at combination mode (convection at 200˚C + microwave at 100% power level) for 7 min. After cool-ing at room temperature, pizza samples were used for MAP studies at 7˚C ± 1˚C.
2.2. Packaging
For packaging and storage of ready-to-serve pizza, high barrier bags namely LLD/BA*/Nylon-6/BA*/LDPE (110µ)
(*poly binding agent) were used. The water vapour
transmission rate (WVTR) and oxygen transmission rate (OTR) of the packaging material used were 3.96 g/sqm/24h and 36 ml/sqm/24h, respectively. The dimen-sions of the packages used in the study were 32.5 × 35.0 cm (L × B). MAP was accomplished following the method of Day 8 by using a vacuum chamber Quick
2000 machine (Alfa-Laval, Kramer, Grebe GmbH & Co. KG Maschinenfabrik, 3560 Biedenkopf-Wallau, Ger-many), with gas injection after establishing a vacuum of 25″ Hg (ca.85 Pa). Packaging under atmosphere (air) was done by using vertical heat-sealing machine; model QS- 300 FE (Sevana Traders Ltd., Kerala, India). The pre-pared pizza samples were individually packed in pre- sterilized (under UV-light for 30 min) packages under different atmospheres (atm), i.e. air (atm1), 100% CO2
(atm2), 100% N2 (atm3) and 50% CO2/50% N2 (atm4)
and stored at 7˚C ± 1˚C. Initially the gas headspace to pizza weight ratio was approx. 1 - 2 lit of gas/kg of the product. The gases used were of industrial grade.
2.3. Analytical Methods
2.3.1. Textural Profile Analysis (TPA)
The stored ready-to-serve test samples were reheated in microwave oven for 2 min at 100% power level. To minimise variability during reheating, single samples were placed in the central position on the turntable. The reheating time was based on the amount of time neces-sary for the product to yield an adequately reheated ap-pearance, i.e. 2 min. There was a 5 min interval between
each use of the microwave oven. After removal from the oven, the samples were left to stand for 1 min at room temperature and the toppings were removed. All samples were held at room temperature for 25 min. Instrumental textural evaluation was carried out 9 using Universal Testing machine TAXT2i (Stable Micro Systems,
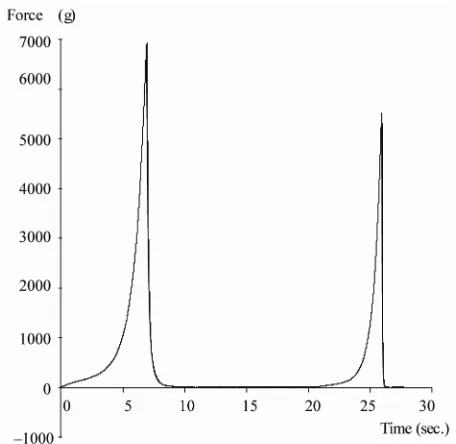
Go-dalming, Surrey, UK) Texture Analyzer fitted with a 5 kg load cell and 75 mm aluminium blunt cylindrical probe (P75 mm compression platen). Based on the previous studies 9, pizza samples were cut in the round standard size cores (diameter 1.9 cm and height 1.1 cm) by using sampler provided with the instrument, and were placed centrally beneath the probe. A crosshead speed of 5.0 mm/s with a trigger force of 20 g was used to compress the cores to 80% of their original height (for two-bite profile). Each sample was compressed twice in a recip-rocating motion to give a two-bite texture profile curve (Figure 1). The graphs obtained were analysed for
hard-ness, springihard-ness, cohesivehard-ness, gummihard-ness, and chewi-ness (Table 1) using Texture Expert Exceed Software
supplied along with the instrument.
2.3.2. Microbiological Analysis
Figure 1. Typical texture profile curve of Pizza.
Table 1. Textural calculation.
Textural variables Definition Unit
Hardness Height of the peak during the first compression g
Cohesiveness Ratio of positive area under second peak to that of the first peak (A2/A1)
Springiness
Distance that the sample covered during the time that elapsed between the first
bite & the start of second bite
mm
Gumminess Product of hardness and cohesiveness g
Chewiness Product of gumminess and springiness g × mm
to obtain a representative sample (homogenate). Subse-quently, for microbial enumeration, homogenates were serially diluted in Ringer’s solution. For total plate count (TPC), the plates were prepared following the APHA methods 11. For determining anaerobic spore formers, the method of Rao 12 was employed by using plate count agar procured from HIMEDIA, Mumbai, India. After inoculation, the surface of medium was layered with sterile agar to maintain anaerobic conditions and then incubated in anaerobic jars.
2.4. Sensory Evaluation
The reheated pizza samples were evaluated for sensory attributes by a trained panel for appearance, flavour, body & texture, and overall acceptability. A quality evaluation was carried out by monitoring inflation of
packages, examination for presence of yeasts and molds, and changes in the colour of pizza components. A panel of judges experienced in baked products evaluation was used for sensory analysis. Panellists were trained for a period of 3 months in 1-h sessions three times a week (36 h total) 13. Triangle tests were performed in order to select seven panellists who could detect off-flavours in pizza. Prior to sample evaluation, the seven selected pan-ellists participated in orientation sessions to familiarize with the flavour (off-odour, off-taste) and textural attrib-utes of pizza samples. Along with the test pizza samples, fresh baked pizza was used as the reference sample. OAA as a composite of all sensory parameters (appear-ance, flavour, body & texture) was evaluated using a 5- point hedonic scale ranging from 1 - 5, where: A score of 5 represented excellent; 4, very good; 3, good; 2, fair; and 1, poor. A mean score of 2.5 or above indicates an acceptable product. A mean score below 2.5 marks the end of refrigerated pizza shelf life 14.
2.5. Statistical Analysis
Experiments were replicated twice on different occasions with different ready-to-serve pizza samples. Different packages were sampled on predetermined time intervals. Analyses were run in triplicate for each replicate (n = 2 × 3). Experimental data were subjected to analysis of vari-ance (ANOVA). Means and standard deviations were calculated, and, when F-values were significant at the p <
0.05 level, mean differences were separated by the Least Significant Difference (LSD) procedure 15.
3. Results and Discussion
3.1. Textural Analysis
Instrumental textural evaluation of fresh baked (ready-to- serve) pizza samples show that the hardness (g) averaged 6621.87, cohesiveness averaged 0.461, springiness (mm) averaged 0.786, gumminess (g) averaged 3000.01 and chewiness (g × mm) averaged 2330.81. However, Clarke and Farrell 9 reported the following values for textural characteristics of microwave-reheated pizza hardness (g): 12571, 14461 and 19989 for samples reheated for 120 s, 150 s and 180 s respectively; cohesiveness: 0.481 for 120 s, 0.500 for 150 s and 0.554 for 180 s; springi-ness (mm): 0.916, 0.914 and 0.947 for samples reheated for 120, 150 and 180 s respectively; gumminess (g): 6079, 7230 and 11097 for samples reheated for 120, 150 and 180 s respectively; chewiness (g × mm): 5596, 6604 and 10527 for pizza samples reheated for 120, 150 and 180 s, respectively.
3.1.1. Hardness
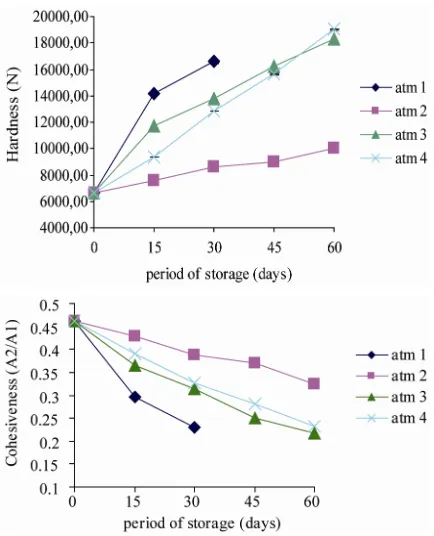
[image:3.595.56.288.362.511.2]the food between the molar teeth) of baked pizza samples packaged under 4 different atmospheres and stored at 7˚C are illustrated in Figure 2. The initial hardness value
(g) of 6621.87 increased to 16602.76 (atm1), 8606.27 (atm2), 13744.69 (atm3) and 12859.69 (atm4) after 30 days of storage revealing that the hardness was minimum for the samples packed under 100% CO2 (atm2) followed
by 50% CO2/50% N2 (atm4), 100% N2 (atm3) and air
(atm1) respectively, in ascending order. Our results per-taining to proteolysis of samples during storage also showed that the tyrosine content (data not shown) was lowest in case of baked pizza samples packed under atm2 followed by atm4, atm3 and atm1, respectively. Clarke and Farrell 9 reported the hardness values (g) for con-trol pizza samples reheated in microwave for 120 s, 150 s and 180 s as 12571, 14461 and 19989 respectively, and concluded that hardness increased with increased reheat-ing times. In general, our results (Figure 2) are in
har-mony with the observations of Alam 7 who reported that at the end of 12 weeks (at 7˚C ± 1˚C), the hardness of mozzarella cheese was minimum for the samples packed under 100% CO2 followed by 50% CO2/50% N2,
and 100% N2, respectively. Analysis of the data revealed
that the intervals of storage, different atmospheres and the interaction of intervals and atmospheres contributed
Figure 2. Textural changes in hardness and cohesiveness of chilled ready-to-serve pizza samples packaged in four dif-ferent atmospheres. Each point is the mean SE (0.1 - 0.6) of two replicate experiments.
significantly (p < 0.01) towards the changes in hardness
of baked pizza samples.
3.1.2. Cohesiveness
Cohesiveness is molecular attraction by which the parti-cles of the body are bonded throughout the mass. The changes in cohesiveness (A2/A1) of baked pizza samples packaged under different atmospheres and stored at 7˚C ± 1˚C are presented in Figure 2. The cohesiveness of
baked pizza samples showed a decreasing trend through- out the entire storage period for all the atmospheres (Figure 2). The initial cohesiveness value of 0.461
de-creased to 0.231 (atm1), 0.388 (atm2), 0.314 (atm3) and 0.327 (atm4) respectively, after 30 days of storage re-vealing that the minimum decrease in cohesiveness was observed for the samples packed under atm2 (100% CO2)
followed by atm4 (50% CO2/50% N2), atm3 (100% N2)
and atm1 (air), in ascending order. Clarke and Farrell 9
indicated that cohesiveness values for control pizza sam-ples increased as the time of reheating of microwave pizza increased: 0.481 for 120 s, 0.500 for 150 s and 0.554 for 180 s. ANOVA of the data showed that results were not significant (p < 0.05) towards the changes in
cohesiveness of baked pizza samples.
3.1.3. Springiness
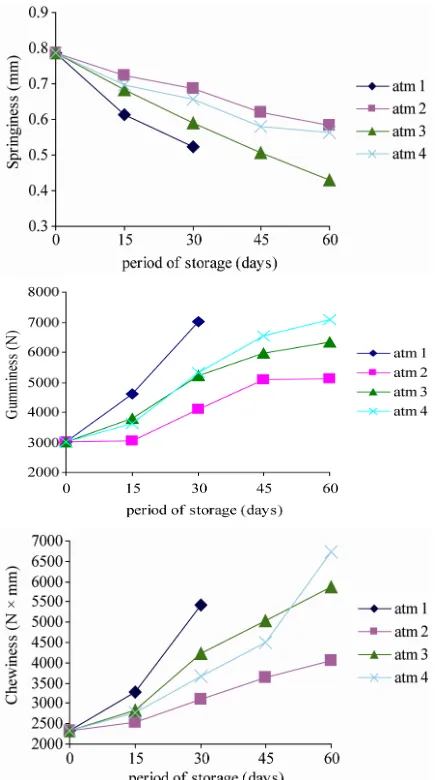
The influence of MAP on the springiness of baked pizza samples packed under 4 atmospheres at 7˚C ± 1˚C is de-picted in Figure 3. The initial mean springiness value
(mm) for fresh baked pizza samples was 0.786 which decreased to 0.524 for samples packed under atm1, 0.688 under atm2, 0.590 under atm3 and 0.656 under atm4 af-ter 30 days, while the value decreased to 0.584 for atm2, 0.429 for atm3, and 0.563 for atm4 after 60 days of stor-age indicating lowest value for air packed samples, and highest for samples packed under 100% CO2. Perhaps
higher degree of proteolysis 16 might be the reason for maximum decrease in springiness in case of samples packaged under atm1, and least proteolysis in samples packaged under atm2 (Figure 3). The results are in
a-greement with the findings of Alam 7 who reported more decrease in springiness for air packed mozzarella cheese samples as compared to samples packaged under 100% N2, 50% CO2/50% N2 and 100% CO2 respectively,
in ascending order. Ghosh 17 also observed that sprin- giness of mozzarella cheese samples decreased with the increase in storage period, regardless of packing material and storage temperature. Statistically, the influence of intervals of storage and four types of atmospheres on the springiness of baked pizza samples was found to be not significant (p < 0.05).
3.1.4. Gumminess
[image:4.595.64.281.405.673.2]Figure 3. Textural changes in springiness, Gumminess and chewiness of chilled ready-to-serve pizza samples packaged in four different atmospheres. Each point is the mean SE (0.1 - 0.6) of two replicate experiments.
aged under 4 atmospheres and stored at 7˚C ± 1˚C for various time periods are presented in Figure 3. The mean
initial value of gumminess (g) was found to be 3000.01, which continued to increase in all the pizza samples. At the end of 30 days storage, the values for gumminess increased to 7016.00 g (atm1), 4112.81 g (atm2), 5212.13 g (atm3) and 5312.74 g (atm4), respectively. From these results, it can be inferred that the gumminess increased maximum for the samples packed under air followed by 50% CO2/50% N2, 100% N2 and 100% CO2, in
descend-ing order. Clarke and Farrell 9also reported increase in gumminess values (g) when the control pizza samples were reheated for increased times, and the values re-ported by them were 6079 (120 s), 7230 (150 s) and
11097 (180 s). However, these results are at variance with the findings of Ghosh 17, Malhotra 18 and Alam
7 who reported consistent decrease in gumminess of cheese samples during storage. The analysis of variance of the data concerning gumminess of baked pizza sam-ples indicates that the intervals of storage, the 4 types of atmospheres, and their interactions all individually, were highly significant (p < 0.01).
Figure 3 represents the changes in chewiness of baked
pizza samples packed under 4 different atmospheres and stored at 7˚C ± 1˚C. The mean initial value of chewiness (g × mm) was found to be 2330.81, which increased to 3280.75 (atm1), 2526.33 (atm2), 2833.35 (atm3) and 2778.08 (atm4) respectively after 15 days of storage. This trend persisted even during further storage of 30 days. However, the minimum increase in chewiness was observed for pizza samples packed under 100% CO2
(32.89% increase), followed by 50% CO2/50% N2
(56.96% increase), 100% N2 (81.44% increase), and air
(132.85% increase) respectively. Clarke and Farrell 9
also reported increase in chewiness values when the con-trol pizza samples were reheated for longer time. How-ever, Ghosh 17, Malhotra 18 and Alam 7 reported decrease in chewiness values during storage of cheese samples. The analysis of variance of the data on chewi-ness revealed that the various time intervals of storage, the 4 types of atmospheres, and their interactions, played a very significant (p < 0.01) role in influencing the
chewiness of the product.
3.2. Microbiological Analysis
The values for TPC were in the range as reported by Kamel and Manji 19; Fasano and Gallo 20; Donnelly
21; CFS 22 for baked and refrigerated pizza samples (Figure 4). Initial values of TPC reached 6.68 cfu/g,
which is considered as the unsatisfactory limit for fresh pizza as defined by CFS 22 ca. on day 30th of storage
(air packaged samples). The atm2, atm3 and atm4 pack-aged samples did not reach this value throughout the 60 days of storage period under refrigeration. After 30 days, the atm2 contributed to significantly lower (p < 0.01)
TPC count than the atm3 and air pizza samples. This is a result of an extension of lag phase of growth, and a de-crease in the growth rate during logarithmic phase 3. The results are in agreement with the findings of Scott and Smith 23, who investigated the effect of CO2, N2
and air atmospheres on the shelf life of cottage cheese and concluded that CO2 slightly decreased the bacterial
count, but N2 did not significantly decrease the count.
The results also confirm the earlier findings of Alves et al. 24; Fedio et al. 25; Eliot et al. 26; Alam 7, who
that CO2 had bactericidal effect. The counts of anaerobic
spore formers were also low (<3 log cfu/g) and show increasing trend in all pizza samples with anaerobic con-ditions and slight decrease in air packed samples throughout the entire storage period (Figure 4). Nissen et al. 27 stored vacuum packed Salmon, Herb sauce and
Chicken, at 20˚C, and observed that the initial anaerobic count of <100 in all the three products increased respec-tively to 6.2 × 10⁶, 3.7 × 10⁶ and 1.7 × 10⁷. Farber 3
indicated that at atmospheric pressure, 100% CO2 could
delay toxin production by Clostridium sp. when
com-pared with 100% N2 levels. However, Smoot and Pierson
28 reported that CO2 had little effect on germination
and toxigenesis of spore formers such as Clostridium botulinum.
3.3. Sensory Analysis
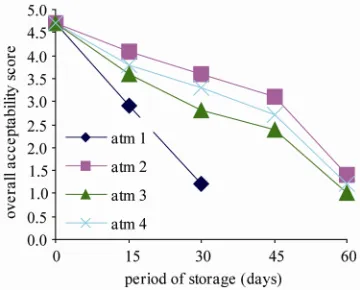
The results of the sensory evaluation (appearance, fla-vour and body & texture) of the reheated pizza samples are presented as overall acceptability (OAA) scores (Figure 5). Combined scores for appearance, flavour and
body & texture showed a similar pattern of decreasing acceptability (individual results not shown). The OAA of reheated pizza samples exhibited a decreasing trend throughout the storage period under all studied atmos- pheres. The initial OAA score 4.7 (atm1) decreased to
[image:6.595.333.513.95.240.2]Figure 4. Changes (log cfu/g) in total plate count and an-aerobic spore formers of chilled ready-to-serve pizza sam-ples. Each point is the mean SE (0.1 - 0.4).
Figure 5. Changes in OAA scores of chilled ready-to-serve pizza samples packaged in different atmospheres.
2.9 and 1.2 respectively, after 15 and 30 days, indicating that the air packed baked pizza samples were acceptable only upto 15 days. At the end of 60 days, none of the sample was acceptable under all the 3 modified atmos-pheres (atm2, atm3, atm4), but were acceptable only upto 45 days. The samples packed under 100% CO2 (atm2)
were liked most followed by 50% CO2/50% N2 and 100%
N2 respectively, in descending order (Figure 5). All
pizza samples received higher scores during the first 15 days, while after this period significant differences (p
<0.01) were observed in sensory scores between air and MA packed samples. The limit of OAA (score 2.5) was reached somewhat around day 15 (air samples) and day 45 (atm3 samples), while atm2 and atm4 samples never reached this limit within 45 days of the experiment ( Fig-ure 5). OAA (Figure 5) of air and MA-packaged pizza
samples correlated rather well with TPC data (Figure 4).
In general, the results are in agreement with the findings of Maniar et al. 29 and Alves et al. 24 who also
ob-served that 100% CO2 atmosphere best maintained the
sensorial characteristics of the product. Baked pizza samples were better preserved under atm2 and atm4 maintaining acceptable odour/taste attributes even on final day of storage
The values of hardness, gumminess and chewiness were found to be increased during the storage period while cohesiveness and springiness exhibited a decreas-ing trend. The shelf life of MAP baked (ready-to-serve) pizza was determined by subjecting the samples to dif-ferent atmospheres (air, 100% CO2, 100% N2, and 50%
CO2/50% N2) stored at various time intervals at 7˚C ±
[image:6.595.85.259.418.681.2]N2 (atm 3), compared to conventional air pack (15 days)
due to the preservative effect of CO2 on total plate count
(especially lactobacilli and yeasts) as well as other qual-ity characteristics of pizza.
REFERENCES
[1] I. J. Church and A. L. Parson, “Modified Atmosphere Packaging Technology: A Review,” Journal of the Sci-ence of Food and Agriculture, Vol. 67, No. 3, 1995, pp. 143-152. doi:10.1002/jsfa.2740670202
[2] C. A. Phillips, “Modified Atmosphere Packaging and Its Effects on the Microbiological Quality and Safety of Pro-duce,” International Journal of Food Science and Tech-nology, Vol. 31, No. 4, 1996, pp. 463-479.
doi:10.1046/j.1365-2621.1996.00369.x
[3] J. M. Farber, “Microbiological Aspects of Modified At-mosphere-Packaging Technology: A Review,” Journal of Food Protection, Vol. 54, No. 4, 1996, pp. 58-70. [4] R. Ahvenainen, E. Skyttae and R. L. Kivikataja, “The
Influence of Modified Atmosphere Packaging on the Quality of Selected Ready-to-Eat Foods,” LWT, Vol. 23, No. 1, 1990, pp. 139-147.
[5] R. F. Schiffmann, “Problems in Standardizing Microwave Oven Performance,” Microwave World, Vol. 11, No. 2, 1990, pp. 20-24.
[6] R. F. Schiffmann, “Understanding Microwave Reactions and Interactions,” Food Product Design, Vol. 4, 1993, pp. 72-88.
[7] T. Alam, “Studies on the Modified Atmosphere Packag-ing of Mozzarella Cheese,” Ph.D. Dissertation, NDRI, Karnal, India, 2004.
[8] B. P. F. Day, “Guidelines for the Good Manufacturing and Handling of Modified Atmosphere Packed Food Products,” The Campden Food and Drink Research As-sociation, Chipping Campden, U.K. Technical Manual No. 34, 1992.
[9] C. I. Clarke and G. M. Farrell, “The Effects of Recipe Formulation on the Textural Characteristics of Micro-wave-Reheated Pizza Bases,” Journal of the Science of Food and Agriculture, Vol. 80, No. 8, 2000, pp. 1237- 1244.
doi:10.1002/1097-0010(200006)80:8<1237::AID-JSFA63 0>3.0.CO;2-8
[10] T. P. Labuza and M. K. Schmidl, “Accelerated Shelf Life Testing of Foods,” Food Technology, Vol. 9, No. 2, 1985, pp. 57-62, 64, 134.
[11] APHA, “Standard Methods for the Examination of Dairy Products,” 15th Edition, American Public Health Asso-ciation, Washington, DC, 1985.
[12] K. V. S. S. Rao, “A Process for Manufacture of Paneer Like Product,” Ph.D. Dissertation, NDRI, Karnal, India, 1991.
[13] R. J. Winger and C. G. Pope, “Selection and Training of Panellists for Sensory Evaluation of Meat Flavors,” Jour-nal of Technology, Vol. 16, No. 4, 1976, pp. 661-669.
[14] M. L. Cabo, L. Pastoriza, M. Bernardez and J. J. R. Herrera, “Effectiveness of CO2 and Nisaplin on Increas-ing Shelf Life of Fresh Pizza,” Food Microbiology, Vol. 18, No. 3, 2001, pp. 489-498.
doi:10.1006/fmic.2001.0424
[15] R. G. D. Steel and J. H. Torrie, “Principles and Proce-dures of Statistics―A Biometric Approach,” Mc Graw- Hill, New York, 1980, p. 22.
[16] R. C. Lawrence, L. K. Creamer and J. Gilles, “Texture Development during Cheese Ripening,” Journal of Dairy Science, Vol. 70, No. 3, 1987, pp. 1748-1760.
doi:10.3168/jds.S0022-0302(87)80207-2
[17] B. C. Ghosh, “Production, Packaging and Preservation of Mozzarella Cheese from Buffalo Milk Using Microbial rennet,” Ph.D. Dissertation, Kurukshetra University, Ku-rukshetra, India, 1987.
[18] G. H. Malhotra, “Accelerated Ripening of Gouda Cheese Manufactured from Buffalo Milk Using Cheese Manu-factured from Buffalo Milk Using Microbial Rennet,” Ph.D. Dissertation, NDRI, Karnal, India, 1991.
[19] B. Kamel and B. Manji, “Effect of Frozen Storage on Different Pizza Formulations,” Cereal Foods World, Vol. 31, No. 3, 1986, pp. 751-755.
[20] L. Fasano and C. Gallo, “Pizza-Bases with Tomato Pack-aged with Modified Atmosphere: Environment Monitor-ing and Shelf Life Studies,” Industrie Alimentari, Vol. 11, No. 3, 2001, pp. 1039-1044.
[21] C. W. Donnelly, “Detection and Isolation of Listeria monocytogenes from Food Samples: Implications of sub-lethal Injury,” Journal of AOAC International, Vol. 85, No. 3, 2002, pp. 495-500.
[22] Centre for Food Safety, “Microbiological Guidelines for Ready-to-Eat Foods,” Risk Assessment Section, Centre for Food Safety, Food and Environmental Hygiene De-partment, Hongkong, 2007, pp. 1-15.
[23] C. R. Scott and H. O. Smith, “Cottage Cheese Shelf Life and Special Gas Atmospheres,” Journal of Food Science, Vol. 36, No. 3, 1971, pp. 78-80.
doi:10.1111/j.1365-2621.1971.tb02038.x
[24] M. V. R. Alves, C. I. G. D. L. Sarantopoulos, A. G. F. van Dender and J. D. A. F. Faria, “Stability of Sliced Mozzarella Cheese in Modified Atmosphere Packaging,” Journal of Food Protection, Vol. 59, No. 3, 1996, pp. 838-844.
[25] W. M. Fedio, A. Macleod and L. Ozimek, “The Effect of Modified Atmosphere Packaging on the Growth of Mi-croorganisms in Cottage Cheese,” Milchwissenschaft, Vol. 49, No. 2, 1994, pp. 622-629.
[26] S. C. Eliot, J. C. Vuillemard and J. P. Emond, “Stability of Shredded Mozzarella Cheese under Modified Atmos-phere Packaging,” Journal of Food Science, Vol. 63, No. 2, 1998, pp. 1075-1080.
doi:10.1046/j.1472-765X.2002.01218.x
[28] L. A. Smoot and M. D. Pierson, “Inhibition and Control of Bacterial Spore Germination,” Journal of Food Pro-tection, Vol. 45, No. 3, 1982, pp. 84-92.
[29] B. Maniar, A. J. E. Marcy, J. R. Bishop and S. E. Duncan, “Modified Atmosphere Packaging to Maintain Direct Set Cottage Cheese Quality,” Journal of Food Science, Vol. 59, No. 3, 1994, pp. 1305-1308, 1327.