Orphan versus non-orphan IPOs: the
difference analyst coverage makes
Boissin, Romain
ESG Management School
September 2012
Online at
https://mpra.ub.uni-muenchen.de/41542/
Orphan versus non-orphan IPOs: The difference analyst coverage makes
Romain Boissin
Numerous articles in academic journals or in the press have highlighted the
importance of financial analysts’ coverage of firms that are going public. Newly public
firms rely on their underwriters throughout the IPO process, especially during the
marketing phase. The underwriters’ services include determining the offering price and
the distribution of shares, but what is of particular importance for the issuer is receiving
coverage through their financial analysts. During the IPO, investors are limited to
information contained in the prospectus. As a result, the flow of information is restricted
and sparse. Financial analysts can reduce these asymmetries. Indeed, coverage can
transcend borders and financial markets and put the firm in the spotlight. Coverage is
seen to add value by the firm because it can generate publicity, attract new consumers
(Cliff and Denis, 2004), boost the share price (Chen and Ritter, 2000; Aggarwal et al.,
2002), attract new investors, and reduce the cost of capital. However, coverage is not
uniformly distributed and is mainly concentrated on large firms (as measured by their
market capitalization). In the mid-2000s, 50 per cent of IPO firms were covered by a
financial analyst and 35 per cent had no coverage1. Newly public firms often suffer
from lack of analyst coverage even though it is widely accepted that, because coverage
adds value, the allocation of resources to attract such coverage is a worthy investment.
This paper addresses the resources at the disposal of IPO firms to attract
financial analysts. We examine the long-run performance of orphan and non-orphan
IPOs to explain what value has to be attributed to analyst coverage. We are interested in
firms (those without analyst coverage within 5 years of their issuance) and non-orphan
IPO firms (those with analyst coverage within 5 years of their issuance). This paper
addresses the question of the importance of analyst coverage for the long-run returns of
IPO firms over the period from 1991 to 2010.
Over the years, academic research has noted the importance of analyst coverage.
Krigman et al. (2001) suggested that the most important motivation for firms to switch
underwriters between their IPO and a Seasoned Equity Offering (SEO) is to obtain
additional and influential analyst coverage. Loughran and Ritter (2004) and Cliff and
Denis (2004) argued that the underpricing of newly public firms is positively related to
analyst coverage. According to Loughran and Ritter (2004), the average underpricing of
IPOs was 7 per cent in the 1980s, which doubled to 15 per cent from 1990 to 1998,
before jumping to 65 per cent during the internet bubble. Part of this increase can be
attributed to analyst coverage, which has grown more important over the years. Bradley
et al. (2003) showed that the number of managing underwriters in a syndicate is a good
indicator of the coverage enjoyed by newly listed firms at the time of their IPOs.
Corwin and Schultz (2005) examined the syndicates of 1638 IPOs and found evidence
that each additional co-manager results in 0.8 additional analyst recommendations
within 3 months of the IPO. Bradley et al. (2008b), however, did not find incremental
coverage to be related to improved long-run performance. Bradley et al. (2004) focused
on the 2-year post-issue performance (at the end of the IPO’s quiet period) of IPOs that
receive analyst coverage compared to those that do not. The authors found that orphans
significantly underperformed compared to non-orphans during the period from 1996 to
Unlike Bradley et al. (2004), we analyse long-run performance from one to five
years after the IPO. We measure the influence of analyst coverage on the long-run
performance of IPO firms over a five-year horizon. We are then able to observe how
long-run performance adjusts to analyst coverage. Our observation period is large and
encompasses the period from 1991 to 2010. Our definition of an orphan IPO firm differs
from that of Bradley et al. (2004) because the authors consider an IPO firm to be an
orphan if “there is an absence of a research report/analyst recommendation at the end of
the quiet period by at least one underwriter in the managing syndicate”.
In US IPOs, during the one- to five-year horizon, we find a significant long-run
abnormal performance by orphans (IPOs without analyst coverage) compared to
non-orphans (IPOs with analyst coverage). For instance, by the fifth year after the IPO,
buyandhold abnormal returns for orphans were a significant 52.95 per cent compared to
-8.07 per cent for non-orphans, a difference that is statistically significant at the 1 per
cent level. Further analysis reveals that this outperformance by non-orphans stems from
high analyst coverage. Our results are robust after accounting for venture capital
backing, underwriting syndicates, underpricing, institutional investor ownership, or
operating performance variables.
The paper is organised as follows. We first discuss the existing literature. In the
second section, we describe the methodology, data and sample statistics. The third
section presents the findings, and the last section concludes the paper.
1. Literature review
Khorana et al. (2009) examine the consequences of the loss of coverage for a
coverage are significantly more likely to get delisted. This study sheds light on the
importance of analyst coverage for firms. To avoid such a situation, the firm may
acquire the means to attract financial analysts during its IPO process. Previous studies
have found that the underwriting syndicate and the presence of venture capitalists or
institutional investors in the IPO, as well as underpricing, allow the firm to increase its
probability of analyst coverage.
Krigman et al. (2001) reveal that changes in underwriters (between an IPO and
an SEO) are made because the firm wants more reputable underwriters that will provide
more coverage. The authors find that firms are more likely to make changes when
analyst coverage is not to their liking. In addition, firms do not hesitate to allocate
resources to improving their coverage. According to Ellis et al. (2005), almost 50 per
cent of firms making an SEO change their lead underwriters. This change takes place
not because of the reputation of the underwriter but for the coverage of analysts whose
buy recommendation are often more favourable than those of their predecessors. Corwin
and Schultz (2005) examine the underwriting syndicates of 1638 IPOs between 1997
and 2002 in the United States. They emphasise the importance of co-managers, stating
that the addition of a co-manager to the syndicate increases analyst coverage within the
3 months after the IPO. Loughran and Ritter (2004) find that co-managers are included
in syndicates exclusively to provide additional coverage.
The presence of venture capitalists in the IPO may encourage analysts to follow
the firm. Several studies note a positive relationship between the presence of venture
capitalists in the IPO and analyst coverage. Jain and Kini (2000) find that venture
capitalists influence institutional investors, investment bankers and their analysts to
especially with underwriters. Gompers and Lerner (1997) estimate that approximately
25 per cent of venture capitalists have an affiliation with underwriters. A venture
capitalist involved in an IPO can advise its underwriter and vice versa1. These types of
interactions also arise between venture capitalists and financial analysts. Therefore,
venture capitalists can attract underwriters and thus facilitate analyst coverage.
According to Chemmanur and Loutskina (2006), the presence of venture capitalists in
an IPO leads 0.22 more analysts to follow the firm.
Rajan and Servaes (1997) and Aggarwal et al. (2002) argue that underpricing
attracts an analyst following. Cliff and Denis (2004) find that underpricing is positively
related to analyst coverage. The authors empirically examine the assumption that firms
attract analyst coverage through underpricing. They study 1050 firms conducting an
IPO and an SEO between 1993 and 2000 and find a strong correlation between
underpricing and the frequency and quality of post-IPO analyst coverage. A total of 94
per cent of highly underpriced firms receive initial analyst coverage compared to 84 per
cent of minimally underpriced firms. The authors conclude that underpricing
compensates, in part, for expected analyst coverage. James and Karceski (2006) note
that IPO firms that have not benefited from analyst coverage are significantly less
underpriced (average of 27 per cent) compared with those covered by financial analysts
(average of 72 per cent) over the period from 1999-2000. Das et al. (2006) show that
IPOs with low (high) analyst coverage exhibit underpricing close to 13 per cent (47 per
cent) over the period from 1986 to 2000. In contrast, Bradley et al (2008a) do not
establish any link between underpricing and analyst coverage following 683 IPOs from
Ownership structure also affects analyst coverage. Bhushan (1989) and O'Brien
and Bhushan (1990) find that the likelihood of analyst coverage is associated with the
interests of institutional investors in the firm. The authors conclude that there is a
positive relationship between institutional investor ownership and analyst coverage.
Lang et al. (2004) and Boubaker and Labegorre (2008) indicate that analysts are
reluctant to cover a firm managed by controlling family members. This is explained, in
part, by the reliance of these firms on private communication channels rather than
public disclosure, producing a poor informational environment.
2. Methodology, data and sample statistics
2.1 - Methodology:
The results of long-run performance studies are sensitive to methodological
choices. We therefore present our results using two frequently used and recommended
methodologies (Brav and Gompers, 1997; Barber and Lyon, 1997).
First, we use the calendar-time approach of Fama and French (1996). Their
three-factor model assumes that the expected return on a portfolio in excess of the
risk-free rate [(ERi) – Rf ] is explained by the sensitivity of its return to three factors: (i) the
excess return on a broad market portfolio (RM – Rf); (ii) the difference between the
return on a portfolio of small stocks and the return on a portfolio of big stocks (SMB,
small minus big); and (iii) the difference between the return on a portfolio of
high-book-to-market stocks and the return on a portfolio of low-book-high-book-to-market stocks (HML, high
minus low). Specifically, the expected excess return on portfolio i is,
where E(Ri) is the monthly return on the IPO portfolio, Rf is the one-month Treasury bill
rate, E(RM) is the monthly return on an equally weighted market portfolio of NYSE,
AMEX, and NASDAQ stocks, E(SMB) is the difference between the returns on
portfolios of small and big stocks (below or above the median), and E(HML) is the
difference between the returns on portfolios of high and low book-to-market stocks
(above and below the 0.7 and 0.3 fractiles of book-to-market ratios).
Second, we use an event-time approach, as in the study of Brav and Gompers
(1997). Fama and French (1992, 1993) have shown that the size and book-to-market
portfolios are important determinants of the cross section of stock returns. We compare
the performance of IPOs with that of size and book-to-market portfolios. Starting in
January 1991, we use all NYSE, AMEX, and NASDAQ stocks to create size quartile
breakpoints with an equal number of firms in each size quartile. Size is measured by the
number of shares outstanding multiplied by the stock price at the end of the preceding
month. The monthly book-to-market data for each firm are extracted from the
Datastream database. Within each size quartile, we create four book-to-market
portfolios with an equal number of firms in each book-to-market quartile, resulting in
16 size and book-to-market portfolios. Equally weighted returns are calculated for each
portfolio. To avoid comparing IPO firms with themselves, we eliminate IPO firms from
the various portfolios for five years after their equity issues. Each issue is matched with
its corresponding benchmark portfolio.
The Long-run performance is calculated using the BHAR methodology. The
difference between a return on a buy-and-hold investment in the sample firm and the
return on a buy-and-hold investment in a portfolio with an appropriate expected return
1 1
where Rit is defined as the month t simple return of a sample firm and E(Rit) is the
month t expected return of the sample firm (that is, the return of firm i’s benchmark
over the same period).
Long-run buy-and-hold abnormal returns are positively skewed and this positive
skewness leads to negatively biased t-statistics. Lyon et al. (1999) recommend the use
of a bootstrapped skewness-adjusted t-statistic to eliminate this skewness bias.
2.2 Data and sample statistics
The data come from different sources. We first identify firms that went public
from 1991 to 2010 in the Thomson Financial Securities Data Company (SDC) Common
Stock Initial Public Offerings database. Consistent with prior studies, we eliminate IPOs
that are classified as ADRs, REITs, and closed-end funds, along with offerings that
have a file range midpoint of less than €8 and financial services IPO firms (SIC code
6000-6999). Our sample contains 1265 IPOs. Analyst data are collected from the First
Call database.
Long-run performance is calculated using the Datastream monthly stock price database.
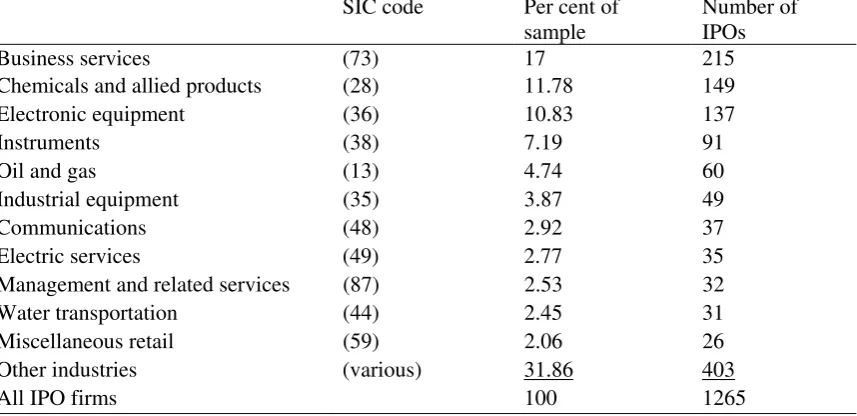
Table 1 presents descriptive statistics for our sample. Panel A shows the
distribution of the IPO sample over the three sub-periods. Panel B provides the market
capitalization of the IPOs in our sample at the end of the first month following the
offering. Our sample offerings are substantially large in terms of market capitalization.
We find that 63 per cent of our sample’s IPOs raise $200 million or more and 25 per
Panel C documents that the industry composition of our sample is well-distributed, with
the greatest concentration, 17 per cent, being in the business services industry.
Insert Table 1
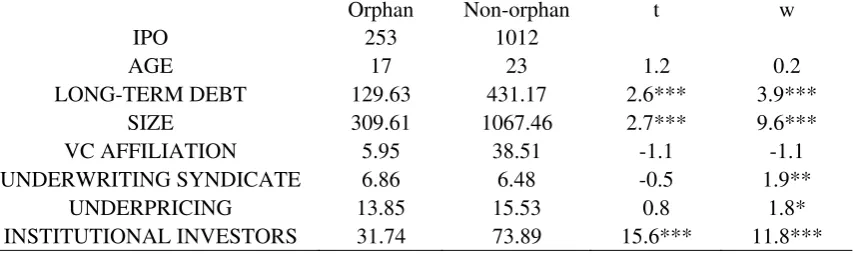
Table 2 shows descriptive statistics for orphan and non-orphan IPOs. There are
253 IPOs classified as orphans and 1012 classified as non-orphans. The long-term debt
of non-orphans is higher than that of orphan IPOs (significant at the 1 per cent level
using w and t tests). The average orphan raises $309.61 million in its IPO, compared to
$1067.46 million for the average non-orphan. This difference is statistically significant
at the 1 per cent level. Like prior research, analyst coverage increases according to firm
size. We find no significant differences in venture capital backing between orphan and
non-orphan IPOs over the entire period. Orphans are associated with more underwriting
syndicates, with a mean of 6.86 managing underwriters, compared to 6.48 for
non-orphans (the difference is statistically significant using a w test). There is a weak
relationship between analyst coverage and underpricing. For instance, orphans have
initial returns of 13.85 per cent compared to 15.53 per cent for non-orphans.
Non-orphans are more underpriced than Non-orphans and the difference is statistically significant
at the 10% level using a w test. Non-orphans are associated with more institutional
investor ownership than orphans. For instance, a mean of 73.89 per cent of the shares of
IPOs with analyst coverage are held by institutional investors, compared to 31.74 per
cent for orphan IPO firms. The difference is statistically significant at the 1 per cent
level and is confirmed by both t and w tests.
3. Results
Table 3 shows that IPO firms in the US have statistically significant long-run
returns over the entire period. The mean returns of IPOs range from 4.22 per cent over
the first year after their offerings to -16.40 per cent over the five-year horizon. Over the
period from 1991 to 1998, similar to Ritter and Welch (2002), we find that IPOs have,
on average, no abnormal returns regardless of the considered horizon. We also calculate
long-run performance using the Fama-French three-factor model. The parameter of
interest in this regression is the intercept, alpha. A negative intercept indicates that after
controlling for market, size, and book- to-market factors in returns, a sample firm
performed worse than expected. Intercepts (alpha) are positive regardless of the
considered period. The Fama-French model shows that investing in IPO portfolios leads
to a statistically significant (at 1 per cent level) 0.78 per cent return per month over the
entire period.
Insert Table 3
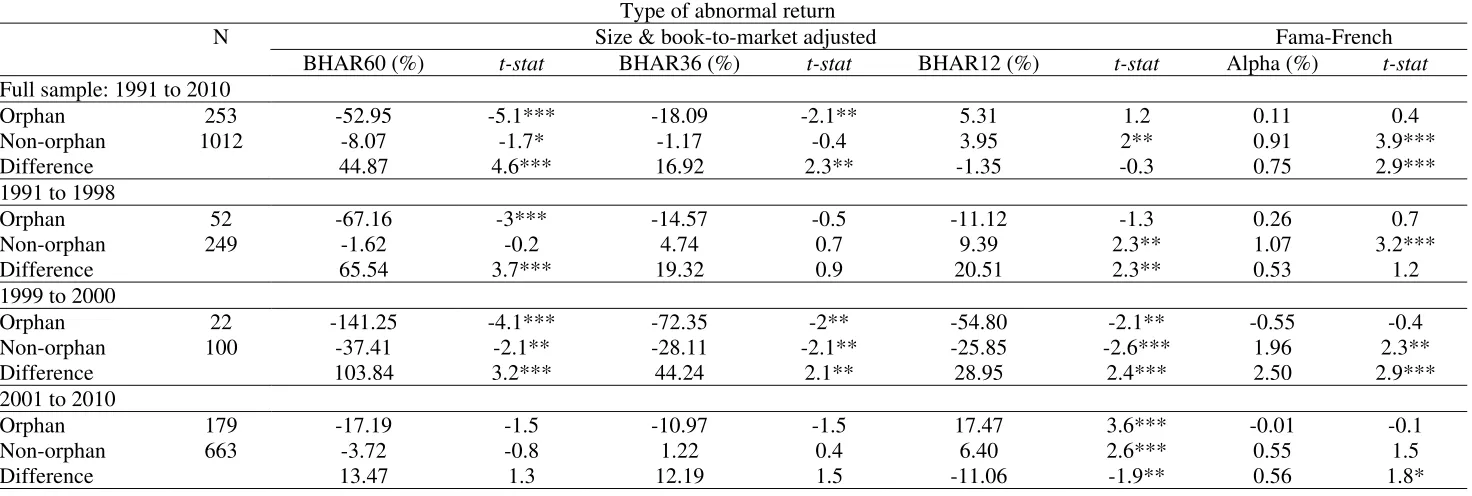
We now distinguish IPO firms according to the level of analyst coverage. The
findings are reported in table 4. We find that market participants make a relevant
distinction between orphan and non-oprhan IPO firms over the entire period
(1991-2010). For instance, the three-year return of non-orphans is -1.17 per cent, compared to
-18.09 per cent for orphan IPOs, and the difference is statistically significant at the 5 per
cent level. These findings are confirmed over the five-year returns. The Fama-French
model shows that investing an equal amount in non-orphan IPO portfolios provides a
0.91 per cent return per month, which is statistically significant (at the 1% level),
that the differences between orphan and non-orphan IPOs appear in the first year
following the offering. It is worth noting that the one-year returns show the analysts’
ability to predict the long-run performance before the disclosure of financial statements.
At the time of the IPO, investors are limited to the material information contained in the
prospectus, and informational asymmetries are particularly high. In the first year after
the offering, the non-orphans exhibit positive abnormal performance, while the orphans
exhibit no abnormal performance. The internet bubble period (1999-2000) demonstrates
similar findings. The 2000s reveal the opposite result, meaning that orphan IPOs exhibit
higher returns than non-orphan IPOs in the first year after their issues. The difference is
statistically significant at the 5 per cent level (not confirmed by the calendar-time
approach). This could be attributable to recent scandals involving financial analysts; as
a consequence, analyst coverage may have become worth less to investors.
Insert Table 4
Venture capital affiliation, underwriting syndication, institutional investor
ownership and underpricing have been shown to influence the long-run performance of
IPO firms. Therefore, if there is a relationship between analyst coverage and long-run
performance, it may be a manifestation of these variables. We investigate these potential
relationships by focusing on each of them individually.
The results of venture capital (VC) affiliation are presented in table 5. We
partition our sample into VC-backed IPOs and non-VC-backed IPOs. We find
significant differences in the long-run performances of orphan and non-orphan
VC-backed IPOs. Whatever the horizon and period considered, the long-run returns of
Fama-French model presents similar findings but the difference in returns is not
statistically significant.
These results hold for non-VC-backed IPOs except in the 2000s, when investors paid no
attention to analyst coverage.
Insert Table 5
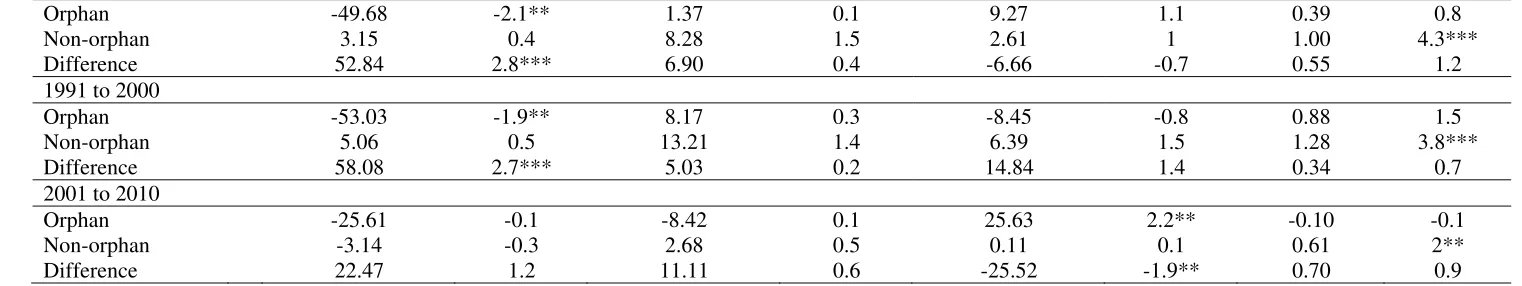
From table 6, we can see that non-orphan IPOs with large underwriting
syndicates (IPOs in which the number of managing underwriters is above the median
are classified as ‘large’; otherwise, they are classified as ‘small’) outperform orphan
IPOs. The oneyear returns of nonorphan IPOs with large underwriting syndicates are
-1.05 per cent compared to -32.05 per cent for orphan IPOs with large underwriting
syndicates over the period from 1991 to 2010. The 31.60 per cent difference is
significant at the 1 per cent level. These results hold for three and five-year returns. An
exception occurs during the past decade, when there is no difference between orphan
and non-orphan IPOs with large underwriting syndicates. Panel B indicates that the
difference between orphan and non-orphan IPOs with small underwriting syndicates is
only statistically significant over a five-year horizon. However, we find that, over the
period from 2001 to 2010, orphan IPOs with small underwriting syndicates exhibit
better performances than their non-orphan counterparts during the first year after the
issue. The difference of -25.52 per cent is statistically significant at the 5 per cent level
(not confirmed by the calendar-time approach).
Insert Table 6
Table 7 shows that, over the entire period, highly underpriced non-orphan IPOs
are classified as ‘low’) outperform their orphan counterparts over the one- and five-year
horizons (the differences are statistically significant at conventional levels). The alpha
of the Fama-French model identifies significant differences between orphan and
non-orphan highly underpriced IPOs, with an average return of -0.08 per cent per month for
orphans compared to an average of 0.82 per cent per month for non-orphans. The
difference of 0.86 per cent per month is statistically significant at the 1 per cent level.
We find no differences between the long-run returns of orphan and non-orphan
minimally underpriced IPOs over the entire period. Hence, analyst coverage has
investment value only for highly underpriced IPOs.
Insert Table 7
Once we account for ownership structure, table 8 shows that non-orphan IPOs
with a high level of institutional investor ownership (IPOs with institutional investor
ownership above the median level are classified as ‘high’; otherwise, they are classified
as ‘low’) outperform their orphan counterparts. The event-time approach indicates that
the difference is statistically significant regardless of the considered horizon. However,
in the 2000s, this difference is only statistically significant over a five-year horizon.
Globally, these results hold for IPOs with a low level of institutional investor
ownership.
Insert Table 8
In summary, these findings suggest that investors and market participants pay
attention to analyst coverage when IPOs have large underwriting syndicates and are
highly underpriced. The differences between orphans and non-orphans persist in
(that is, those with a high versus low level of institutional investors). The 2000s reveals
that the differences between orphan and non-orphan IPO firms are diminishing.
Next, we investigate the characteristics of analyst coverage by determining the
number of financial analysts providing coverage. Numerous studies have documented a
positive relationship between the coverage number and the subsequent short- and
long-run performances (Bradley et al., 2003; Das et al., 2006). These findings are reported in
table 9. We find that IPOs with a high level of coverage (those with a coverage number
above the median level are classified as ‘high’; otherwise, they are classified as ‘low’)
perform better than IPOs with low coverage from three to five years after the IPO date.
For instance, from 1991 to 2010, the five-year returns of IPOs with high coverage are
10.30 per cent compared to a -29.88 per cent for IPOs with low coverage. This
difference is statistically significant at the 1 per cent level. This result holds for the
1990s and the 2000s.
Insert Table 9
To verify that the univariate results presented in tables 4 through 9 are robust in
a multivariate setting, we report our regression model in able 10. The dependent
variable in the regression is the long-run performance of IPOs, as determined by the
BHARs over one, three, and five years. As Bradley et al. (2008b) note that a common
oversight in examining analyst coverage is the endogenous problem between
performance and analyst coverage. That is, the quality of an IPO is slowly revealed to
the public through financial statements and other public sources after it has been issued.
The analysts may just be jumping on the bandwagon when information is provided by
other sources, such as financial statements. Our research model overcomes this obstacle.
Table 10 reports our regression results (corrected for heteroscedasticity and
multicollinearity). We use a 2SLS regression model to account for the endogenous
problem (i.e., that the more valuable firms would likely attract more analysts). The
coverage variable is endogenous, and we use instrument variables such as trading
volume and intangibles that are known to influence analyst coverage but not long-run
performance (Bhushan, 1989; O’Brien and Bhushan, 1990; Barth et al., 2001). The
results of our model are statistically significant and it helps to explain the long-run
performance of US IPOs.
We find non-orphan IPOs to be positively and significantly related to long-run
performance over the five-year horizon, which is broadly consistent with the univariate
analysis results given in table 3. This finding reveals that market participants do not
fully incorporate the perceived value of analyst coverage. Both the syndicate and
operating performance variables explain a significant component of the long-run IPO
performance regardless of the considered horizon. The other variables (such as
underpricing, VC backing and institutional investors) fail to explain the long-run
performance of US IPOs over the period from 1991 to 2010.
Insert Table 10
4. Conclusion
We examine the long-run performance of US IPOs carried out between 1991 and
2010 and find that the IPOs in our sample performed negatively relative to the
sub-periods. We compare the long-run performance of firms that do not receive analyst
coverage (orphans) to those that do (non-orphans). This abnormal long-run performance
is considerably more severe for orphan IPOs than for non-orphan IPOs given a three- to
five-year horizon. The evidence suggests that analyst coverage is indeed important to
the issuing firm but the market does not fully incorporate the perceived value of this
coverage. Once we control for other characteristics that have been shown to influence
the long-run performance of IPOs, we find that investors and market participants pay
attention to analyst coverage when IPOs have large underwriting syndicates and are
highly underpriced. The difference between orphans and non-orphans persists in
VC-backed and non-VC-VC-backed IPOs, and whatever the ownership structures of the IPOs.
Notably, however, the 2000s reveals that the difference between orphan and non-orphan
IPO firms is diminishing. This trend may be attributable to scandals affecting analyst
coverage, as both regulators and the financial press have identified analyst research that
had been tainted by conflicts of interest.
Finally, multivariate regression analysis establishes that analyst coverage is
significantly related to the long-run performance of IPOs, contrary to the study of
Bradley et al. (2008b).
Notes
1. “Pour un nouvel essor de l’analyse financière indépendante sur le marché
français”, AMF, 2005.
2. Hoberg and Seyhun (2009) examine the collaboration between underwriters and
References:
Aggarwal, R., L. Krigman, and K. Womack (2002), “Strategic IPO underpricing, information momentum, and lockup expiration selling”, Journal of financial economics, 66 (1), 106-137.
Barth, M., R. Kasznik and M. McNichols (2001), “Analyst coverage and intangible assets” Journal of accounting research,39, 1-34.
Bhushan, R.. (1989), “Firm characteristics and analyst following”, Journal of Accounting and Economics, 11 (2-3), 255-274.
Barber, B., and J. Lyon.( 1997). Detecting long-run abnormal stock returns: the empirical power and specification of test statistics. Journal of financial economics, 43
(3), 341–372.
Boubaker, S. and F. Labégorre (2008), “Ownership structure, corporate governance and analyst following: a study of French listed firms”, Journal of banking and finance, 32
(6), 961-976.
Bradley, D., B. Jordan, and J. Ritter (2008a), “Analyst behavior following IPOs: the ‘bubble period’ evidence”, Review of financial studies, 21 (1), 101-133.
Bradley, D., K.Chan, J. Kim, and A. Singh (2008b), “Are there long-run implications of analysts’ coverage for IPOs?”, Journal of banking and finance, 32 (6), 1120-1132.
Bradley, D., K.Chan, J. Kim, and A. Singh (2004), “Investment bankers, their analysts and orphaned IPOs”, working paper.
Bradley, D., B. Jordan, and J. Ritter (2003), “The quiet period goes out with a bang”,
Journal of finance, 58 (1), 1-36.
Brav, A. and P. Gompers (1997), “Myth or reality? The long-run performance of initial public offerings: evidence from venture and nonventure capital-backed companies”,
Journal of finance, 52 (5), 1791-1821.
Chemmanur, T. and E. Loutskina (2006), “The role of venture capital backing in initial public offerings: certification, screening, or market power?, working paper, Boston college.
Chen, H., and J. Ritter (2000), “The seven percent solution”, Journal of finance, 55 (3), 1105-1131.
Corwin, S., and P. Schultz (2005), “The role of IPO underwriting syndicates: pricing, information production, and underwriter competition”, Journal of finance, 60 (1), 443-486.
Das, S., R. Guo, and H. Zhang (2006), “Analysts’ selective coverage and subsequent performance of newly public firms”, Journal of finance, 61 (3), 1159-1185.
Ellis, K., R. Michaely and M. O’Hara (2005), “Competition in investment banking: proactive, reactive, or retaliatory?, working paper, University of California.
Fama, E. and K. French (1992), “The cross-section of expected stock returns”, Journal of finance, 47 (2), 427-65.
Fama, E. and K. French (1993), “Common risk factors in the returns on stocks and bonds”, Journal of financial economics, 33 (1), 3-56.
Fama, E., and K. French (1996), “Multifactor explanations of asset pricing anomalies”,
Journal of finance, 51 (1), 55-84.
Gompers, P. and J. Lerner (1997), “Venture capital and the creation of public companies: do venture capitalists really bring more than money?”, Journal of private equity,1 (1), 15-30.
Hoberg, G. and H. Seyhun (2009), “Do underwriters collaborate with venture capitalists in IPOs? Implications and evidence”, working paper, University of Maryland.
James, C. and J. Karceski (2006), “Strength of analyst coverage following IPOs”,
Journal of financial economics,82 (1), 1-34.
Jain, B., and O.Kini (2000), “Does the presence of venture capitalists improve the survival profile of IPO firms?”, Journal of business finance and accounting, 27 (9-10), 1139-1176.
Khorana, A., S. Mola and P. Rau (2009), “Is there life after loss of analyst coverage?”, working paper, Purdue University.
Krigman, L., W. Shaw, and K. Womack (2001), “Why do firms switch underwriters?”,
Journal of financial economics, 60 (2-3), 245-284.
Lang, M., K. Lins and D. Miller (2004), “Concentrated control, analyst following, and valuation: do analysts matter most when investors are protected least?”, Journal of accounting research,42 (3), 589-623.
Loughran, T., and J. Ritter (2004), Why has IPO underpricing changed over time?”,
Financial management, 33 (3), 5-37.
O’Brien, P. and R. Bhushan (1990), “Analyst following and institutional ownership”,
Journal of accounting research, 28, 55-76.
Rajan, R., and H. Servaes (1997), “Analyst following of initial public offerings”,
Journal of finance,52 (2), 507-529.
Ritter, J. and I. Welch (2002), “A review of IPO activity, pricing and allocations”,
Table 1: Description of the IPO sample
Panel A: Number of sample IPO firms by sub-period
1991/1998 301 1999/2000 122 2001/2010 842
Panel B: Sample IPO firms classified by market capitalization (price * shares) at the end of the first month following the offering
Market capitalization, in millions USD
Per cent of sample
Number of IPOs
Less than $50 11.78 149
$50-$99.9 9.09 115
$100-$199.99 15.89 201
$200-$399.99 21.50 272
$400-$999.99 23.16 293
Greater than $1000 18.58 235
All IPO firms 100 1265
Panel C: Industry distribution of sample IPO firms, by two-digit SIC code
SIC code Per cent of
sample
Number of IPOs
Business services (73) 17 215
Chemicals and allied products (28) 11.78 149
Electronic equipment (36) 10.83 137
Instruments (38) 7.19 91
Oil and gas (13) 4.74 60
Industrial equipment (35) 3.87 49
Communications (48) 2.92 37
Electric services (49) 2.77 35
Management and related services (87) 2.53 32
Water transportation (44) 2.45 31
Miscellaneous retail (59) 2.06 26
Other industries (various) 31.86 403
Table 2: Descriptive statistics of orphan and non-orphan IPOs from 1991 to 2010
This table provides characteristics of orphans and non-orphans. An orphan (non-orphan) is an IPO without analyst coverage (with analyst coverage). IPO is the number of issuing firms. AGE is the age in years of the issuing firm at the time of the offer. LONG-TERM DEBT represents all interest-bearing financial obligations in millions, excluding amounts due within one year, at the offering date. SIZE is the market capitalization in millions at the offering date. VC AFFILIATION is the percentage of firms that are affiliated with venture capitalists. UNDERWRITING SYNDICATE is the number of managing underwriters (lead plus co-managers). UNDERPRICING is the percentage difference between the close on the first day of trading and the offer price. INSTITUTIONAL INVESTORS is the percentage of shares held by institutional investors who hold 5% or more of the outstanding shares at the time of the offering. Student’s parametric t-tests and Wilcoxon (w) non-parametric tests are presented to estimate whether the difference between sample distributions is statistically significant. *, ** and *** indicate significant differences at the 10%, 5% and 1% levels, respectively.
Orphan Non-orphan t w
IPO 253 1012
AGE 17 23 1.2 0.2
LONG-TERM DEBT 129.63 431.17 2.6*** 3.9***
SIZE 309.61 1067.46 2.7*** 9.6***
VC AFFILIATION 5.95 38.51 -1.1 -1.1
UNDERWRITING SYNDICATE 6.86 6.48 -0.5 1.9**
UNDERPRICING 13.85 15.53 0.8 1.8*
Table 3: Long-run performance of IPO firms
The long-run BHARs over the 12-, 36-, and 60-month returns are reported. Fama-French is the alpha of running the Fama-French (1993) three-factor regression model. Table presents 1265 IPOs made between 1991 and 2010. A bootstrapped skewness-adjusted t-test is used to estimate whether the BHAR or the alpha are statistically significant. *, ** and *** indicate significant differences at the 10%, 5% and 1% levels, respectively.
1991-1998 1999-2000 2001-2010 1991-2010
Mean t-stat Mean t-stat Mean t-stat Mean t-stat
BHAR
(size & book-to-market adjusted)
60-month returns -12.94 -1.5 -56.13 -3.3*** -6.38 -1.4 -16.40 -3.5***
36-month returns 1.41 0.2 -36.09 -3*** -1.43 -0.5 -4.57 -1.5
12-month retunrs 5.85 1.5 -31.07 -3.3*** 8.76 3.8*** 4.22 2.2**
Fama-French
Table 4 presents the long-run performance of orphan and non-orphan IPO firms over the period from 1991 to 2010. Long-run performance is computed as buy-and-hold abnormal returns over 12, 36, and 60 months. A bootstrapped skewness-adjusted t-test is presented to estimate whether the BHAR or the difference between sample distributions are statistically significant. *, ** and *** indicate significant differences at the 10%, 5% and 1% levels, respectively.
Type of abnormal return
N Size & book-to-market adjusted Fama-French
BHAR60 (%) t-stat BHAR36 (%) t-stat BHAR12 (%) t-stat Alpha (%) t-stat
Full sample: 1991 to 2010
Orphan 253 -52.95 -5.1*** -18.09 -2.1** 5.31 1.2 0.11 0.4
Non-orphan 1012 -8.07 -1.7* -1.17 -0.4 3.95 2** 0.91 3.9***
Difference 44.87 4.6*** 16.92 2.3** -1.35 -0.3 0.75 2.9***
1991 to 1998
Orphan 52 -67.16 -3*** -14.57 -0.5 -11.12 -1.3 0.26 0.7
Non-orphan 249 -1.62 -0.2 4.74 0.7 9.39 2.3** 1.07 3.2***
Difference 65.54 3.7*** 19.32 0.9 20.51 2.3** 0.53 1.2
1999 to 2000
Orphan 22 -141.25 -4.1*** -72.35 -2** -54.80 -2.1** -0.55 -0.4
Non-orphan 100 -37.41 -2.1** -28.11 -2.1** -25.85 -2.6*** 1.96 2.3**
Difference 103.84 3.2*** 44.24 2.1** 28.95 2.4*** 2.50 2.9***
2001 to 2010
Orphan 179 -17.19 -1.5 -10.97 -1.5 17.47 3.6*** -0.01 -0.1
Non-orphan 663 -3.72 -0.8 1.22 0.4 6.40 2.6*** 0.55 1.5
[image:24.842.57.793.116.364.2]Table 5 presents the long-run performance of orphan and non-orphan IPO firms by underwriting syndicate over the period from 1991 to 2010. Firms with a number of managers above the median level are classified as large, otherwise small. Long-run performance is computed as buy-and-hold abnormal returns over 12, 36, and 60 months. A bootstrapped skewness-adjusted t-test is presented to estimate whether the BHAR or the difference between sample distributions are statistically significant. *, ** and *** indicate significant differences at the 10%, 5% and 1% levels, respectively.
Type of abnormal return
Size & book-to-market adjusted Fama-French
BHAR60 (%) t-stat BHAR36 (%) t-stat BHAR12 (%) t-stat Alpha (%) t-stat
Panel A: Large syndicate Full sample: 1991 to 2010
Orphan -115.61 -5.9*** -64.11 -2.6*** -32.65 -2.8*** 0.22 0.5
Non-orphan -16.20 -1.8* -7.60 -1.5 -1.05 -0.3 0.97 2.5***
Difference 99.41 4.9*** 56.52 3.9*** 31.60 3.1*** 0.50 1.2
1991 to 2000
Orphan -123.4 -5.6*** -69.57 -3.9*** -38.94 -2.4*** 0.17 0.2
Non-orphan -36.54 -2.1** -20.16 -2.4*** -6.85 -1.2 1.65 2.5***
Difference 96.90 4.5*** 49.41 3.6*** 32.09 3.3*** 1.1 1.5
2001 to 2010
Orphan -56.08 -0.3 -46.82 -0.5 -14.28 -0.8 0.20 0.3
Non-orphan 9.93 0.7 8.71 1.1 5.41 0.7 0.29 0.7
Difference 66.01 1 55.54 1.4 19.69 0.9 0.1 0.2
Panel B: Small syndicate Full sample: 1991 to 2010
Orphan -49.68 -2.1** 1.37 0.1 9.27 1.1 0.39 0.8
Non-orphan 3.15 0.4 8.28 1.5 2.61 1 1.00 4.3***
Difference 52.84 2.8*** 6.90 0.4 -6.66 -0.7 0.55 1.2
1991 to 2000
Orphan -53.03 -1.9** 8.17 0.3 -8.45 -0.8 0.88 1.5
Non-orphan 5.06 0.5 13.21 1.4 6.39 1.5 1.28 3.8***
Difference 58.08 2.7*** 5.03 0.2 14.84 1.4 0.34 0.7
2001 to 2010
Orphan -25.61 -0.1 -8.42 0.1 25.63 2.2** -0.10 -0.1
Non-orphan -3.14 -0.3 2.68 0.5 0.11 0.1 0.61 2**
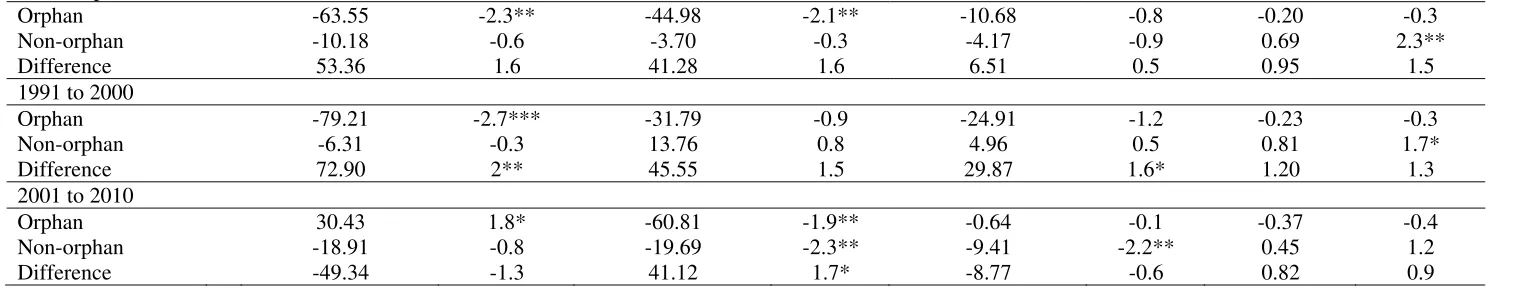
Table 6 presents the long-run performance of orphan and non-orphan IPO firms by underpricing over the period from 1991 to 2010. IPOs that are underpriced above the median level are classified as high, otherwise low. Long-run performance is computed as buy-and-hold abnormal returns over 12, 36, and 60-months. A bootstrapped skewness-adjusted t-test is presented to estimate whether the BHAR or the difference between sample distributions are statistically significant. *, ** and *** indicate significant differences at the 10%, 5% and 1% levels, respectively.
Type of abnormal return
Size & book-to-market adjusted Fama-French
BHAR60 (%) t-stat BHAR36 (%) t-stat BHAR12 (%) t-stat Alpha (%) t-stat
Panel A: High underpriced Full sample: 1991 to 2010
Orphan -81.39 -3.6*** -28.40 -1.2 -13.56 -1.7* -0.08 -0.2
Non-orphan -5.42 -0.7 0.29 0.1 0.77 0.3 0.82 3.5***
Difference 75.97 4.3*** 28.68 1.5 14.32 1.7* 0.86 2.4***
1991 to 2000
Orphan -79.58 -3.4*** -26.36 -0.8 -20.36 -1.9** 0.39 0.8
Non-orphan -11.94 -1.2 -8.06 -1 -1.18 -0.3 1.13 3.5***
Difference 67.63 3.6*** 18.29 0.9 19.18 2.1** 0.69 1.5
2001 to 2010
Orphan -105 -0.1 -35.98 -0.7 3.28 0.2 -0.54 -0.8
Non-orphan 12.15 1.2 10.15 2.1** 2.45 0.6 0.48 1.4
Difference 117.15 1.7* 46.14 1.1 -0.83 -0.1 0.99 1.7*
Panel B: Low underpriced Full sample: 1991 to 2010
Orphan -63.55 -2.3** -44.98 -2.1** -10.68 -0.8 -0.20 -0.3
Non-orphan -10.18 -0.6 -3.70 -0.3 -4.17 -0.9 0.69 2.3**
Difference 53.36 1.6 41.28 1.6 6.51 0.5 0.95 1.5
1991 to 2000
Orphan -79.21 -2.7*** -31.79 -0.9 -24.91 -1.2 -0.23 -0.3
Non-orphan -6.31 -0.3 13.76 0.8 4.96 0.5 0.81 1.7*
Difference 72.90 2** 45.55 1.5 29.87 1.6* 1.20 1.3
2001 to 2010
Orphan 30.43 1.8* -60.81 -1.9** -0.64 -0.1 -0.37 -0.4
Non-orphan -18.91 -0.8 -19.69 -2.3** -9.41 -2.2** 0.45 1.2
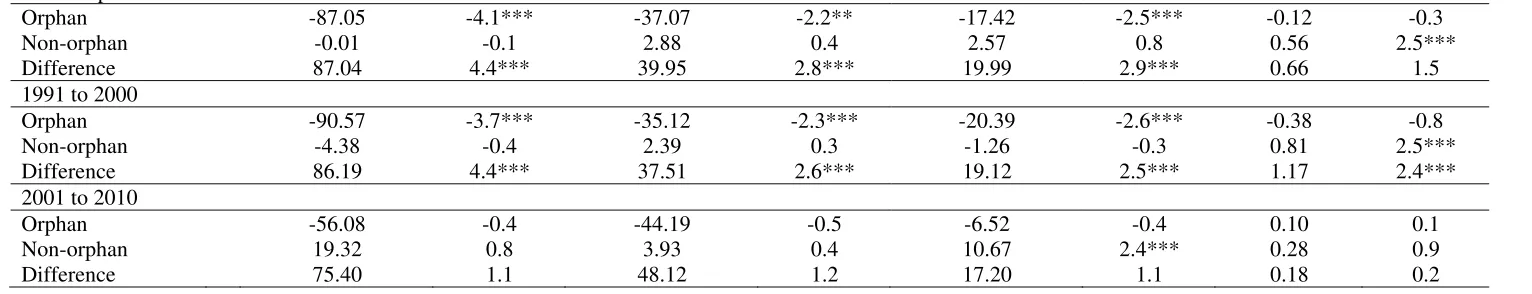
[image:26.842.48.805.372.518.2]Table 7 presents the long-run performance of orphan and non-orphan IPO firms by venture capital affiliation over the period from 1991 to 2010. Long-run performance is computed as buy-and-hold abnormal returns over 12, 36, and 60 months. A bootstrapped skewness-adjusted t-test is presented to estimate whether the BHAR or the difference between sample distributions are statistically significant. *, ** and *** indicate significant differences at the 10%, 5% and 1% levels, respectively.
Type of abnormal return
Size & book-to-market adjusted Fama-French
BHAR60 (%) t-stat BHAR36 (%) t-stat BHAR12 (%) t-stat Alpha (%) t-stat
Panel A: VC-backed IPOs Full sample: 1991 to 2010
Orphan -81.36 -3.1*** -30.96 -0.7 -26.70 -1.7* 0.27 0.5
Non-orphan -15.45 -1.7* -5.02 -0.7 4.13 0.9 1 2.7***
Difference 65.90 2.8*** 25.94 0.9 30.83 2.3*** 0.70 1.3
1991 to 2000
Orphan -87.15 -3*** -26.80 -0.5 -29.56 -1.4 1.05 1.3
Non-orphan -20.82 -1.8* -13.10 -1.3 -0.04 -0.1 1.75 3.8***
Difference 66.33 2.4*** 13.70 0.4 29.52 2** 0.71 1.1
2001 to 2010
Orphan -23.39 -0.1 -51.73 -0.6 -12.43 -0.2 -0.41 -0.5
Non-orphan 2.32 0.2 12.34 1.3 13.09 2.3** 0.19 0.3
Difference 25.71 1.1 64.07 3.1*** 25.52 1.2 0.60 0.7
Panel B: Non–VC-backed IPOs Full sample: 1991 to 2010
Orphan -87.05 -4.1*** -37.07 -2.2** -17.42 -2.5*** -0.12 -0.3
Non-orphan -0.01 -0.1 2.88 0.4 2.57 0.8 0.56 2.5***
Difference 87.04 4.4*** 39.95 2.8*** 19.99 2.9*** 0.66 1.5
1991 to 2000
Orphan -90.57 -3.7*** -35.12 -2.3*** -20.39 -2.6*** -0.38 -0.8
Non-orphan -4.38 -0.4 2.39 0.3 -1.26 -0.3 0.81 2.5***
Difference 86.19 4.4*** 37.51 2.6*** 19.12 2.5*** 1.17 2.4***
2001 to 2010
Orphan -56.08 -0.4 -44.19 -0.5 -6.52 -0.4 0.10 0.1
Non-orphan 19.32 0.8 3.93 0.4 10.67 2.4*** 0.28 0.9
[image:27.842.46.812.371.518.2]Table 8 presents the long-run performance of orphan and non-orphan IPO firms by institutional investor ownership over the period from 1991 to 2010. Firms with a percentage of shares held by institutional investors who hold 5% or more of the outstanding shares at the time of the offering that is above the median level are classified as high, otherwise low. Long-run performance is computed as buy-and-hold abnormal returns over 12, 36, and 60 months. A bootstrapped skewness-adjusted t-test is presented to estimate whether the BHAR or the difference between sample distributions are statistically significant. *, ** and *** indicate significant differences at the 10%, 5% and 1% levels, respectively.
Type of abnormal return
Size & book-to-market adjusted Fama-French
BHAR60 (%) t-stat BHAR36 (%) t-stat BHAR12 (%) t-stat Alpha (%) t-stat
Panel A: High institutional investor ownership Full sample: 1991 to 2010
Orphan -53.70 -1 -26.66 -1.9* -13.32 -1.7* 1.11 1.1
Non-orphan 19.42 2.3** 18.07 3*** 12.43 3.1*** 1.56 3***
Difference 73.12 2.8*** 44.73 3.2*** 25.75 3.1*** 0.45 0.4
1991 to 2000
Orphan -46.09 -0.7 -33.08 -1.8* -18.24 -1.7* 1.35 1.3
Non-orphan 17.04 1.8* 11.95 1.6 9.25 1.8* 1.75 5.9***
Difference 63.13 2.2** 45.03 3.3*** 27.49 2.9*** 0.25 0.2
2001 to 2010
Orphan -95.51 -1.3 -6.49 -0.1 2.15 0.1 0.48 0.2
Non-orphan 30.53 1.5 39.71 3.3*** 23.67 3.2*** 0.93 0.8
Difference 126.05 2** 46.20 1.2 21.54 1.5 0.87 0.3
Panel B: Low institutional investor ownership Full sample: 1991 to 2010
Orphan -83.76 -7.4*** -42.65 -2.7*** -15.41 -2.6*** -0.63 -0.9
Non-orphan -24.78 -2.1** -5.19 -0.4 -9.40 -1.6 -0.05 -0.1
Difference 58.97 4*** 37.47 2.6*** 6.01 0.8 0.65 1.6
1991 to 2000
Orphan -84.69 -6.8*** -42.85 -2.2** -18.24 -2.7*** 0.08 0.2
Non-orphan -30.83 -2.2** -6.59 -0.4 -14.73 -1.9* 0.26 0.5
Difference 53.87 3.5*** 36.25 2.1** 3.50 0.4 0.36 0.8
2001 to 2010
Orphan -71.62 -0.9 -41.45 -1.1 2.01 0.1 -1.93 -1.4
Non-orphan 4.42 0.2 -0.65 -0.1 7.79 1 -0.74 -0.6
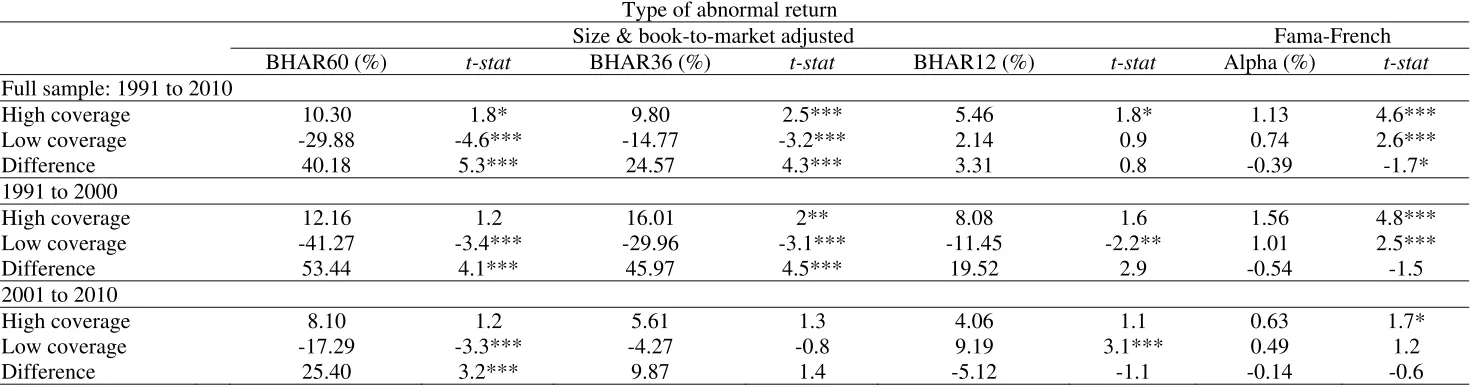
[image:28.842.27.808.386.530.2]Table 9: Long-run performance of non-orphan IPO firms based on analyst coverage from 1991 to 2010.
Table 9 presents the long-run performance of non-orphan IPO firms based on analyst coverage over the period from 1991 to 2010. Those with an amount of analyst coverage above the median level are classified as high, otherwise low. Long-run performance is computed as buy-and-hold abnormal returns over 12, 36, and 60 months. A bootstrapped skewness-adjusted t-test is presented to estimate whether the BHAR or the difference between sample distributions are statistically significant. *, ** and *** indicate significant difference at the 10%, 5% and 1% levels, respectively.
Type of abnormal return
Size & book-to-market adjusted Fama-French
BHAR60 (%) t-stat BHAR36 (%) t-stat BHAR12 (%) t-stat Alpha (%) t-stat
Full sample: 1991 to 2010
High coverage 10.30 1.8* 9.80 2.5*** 5.46 1.8* 1.13 4.6***
Low coverage -29.88 -4.6*** -14.77 -3.2*** 2.14 0.9 0.74 2.6***
Difference 40.18 5.3*** 24.57 4.3*** 3.31 0.8 -0.39 -1.7*
1991 to 2000
High coverage 12.16 1.2 16.01 2** 8.08 1.6 1.56 4.8***
Low coverage -41.27 -3.4*** -29.96 -3.1*** -11.45 -2.2** 1.01 2.5***
Difference 53.44 4.1*** 45.97 4.5*** 19.52 2.9 -0.54 -1.5
2001 to 2010
High coverage 8.10 1.2 5.61 1.3 4.06 1.1 0.63 1.7*
Low coverage -17.29 -3.3*** -4.27 -0.8 9.19 3.1*** 0.49 1.2
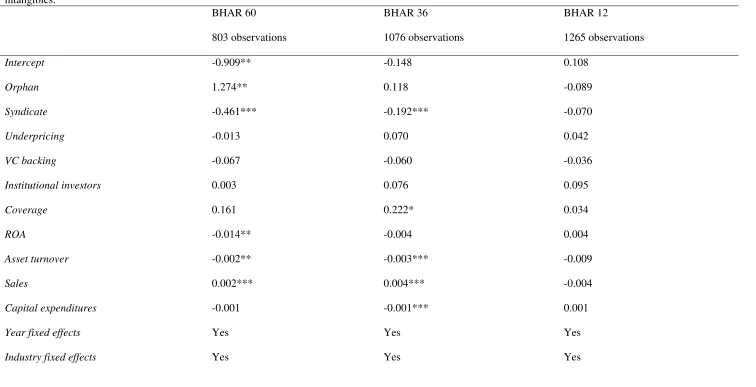
The dependant variable is buy-and-hold abnormal return. *, ** and *** indicate that the coefficient is significantly different from 0 at the 10%, 5% and 1% levels, respectively, using Student’s t-test. We use the 2SLS regression model. The instrumented variable is coverage. The instrument variables are trading volume and intangibles.
BHAR 60
803 observations
BHAR 36
1076 observations
BHAR 12
1265 observations
Intercept -0.909** -0.148 0.108
Orphan 1.274** 0.118 -0.089
Syndicate -0.461*** -0.192*** -0.070
Underpricing -0.013 0.070 0.042
VC backing -0.067 -0.060 -0.036
Institutional investors 0.003 0.076 0.095
Coverage 0.161 0.222* 0.034
ROA -0.014** -0.004 0.004
Asset turnover -0.002** -0.003*** -0.009
Sales 0.002*** 0.004*** -0.004
Capital expenditures -0.001 -0.001*** 0.001
Year fixed effects Yes Yes Yes
[image:30.842.52.808.108.495.2]Definition of regression variables:
Orphan Dummy variable equals 1 if IPOs have analyst coverage and 0 otherwise.
Syndicate Dummy variable equals 1 if the number of managing underwriters is above the median level and 0 otherwise.
Underpricing Dummy variable equals 1 if an IPO’s initial return is above the median level and 0 otherwise.
VC backing Dummy variable equals 1 if venture capitalists are affiliated with the IPO at the time of the offering and 0
otherwise.
Institutional investors Dummy variable equals 1 if the percentage of shares held by institutional investors who hold 5% or more of the outstanding shares at the time of the offering is above the median level and 0 otherwise.
Coverage Dummy variable equals 1 if the amount of coverage is above the median level and 0 otherwise.
ROA Natural logarithm of the change in return on assets. The change is measured 1, 3 and 5 years after the IPO date.
Asset turnover Natural logarithm of the change in asset turnover (sales divided by total assets) The change is measured 1, 3 and 5 years after the IPO date.
Sales Natural logarithm of the change in sales. The change is measured 1, 3 and 5 years after the IPO date.