QUANTIFICATION OF PHARMACOLOGICALLY ACTIVE MARKER
LUPEOL AND PHYTOL FROM LEAF AND STEM OF PERGULARIA
DAEMIA FORSK BY HPTLC METHOD
Sutar N. G.1*, Pal S. C.2 and Ritu Gilhotra3
1
Research Scholar Suresh Gyanvihar University, Jaipur. Sanjivani College of Pharmaceutical Education and Research Kopargaon.
2
R G Sapkal College of Pharmacy Anjeneri, Nashik.
3
Principal, School of Pharmacy, Suresh Gyanvihar University, Jaipur.
ABSTRACT
TLC densitometry method for quantification of Lupeol and Phytol using HPTLC is developed. This is the first report of quantification of these two biologically active compounds as Lupeol and Phytol using HPTLC from this plant. Quantification of Lupeol was carried out from the petroleum ether extract by using a solvent system of Toluene: Methanol (99:1) and for Phytol Chloroform: Methanol (99:1). The Rf
value of Lupeol and Phytol are 0.67 and 0.22 respectively. The linearity ranges of Lupeol and Phytol were (100 to 600ng) with correlation coefficient (r- values) of 0.996 and 0.993 respectively. The amount of Lupeol and Phytol was 1.65% w/w and 0.0007%v/w in leaf and 1.75%w/w and 0.023 %v/w in stem respectively. Quantification of Lupeol and phytol were showed good separation and resolution from other constituent of the extract. The main advantages are its simplicity, selectivity and accuracy. This method can also be employed for estimation of these compounds in other herbal preparation and may be useful for standardization purposes.
KEY WORDS: Pergularia daemia Forsk, HPTLC, Lupeol and Phytol.
INTRODUCTION
Pergularia daemia is pungent, cooling; anthelmintic, laxative, antipyretic; cure biliousness, ulcers, useful in eye troubles, urinary discharges, Leucoderma, strangury, uterine complaints, inflammations; [Kirtikar K.R.,2005] plant extract given for uterine and menstrual troubles
Volume 5, Issue 9, 849-858. Research Article ISSN 2277– 7105
Article Received on 22 June 2016,
Revised on 13 July 2016, Accepted on 02 Aug 2016
DOI: 10.20959/wjpr20169-6889
*Corresponding Author
Sutar N. G.
Research scholar Suresh
Gyanvihar University,
Jaipur. Sanjivani College
of Pharmaceutical
Education and Research
and facilitate partituran, [Siddhu A.S.,2000]. Cough, asthma, amenorrhea, dysmenorrheal, intermittent fever and Leucoderma. [Vaidyaratnam P.S., 2010] Traditionally the plant Pergularia daemia is used as anthelmintic, laxative, antipyretic, infertile diarrhea. [Chopra et.al.1956] The latex is used for toothache applied on wounds for quick relief. It is used as a remedy for cold and fever. [Bhaskar and Balkrishnan.2009] Herbs contain various pharmacological active phytochemical constituents which exerts their therapeutic effect on the human being. [Deepti.et.al., 2015]. Among these various Phytochemical constituent’s triterpenoids and flavonoids are widely distributed in plants. Flavonoid is phenol compounds, which occurs in a free state as well as in glycosides. The plant is reported to contain β-sitosterol, lupeol, α-amyrin, β-amyrin. Lupeol is reported to have anti-inflammatory activity [Geetha and Varalakshmi, 2001], hepatoprotective [Sunitha et al., 2001] and anticancer activity. [Chaturvedi et al., 2008; Saleem et al.,2001 Nigam et al.,2009;Saleem,2009]
[image:2.595.182.408.339.472.2]O H
Figure 1: Chemical structure of lupeol
Phytol is the main active constituent responsible for various activities but till not reported. The main invention of this research is that identification and quantification of this constituent first time from this plant as up till now there is no report for Phytol from Pergularia daemia hence this is the new invention.
have shown a possible association between the antinociceptive and antioxidant properties of a substance.
OH H
Figure 2 chemical structure of Phytol
Phytochemical evaluation is one of the important tools for the assessment of quality which includes preliminary Phytochemical screening, chemical profile and marker compound analysis using modern analytical technique. HPTLC is a suitable method for estimation of chemical constituent present in plant material. Pergularia daemia Forsk contain Lupeol and Phytol are important active constituents which are estimated by HPTLC.
MATERIAL AND METHOD Reagent and material
The leaf and stem of Pergularia daemia were collected from the area near to railway station Yeola, Dist Nashik. Authentication done from Botanical Survey of India having a sample specimen (voucher number NGS-1) has been deposited (Letter no-BSI/WRC/ IDE/NCER/2016/648A, Dated- 22/01/2016). Leaf and stem were a shade dried and powdered to coarse particle size. Standard Lupeol and Phytol were purchased from Eucca Enterprises; Mumbai. Aluminum plates are precoated with silica gel (GF254) of 0.2 mm thickness was used without pretreatment. All chemicals and solvents used were of analytical grade and HPLC grade (E. Merck Mumbai, India).
Preparation of extract
Isolation and standardization of component Separation of unsaponifiable matter
Unsaponifiable matter was separated From the leaves and stem by a chemical process which shows the presence of triterpenes and sterols. [Deepti.et.al., 2015]
Preparation of standard solution and stock solution Standard stock solution of Lupeol
A stock solution of lupeol was prepared by dissolving 10 mg of lupeol in methanol and making up the volume up to 10 ml with methanol. From this solution and diluted to 10 ml by using methanol to get the final concentration of 100 µg/ml.
Standard stock solution of Phytol
A stock solution of Phytol was prepared by dissolving 10 mg of Phytol in 10 ml methanol. Then from this solution 1 ml diluted to 10 ml by using methanol to get the final concentration of 100 µg/ml.
Preparation of sample solution for Lupeol and Phytol
Sample solution of leaf extract, stem extract and their unsaponifiable matter were prepared by dissolving 20 mg of methanol extract in 10 ml methanol to get the concentration of 2000 µg/ml. The solution was filtered through Whatman filter paper no. 41 and it was used for further chromatographic analysis.
Development of HPTLC technique Chromatographic conditions
Inert gas was used as a spray gas where as methanol was used as a solvent at a dosage speed of 150 nl/s. A syringe with a capacity of 100 μl, a predosed volume of 0.2 µl was applied to TLC plate. The numbers of tracks are 06; application position at Y axis 8.0 mm having band length 8.0 mm, the solvent front position was of about 80.0 mm.
Instrument
Merck, Darmstadt, Germany, supplied by ANCHROM TECHNOLOGISTS, MUMBAI) using a Camag Linomat V (Switzerland). The methanol extract sample Volume applied was 250 μl for recording on each plate. A constant application rate of 1.0 μl/s was employed and space between two bands was 5 mm. The slit dimension was kept at 6.0mm × 0.45 mm and 10 mm/s scanning speed was employed. The slit bandwidth was set at 20 nm, each track was scanned thrice and baseline correction was used. The mobile phase for Lupeol is Toluene : Methanol (99:1)v/v and for Phytol Chloroform : Methanol (99:1) for estimation of Lupeol and Phytol Linear ascending development was carried out in 20 cm x 10 cm twin trough glass chamber (Camag, Muttenz, Switzerland) saturated with filter paper Whatman no:1 in the mobile phase. The optimized chamber saturation time for mobile phase was 20 min. at room temperature (250 C ± 2) at relative humidity of (60% ± 5). The length of chromatogram run was 8.0 cm. Subsequent to the scanning, TLC plates were dried in a current of air with the help of an air dryer. Densitometry scanning was performed with Camag TLC scanner IV in the reflectance absorbance mode at 540 and 560 nm and operated by Win CATS software (1.4.6 Camag) with the help of tungsten lamp. Subsequent to the development; The TLC plate was dried in oven at 1100C. Concentrations of the compound chromatographed were determined from the intensity of diffusely reflected light. Evaluation was carried out by comparing peak areas of linear regression with the samples, were spotted in the forms of bands with Camag microlitre syringe on a precoated silica gel GF254 plates using camag
linomat V. automatic sample spotter of band width 8 mm. The plates were developed in a solvent system in CAMAG glass twin trough chamber previously saturated with the solvent for 30min.the distance was 8 cm subsequent to the scanning.TLC plates were air dried and scanning was performed on In the CAMAG TLC scanner in absorbance at 540 nm and 560nm operated by Wincats software 4.03 version.
Specificity
Calibration curve
Calibration curve for Lupeol and Phytol in different volume were located on the different TLC plate for the preparation of calibration curve (1-6 µl of Lupeol and Phytol) checked for reproducibility. The calibration curve was prepared by plotting concentration of standards vs. average peak area after scanning at 540 nm and 560 nm.
Quantification of Lupeol and Phytol
Estimation of Lupeol and Phytol from petroleum ether extract of leaf and stem and their unsaponifiable matter of Pergularia daemia Forsk.
Standard : Lupeol.
Stationary phase : Silica gel GF254 plates.
Mobile phase : Toluene: Methanol (99:1) v/v Standards : Phytol (100 µg/ml),
Stationary phase : Silica gel GF254 plates.
Mobile phase : Chloroform: Methanol (99:1)
Sample : Methanol extract of Pergularia daemia Fork leaf (2000 µg/ml) and stem (2000 µg/ml).
Migration distance : 8 cm.
Scanning wavelength : 540nm for Lupeol and 560 nm for Phytol. Mode of scanning : Absorption (deuterium).
RESULT AND DISCUSSION
Table: 1. Summary of Validation parameter
Table 1: Method validation data for HPTLC quantification of Lupeol and Phytol in methanol extract of leaf stem of Pergularia daemia Forsk.
Sr. No. Method property Value
8 Interlay precision (RSD % n=6 ) on same day
Phytol 0.856
9 Limit of quantitation of Lupeol (ng/μl) 10 ng/μl 10 Limit of quantitation of Phytol (ng/μl) 2 ng/μl 11 Limit of detection of Lupeol (ng/μl) 15 ng/μl 12 Limit of detection of Phytol (ng/μl) 7.2 ng/μl 13 Specificity Specific
[image:7.595.114.485.73.174.2]Toluene : Methanol (99:1)v/v was selected which gives best resolution of Lupeol and Chloroform : Methanol (99:1) for Phytol (Rf = 0.67 and 0.22). The identified band of Lupeol and Phytol in the plant extract was confirmed by overlay in UV absorption spectra with those of standard Lupeol and Phytol using Camag TLC scanner. The purity of bands of Lupeol and Phytol in the plant extract was confirmed by overlaying the absorption spectra at the start, middle and end position of band (Figure 8-14).
Figure 3:HPTLC chromatogram of Standard Lupeol
Figure 9:HPTLC chromatogram of Standard Phytol
Figure 4:HPTLC chromatogram of lupeol from unsaponifiable matter of leaf
Figure 10:HPTLC chromatogram of Phytol from unsaponifiable matter of leaf
Figure 5:HPTLC chromatogram of lupeol from unsaponifiable matter of stem
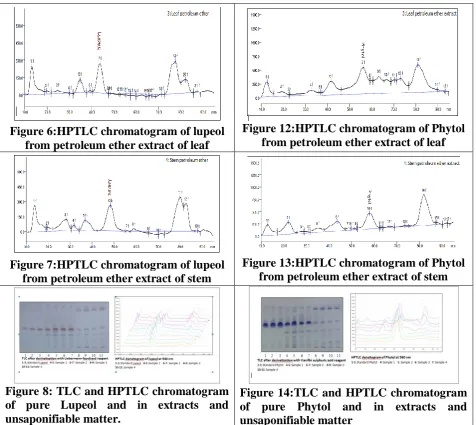
[image:7.595.63.538.320.725.2]Figure 6:HPTLC chromatogram of lupeol from petroleum ether extract of leaf
Figure 12:HPTLC chromatogram of Phytol from petroleum ether extract of leaf
Figure 7:HPTLC chromatogram of lupeol from petroleum ether extract of stem
Figure 13:HPTLC chromatogram of Phytol from petroleum ether extract of stem
Figure 8: TLC and HPTLC chromatogram of pure Lupeol and in extracts and unsaponifiable matter.
Figure 14:TLC and HPTLC chromatogram of pure Phytol and in extracts and unsaponifiable matter
[image:8.595.158.442.588.705.2]
Figure 16: Calibration curve obtained by chromatography of marker compound Phytol. regression via area regression mode = linear.
Table 2: Concentration in % w/w of Lupeol in leaves and stem of Pergularia daemia Forsk.
Sr. No.
content Sample Name (%v/w)
Amount
applied (µl) Area Lupeol 1 Leaf unsaponifiable matter 2 2746.04 25.75 2 Stem unsaponifiable matter 2 4052.54 39.25 3 Leaf petroleum ether extract 6 752.00 1.65 4 Stem petroleum ether extract 6 784.88 1.75
Table 3: Concentration in % w/w of Phytol in leaves and stem of Pergularia daemia Forsk.
Sr. No. Sample Name (%v/w) Amount
applied (µl) Area
Phytol content 1. Leaf unsaponifiable matter 2 10302.56 1.46 2. Stem unsaponifiable matter 2 9727.46 1.35 3. Leaf petroleum ether extract 20 2952.02 0.0007 4. Stem petroleum ether extract 20 4116.99 0.023
CONCLUSION
The HPTLC method has been developed with some modification and it can be used for quantitative determination of Lupeol and Phytol in petroleum ether extract and their unsaponifiable matter of leaf and stem of Pergularia daemia Forsk. The main advantage of this method is simplicity, accuracy and selectivity. This method can also be used for estimation of these compounds in other several herbal preparations and may be used for standardization purpose.
ACKNOWLEDGEMENT
REFERENCES
1. Dhawal, K., Shinde V.M., Mahadik, K.R., Namdeo A.G., J Sep Sci., 2007; 30: 2053-2058.
2. Harbone, A.J., 2007. Phytochemical methods, Springer. 3. American Cancer Society, 2008.
4. 187 Fake Cancer 'Cures' Consumers Should Avoid, from the U.S. Food and Drug Administration. Accessed June 17, 2008.
5. Jalalpure, S.S., Habbu, P.V., Patil M.B., Indian Journal of Pharmaceutical Sciences, 2002; 64(5): 493.
6. Kirtikar, K.R., Basu, B.D., Indian Medicinal Plant, 2005; 3: 1616. 7. Siddhu, A.S., The Useful Plant of India, 2000; 440.
8. Vaidyaratnam PS, Indian Medicinal Plant, 2010; 44: 1995:236.
9. Chopra, R.N., Nayar, S.L., Chopra, I.G., Glossary of Indian Medicinal Plant, 1956; 188. 10.Bhaskar, V.H., Balkrishnan, N., International Journal of Pharm. Tech Research, 2009;
1(4): 1305
11.Leela, V., Saraswathy, A., Analytical and Bioanalytical Technique, 2013; 4: 1.
12.Deepti.et al., “HPTLC densitometric quantification ofstigmasterol and Lupeol from Ficus religosa”: Arabian journal of Chemistry, 2015; 8: 366-371.
13.Chaturvedi,P.K.,Bhui K.,Shukla. Y., Cancer Lett., 2008; 263: 1-13. 14.Geetha, T., Varaklakshmi, P., J. Ethanopharmacology, 2001; 76: 77-80.
15.Nigam, N., Prasad, S., George, J., Shukla, Y., Biochem. Biophys. Res Comm, 2009; 381; 253-258. Saleem, M., Cancer Lett., in Press.
16.Saleem, M., Alam, A., Arifin,S., Shah, M. S., Ahmed, B., Sultana, S., Pharmacol. Res., 2001; 43: 127-134.