Complementary genetic and functional analyses of genes
involved in adiposity.
MEECHAN, Daniel W.
Available from Sheffield Hallam University Research Archive (SHURA) at:
http://shura.shu.ac.uk/20051/
This document is the author deposited version. You are advised to consult the publisher's version if you wish to cite from it.
Published version
MEECHAN, Daniel W. (2003). Complementary genetic and functional analyses of genes involved in adiposity. Doctoral, Sheffield Hallam University (United Kingdom)..
Copyright and re-use policy
See http://shura.shu.ac.uk/information.html
i CITY CAMPUS, HOWARD STREE SHEFFIELD S} IWO
101 768 447 2
r
ProQuest Number: 10697358
All rights reserved
INFORMATION TO ALL USERS
The quality of this reproduction is dependent upon the quality of the copy submitted.
In the unlikely event that the author did not send a com plete manuscript and there are missing pages, these will be noted. Also, if material had to be removed,
a note will indicate the deletion.
uest
ProQuest 10697358
Published by ProQuest LLC(2017). Copyright of the Dissertation is held by the Author.
All rights reserved.
This work is protected against unauthorized copying under Title 17, United States C ode Microform Edition © ProQuest LLC.
ProQuest LLC.
789 East Eisenhower Parkway P.O. Box 1346
Complementary Genetic and Functional Analyses of Genes
involved in Adiposity
Daniel William Meechan
A thesis submitted in partial fulfilment of the requirements of
Sheffield Hallam University
for the degree of Doctor of Philosophy
Abstract
Leptin is a 16-kDa protein that is primarily secreted by adipose tissue. It affects body mass regulation by constituting part of the adipostat, that acts to alert the brain of the body’s stored energy levels. Additional roles in immune function, reproduction and inflammation are known.
Genetic studies of single nucleotide polymorphisms (SNPs), that exist in the
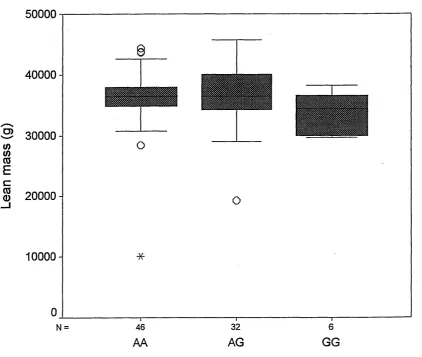
extracellular domain of the leptin receptor gene, were undertaken in a population of European Caucasian postmenopausal women to investigate associations with indicators of adiposity. Homozygosity of the G allele of the LYS109ARG SNP was associated with lower mean fat mass levels and BMI. Furthermore, linkage
disequilibrium was detected between this SNP and GLN223ARG, which in previous studies was also associated with indicators of adiposity. No associations were found between the LYS656ASN SNP and the tested phenotypes.
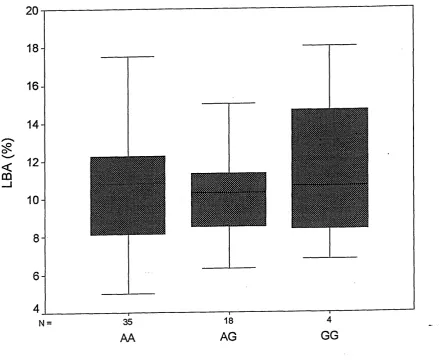
To complement genetic studies of the leptin receptor, cDNA constructs representing different combinations of the alleles for SNPs in the leptin receptor were generated and subsequent expression of protein variants was conducted in COS-7 cells. Using a radioactive ligand-binding assay, labelled leptin was shown to specifically bind to the LYS109ARG223 and GLN223ARG protein variants, thereby testing the effect of the GLN223ARG mutation on LBA Preliminary data, suggest that the ARG allele appeared to bind less leptin than the GLN.
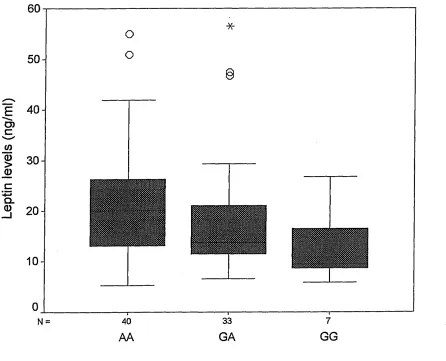
Genetic studies were carried out on polymorphisms in related candidate genes. A promoter polymorphism (G -2548 A) in the leptin gene was associated with lower mean BMI and leptin levels in a cohort of European Caucasian postmenopausal womea
Individuals who lacked the 2 repeat allele of the variable number tandem repeat (VNTR) polymorphism present in intron two of the interleukin 1 receptor antagonist gene had an association with lower leptin levels but not BMI or fat mass. This suggests a potential feedback and / or cross-talk mechanism between leptin and members of the IL-1 family of cytokines in processes other than adiposity. Immunity and inflammation are processes where the interleukin one receptor antagonist protein has a prominent role and in which the function of leptin is increasingly being investigated, therefore an interaction between the two cytokines may be specific for these conditions.
The TNF alpha (G -308 A) SNP was also investigated but no associations were observed between this SNP and the phenotypes in the postmenopausal cohort.
Acknowledgements
I would like to thank Dr. Alex Blakemore for her supervision and guidance throughout
my PhD studies.
I would also like to thank Professor Anna Kessling for supporting my studies during
my time at the department of Medical and Community Genetics, Imperial College
London.
This PhD was funded by Knoll Pharmaceuticals and Sheffield Hallam University.
I would like to thank the colleagues and friends who I have encountered in my 'tale of
two cities'. From my time in Sheffield thanks to Bev, Emma, Naomi, Hafid, Mahmoud,
Mike, Arun, Rachel and David. From London, Emma (again), Hafid (again), Pippa,
Soji, Kieron, Michelle, Diane, Simon, Howard and Una. It has been a pleasure to meet
so many nice people during different stages of my PhD.
Thanks too, to Jen and Will for keeping me entertained, fed and watered at opportune
moments.
And finally thanks to my parents for all their support (both moral and financial!).
I am indebted for their constant enthusiasm and assistance that have sustained me
during the good and trying times of my studies.
Abbreviations
A Adenine
AGRP Agouti-related protein
AN Anorexia nervosa
AP Alkaline phosphatase
ARG Arginine
ASN Asparagine
BMI Body mass index
bp base pair
C2 Ca2+ binding fold domain
C/EBP CCAAT/enhancer binding protein
C Cytosine
cDNA complementary DNA
CHO Chinese hamster ovary cells
CK Cytokine receptor domain
CMV Cytomegalovirus
CRF Corticotrophin releasing factor
CPM Counts per minute
D' Coefficient of linkage disequilibrium
db diabetes
DEXA Dual energy x-ray absorptiometry
DMEM Dulbecco's modified eagle medium
DNA Deoxyribonucleic acid
dNTP Dideoxynucleotide triphosphate
EDTA Ethylenediamine-tetraacetic acid
ELISA Enzyme linked immunosorbent assay
EMSA Electrophoretic mobility shift assay
ER Endoplasmic reticulum
ERK Extracellular factor regulated kinases
F3 Fibronectin type III domain
fa fatty
FBS Fetal bovine serum
G Guanine
G-CSF Granulocyte-colony stimulating factor
GLN Glutamine
HCL Hydrochloric acid
HEK293 Human embryonic kidney 293 cell line
HUGO Human genome organisation
HRP Horse-radish peroxidase
I Iodine
IL Interleukin
JAK Janus kinase
kb kilobase
kDa kilodalton
LBA Leptin binding assay
LEP human leptin gene
Lep mouse leptin gene
LEPR human leptin receptor gene
Lepr mouse leptin receptor gene
LIF Leukaemia inhibitory factor
LPS Lipopolysaccharide
LYS Lysine
MAPK Mitogen activated protein kinase
MgCl2 Magnesium chloride
mRNA messenger RNA
NaCl Sodium chloride
NaOH Sodium hydroxide
NIH National Institutes of Health
nm Nanometre
NPY Neuropeptide Y
ob obese
Ob-R Leptin receptor
PAGE Polyacrylamide gel electrophoresis
PBS Phosphate buffered saline
PCR Polymerase chain reaction
POMC Pro-opiomelanocortin
PRO Proline
PTP1B Protein tyrosine phosphatase IB
RFLP Restriction fragment length polymorphism
RNA Ribonucleic acid
RT-PCR Reverse transcriptase-polymerase chain reaction
SDS Sodium dodecyl sulphate
SNP Single nucleotide polymorphism
SOCS Suppresor of cytokine signalling
Spl Stimulatory protein 1
SPSS Statistical package of the social sciences STAT Signal transducer and activator of transcription
T Thymine
Taq Thermus Aquaticus
TBE Tris-borate EDTA buffer
TEMED N,N,N',N'-T etramethylethylenediamine
TNF-alpha Tumour necrosis factor alpha
pCi MicroCuries
VNTR Variable number of tandem repeats
YAC Yeast artificial chromosome
Publications relevant to this thesis
Paper:
SNPs in the leptin receptor gene: studies in anorexia nervosa
Meechan DW, Quinton ND, Brown K, Eastwood H and Blakemore AIF Pyschiatric Genetics(In press).
Abstracts and poster presentations:
European Congress on obesity, Antwerp, 2000
Meechan DW, Quinton ND, Laird SM, Li TC and Blakemore AIF. 2000, Serum leptin and leptin binding activity in women who suffer recurrent miscarriage during early pregnancy. International Journal of Obesity24: P198.
American Society of Human Genetics, San Diego, 2001
Meechan DW, Quinton ND, Pieri LF, Brown KMO, Eastwood HE and Blakemore AIF (2001) Analysis of the leptin receptor SNP GLN223ARG in anorexia nervosa. American Journal of Human Genetics 69 (4): A2363.
British Society of Human Genetics, York, 2003
Meechan DW, Quinton ND, Eastell R and Blakemore AIF (2003)
Molecular and functional studies of SNPs in the human leptin receptor gene. Journal o f Medical Genetics(In press).
American Society of Human Genetics, Los Angeles, 2003 Meechan DW, Quinton ND, Eastell R and Blakemore AIF (2003)
Title Page...I Abstract...II
Acknowledgments...m
Abbreviations... IV
Publications arising from this thesis... VI
Table of Contents
Chapter 1 Introduction... ... 1
1.1 Adiposity ...2
1.1.1 Obesity... 2
1.1.2 Underweight... 4
1.1.3 Measurements of adiposity... 4
1.1.4 Heritability of body composition ... 6
1.2 The Adipostat... 7
1.2.1 Main players of the Adipostat...7
1.3 Leptin and the Leptin Receptor...10
1.3.1 Identification and organisation of the ob (leptin) gene... 10
1.3.2 Leptin protein structure...14
1.3.3 Identification and organisation of the leptin receptor gene... 14
1.3.4 Leptin receptor protein structure...17
1.3.5 Leptin receptor signalling... 20
1.3.6 Leptin and leptin receptor levels in humans... 24
1.3.7 Other activities of the leptin system...27
1.3.8 Reproduction...27
1.3.9 Leptin and the cytokine network...28
1.4 Genetic Concepts and Methods...29
1.4.1 Single Nucleotide Polymorphisms (SNPs); a type of genetic variation 30 1.4.2 Linkage disequilibrium... 31
1.4.3 Linkage Analysis... 32
1.4.4 Association studies... 33
1.4.5 Transmission disequilibrium test...34
1.5 Genetics of Leptin and the Leptin Receptor...34
1.6 Aims of the study... 40
Chapter 2 Materials and Methods... 41
2.1 Anthropometric measurements... 42
2.2 Genotyping...42
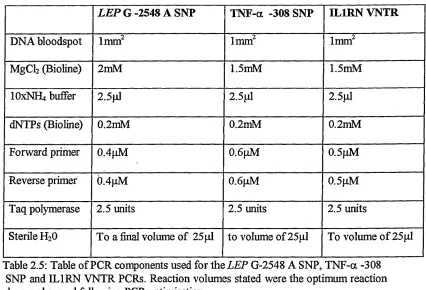
2.2.1 Polymerase Chain Reaction (PCR) of SNPs in the human leptin receptor gene (LEPR)...42
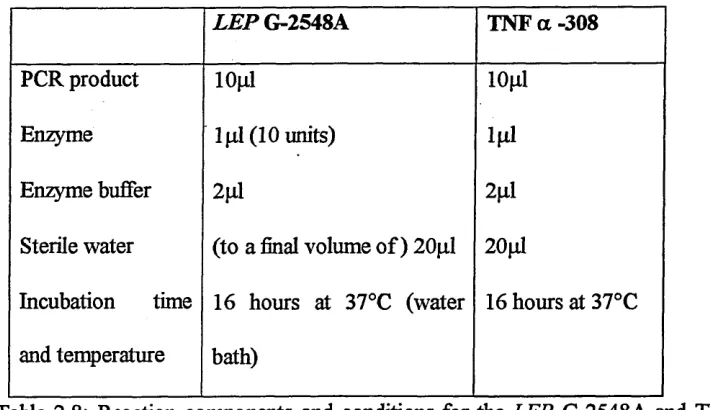
2.2.2 LEPR SNPs PCR product digestion...45
2.2.3 PCR of SNPs in the LEP, TNF-alpha and DL1RN genes...46
2.2.5 IL1RN VNTR Genotyping ...49
2.3 Nucleic acid purification techniques...50
2.3.1 Plasmid purification from bacterial cultures...50
2.3.2 DNA purification from agarose gel (Gene Clean protocol)... 51
2.3.3 Assessment of DNA concentration and purity...52
2.3.4 RNA purification techniques... 52
2.3.5 Preparation of cultured cells for RNA extraction...52
2.3.6 Assessment of RNA concentration and purity...53
2.4 Reverse Transcriptase-PCR (RT-PCR)...54
2.4.1 First strand cDNA synthesis...54
2.4.2 PCR of LEPR extracellular domain...55
2.5 Recombinant DNA techniques... 56
2.5.1 pGEM-T cloning...56
2.5.2 pCMV-Tag 2B cloning... 56
2.5.3 Site-directed mutagenesis... 57
2.5.4 Transformation...59
2.5.5 Cell transformation with the pGEM-T vector... 59
2.5.6 Cell transformation with the pCMV plasmid... 60
2.5.7 Cell transformation with site-directed mutant pCMV plasmids...60
2.5.8 DNA sequencing...61
2.5.9 Plasmid digestion... 61
2.6 Electrophoretic Techniques for DNA samples...62
2.6.1 Agarose gel electrophoresis... 62
2.6.2 Polyacrylamide gel electrophoresis (PAGE) gel electrophoresis...62
2.7Cell culture methods...64
2.7.1 COS-7 Cell culture Methods... 64
2.7.2 Cell feeding...64
2.7.3 Cell counting...64
2.7.4 Sub-culturing...65
2.7.5 COS-7 Cell Transfection... 65
2.8 Protein purification and analysis... 66
2.8.1 Immunoprecipitation...66
2.8.2 Cell lysis... 66
2.8.3 Flag Fusion Protein Immunoprecipitation...67
2.8.4 Elution of the FLAG-fusion protein...67
2.8.5 Leptin Receptor Enzyme-Linked Immunosorbent Assay (ELISA)...68
2.8.6 Leptin receptor Protein Deglycosylation...69
2.8.7 Measurement of leptin binding activity...69
2.8.8 Sodium Dodecyl Sulphate Polyacrylamide Gel Electrophoresis ... 71
2.8.9 Sample preparation for SDS-PAGE... 71
2.8.10 Gel preparation and running conditions...71
2.8.11 Protein Silver staining...72
2.9 Statistical Analysis...73
2.9.1 Hardy-Weinberg Equilibrium... 73
2.9.2 Chi- squared analysis of contingency tables...74
2.9.3 Carriage rates...75
2.9.4 Haplotype Analysis...75
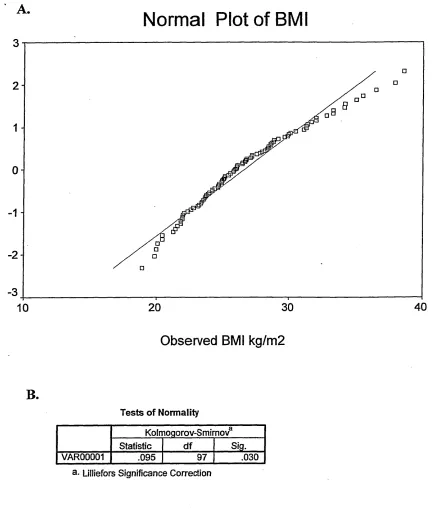
2.9.8 Box and whisker plot...78
Chapter 3 Investigation of SNPs in the LEPR gene in relation to adiposity 80 3.1 Introduction... 81
3.1.1 Aims of the study... 83
3.2 Study Design...83
3.2.1 Statistical Analysis... 85
3.3 Results... 87
3.3.1 LYS109ARG polymorphism...87
3.3.2 LYS656ASN polymorphism...94
3.4 Haplotype results... 101
3.5 Discussion... 104
Chapter 4 Functional studies of the leptin receptor... 106
4.1 Introduction... 107
4.1.1 Aims of study... 109
4.2 Study Design... 109
4.2.1 PCR amplification and cloning of soluble LEPR... 109
4.2.2 Site-directed mutagenesis...120
4.2.3 Recombinant LEPR production and protein analysis... 121
4.3 Discussion ... 131
Chapter 5 Investigation of polymorphisms in other relevant cytokine genes in relation to adiposity... 135
5.1 Introduction...136
5.1.1 Study aims... ...139
5.2 Study Design... 139
5.2.1 Statistical Analysis...143
5.3 Results... 143
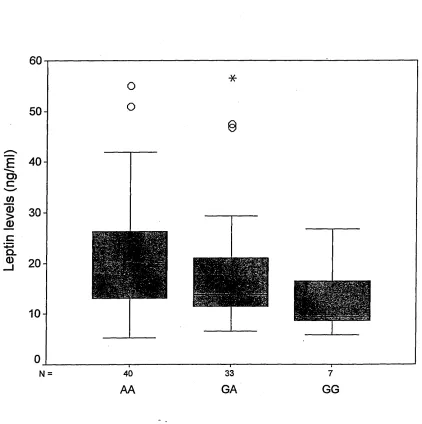
5.3.1 LEP G-2548 A SNP...143
5.3.2 TNF-alpha -308 SNP...150
5.3.3 IL1RN VNTR...157
5.4 Discussion... 164
Chapter 6 Case-Control Association study of LEPR SNPs in Anorexia Nervosa ...167
6.1 Introduction ... 168
6.1.1 Aims of the study... ..170
6.2 Study Design... 170
6.2.1 Analysis... 171
6.3 Results... 171
6.4 Discussion ... 176
Chapter 7 General Discussion...178
1.1 Adiposity
Adiposity is the level of fat present in the body. The opposing processes of energy
intake and energy expenditure set this level. Precise and definite mechanisms are
employed to measure and hence regulate levels of adiposity. Any elements which lead
to a dysregulation of this system will affect body composition and health status.
1.1.1 Obesity
Obesity is one of the most common and serious health problems faced by industrialised
societies. In essence, it becomes manifest when energy intake (via food) exceeds
energy output over a period of time. The epidemic of obesity is most striking in the
USA with 63% of men and 55% of women being classified as overweight (Must et al,
1999) and figures are rising.
It has been associated with many diseases such as coronary heart disease, type 2
diabetes mellitus, and osteoarthritis. Although the exact mechanism for the association
with these conditions has not been established, the associated life expectancy, quality
of life and health cost issues are a relevant and major cause for concern.
Obesity is accompanied by complications such as hypertension and atherosclerosis,
which can lead to heart failure. An analysis of the relationship between adiposity and
incidence of heart failure was undertaken by Kenchaiah et al (2002) in the
Framingham Heart study. In this study, a graded increase in the risk of heart failure
with increasing obesity was highlighted among the 5881 participants.
A study of more than 11,000 women carried out in the US showed that measurements
1995) although unequivocal medical evidence explaining the relationship is not yet
known.
Skeletal systems may be affected by increased weight bearing. Hip and knee
osteoarthritis is most common in white Europeans compared to other groups with
approximately 7-25% of Caucasian individuals over 55 years of age suffering from the
disorder in the hip. Felson and colleagues (1998) identified strong epidemiological
evidence that increasing levels of obesity lead to susceptibility of knee osteoarthritis
and a more moderate influence on osteoarthritis of the hip.
Fat distribution has different characteristics associated with gender. This is anecdotally
observable with men tending to have more abdominal fat ('apple-shape') whereas
women tend to have more fat on their hips and buttocks ('pear-shape’). Furthermore,
changes in body fat distribution occur in women through reproductive cycling and
childbearing (For review see, Legato, 1997). The different distribution of adipose
tissue between sexes may have unique health implications.
It is difficult to associate many benefits with obesity. Yet it has been hypothesised that
natural selection favoured a thrifty genotype in human history where a lower rate of
energy expenditure and / or hyperphagia would lead to increased fat stores during
times of food surplus. Body fat reserves would then be advantageous during times of
food shortage (Heel, 1962). Unfortunately, in modem western societies where food is
plentiful and physical exercise in the general population is on the decline this
adaptation would no longer be beneficial resulting in marked obesity.
1.1.2 Underweight
At the other end of the body composition spectrum is the underweight phenotype.
Underweight is associated with a variety of health issues including loss of reproductive
function, depressed immunological responses and starvation (Hsu, 1980)
One of the most distressing manifestations of underweight is that of anorexia nervosa
(AN). Classification criteria include maintenance of bodyweight at 85% or less of
normal weight adjusted for age and height, amenorrhoea in female sufferers and an
intense fear of weight gain. Indeed, behavioural patterns encompassing perfectionism
and obsessionality are common amongst AN sufferers (Bulik et al, 2003). In addition,
AN can be further classified into restricted eating and binge/purge sub-types. As being
underweight is a criteria for AN, individuals suffer the physiological consequences of
starvation, and mortality figures approaching 16% have been recorded after a 20 year
follow up study (Crisp et al, 1992).
1.1.3 Measurements of adiposity
There are several methods of measuring indicators of adiposity, which are used in
studies, with each method having associated drawbacks and benefits. A frequently used
indicator is body mass index (BMI), where the weight of an individual in kilograms is
divided by the square of their height in metres. This is a simple measurement to carry
out but does not differentiate between fat mass and lean mass (Table 1.1 highlights
BMI kg/m2 <18.5 18.5-24.9 25-29.9 30-39.9 >40
WHO classification Underweight
Grade 1 overweight Grade 2 overweight Grade 3 overweight
Popular description Thin
Healthy, normal Overweight Obese
Morbidly obese
Table 1.1: Classification of weight based upon BMI measurements
Another frequently used measurement is skinfold thickness, which can be carried out
using callipers at multiple surface sites on the body. Specifically the SF8 value
measures the sum of skinfold thickness at eight different points of the body but is
unable to measure abdominal or intramuscular fat.
Bio-impedance measurements determine conductance of an electrical impulse through
the body based on the principle that lean mass conducts better than fat mass. This is a
simple and effective device, but is no more accurate than the previous tests. Variation
in measurements can result from the point during the day at which readings are taken
and also hydration levels at time of measurement.
Dual energy x-ray absorptiometry (DEXA) measurements afford accurate
determination of fat and lean mass but require specialised equipment and handling
making them impractical in field measurements.
1.1.4 Heritability of body composition
The role of heritability in the susceptibility to obesity and AN has been examined. Twin
studies of adults from industrialised nations have resulted in heritability estimates
varying between 50 and 80% using BMI as an indicator of obesity (Stunkard et al,
1986, Allison et al., 1994, and Borecki et al., 1998), with lower values for family studies (For review, Comuzzie and Allison, 1998). Such variation is thought to come
from age-specific effects of genes on BMI, as well as gender specific differences
(Korkeila et al, 1991). Twin studies in children show the highest heritability, with about 80% for BMI (Pietilainen et al, 1999).
Results of twin studies of eating disorders, including AN, have been less consistent
than studies of obesity. Observations of higher concordance rates for AN amongst
monozygotic twins versus dizygotic twins (differentiating between shared genes and
environment versus shared environment) was not observed by Walters and Kendler,
(1995) using a general twin registry. However, Treasure and Holland (1994) found a
higher level of AN amongst monozygotic twins versus dizygotic in a more targeted
study using twin registries, advertisements and clinical populations. As such, the
genetic and environmental contribution to eating disorders requires clarification and
1.2 The Adipostat
Located in the brain, the hypothalamus is the central mediator of regulation of body
composition. To fulfil this role, it is able to detect the level of adiposity via a factor
secreted by adipose tissue into the blood stream After which, this factor is able to
interact with the hypothalamus and activate specific downstream signals which
moderate food intake and energy expenditure. This concept was historically termed as
the adipostat (Kennedy, 1953).
1.2.1 Main players of the Adipostat
There are three distinct pathways that contribute to the adipostat as a whole. Neural
mechanisms, that are activated as a result of gut distension following food intake, are
undoubtedly involved in restricting further food intake by stimulating the appropriate
areas of the brain (Tack et al, 2002). Also gut hormones (for example PYY 3-36),
which are released postprandially from the gastrointestinal tract in proportion to the
calorie content of the meal, reduce food intake (Batterham et al., 2002).
Thirdly, cytokines that are secreted from adipocytes (fat cells) into the blood stream in
direct relation to the body’s fat reserves and level of food intake.
Leptin is a 16 kilodalton (kDa) cytokine, which is primarily expressed by adipocytes,
which secrete the protein into the blood circulation. When food is scarce, the
adipocytes secrete less leptin into the bloodstream It is also released from the
adipocytes (above basal levels) a period of time after food intake.
Leptin is able to cross the blood brain barrier and specifically bind to leptin receptors
within the arcuate nucleus region of the hypothalamus of the brain. The hypothalamus
is crucial in maintaining body weight control and the main area where leptin exerts its
actions by informing the brain about the status of energy reserves. Hence, it is the
blood borne factor, first postulated by Kennedy (1953). There are two specific cell
types within the arcuate nucleus region of the hypothalamus that have a high
concentration of leptin receptor and to which leptin binds. These cell types are able to
express the pro-opiomelanocortin (POMC), agouti-related protein (AGRP) and
neuropeptide Y (NPY) hormones. Cells that release NPY (a 36 amino acid peptide)
stimulate food intake via the hormone binding to a sub-set of cells called the
paraventricular nucleus activating specific downstream signals (Stephens et al, 1995). Stephens and colleagues (1995) demonstrated that administration of recombinant leptin
to lean and ob/ob mice suppressed food intake by having an inhibitory effect on the amount of NPY released. This was experimentally determined because the area of the
arcuate nucleus, that stained positive for an antisense ribonucleotide probe specific for
NPY messenger RNA, was decreased after leptin delivery.
Various POMC-derived melanocortin peptides including a-melanocortin stimulating
hormone (a-MSH) are able to act on a cell sub-set within the lateral hypothalamic
area, inhibiting food intake (Fan et al, 1997, Elias et al, 1999).
At the molecular level, the binding site for a-MSH is the melanocortin 4 receptor
(Mc4R). a-MSH behaves as a high affinity agonist, initiating downstream anorexigenic
responses to this receptor. Using similar techniques to those that were used on the
NPY pathway, leptin binding was shown to have a stimulatory effect on this pathway
in rats (Schwartz et al, 1997).
administration and ubiquitous expression of human AGRP in transgenic mice results in
obesity. By competing with the same receptor sites as POMC derived hormones,
AGRP inhibits the satiety effects of leptin.
Evidence suggests that pathways involving NPY, POMC and AGRP participate in an
integrated system within the hypothalamus, contributing to the adipostat mechanism.
Considering the combined affects of leptin on this pathway, leptin can be described as a
satiety factor in that it reduces the desire to keep eating after food intake (Gibbs et al.,
1973) and so plays a key role in regulating the bodies’ energy balance. Table 1.2 lists
several neurotransmitters that affect feeding behaviour.
Stimulatoiy Inhibitory
Neuropeptide Y 5 -hy droxytiyptamine
Orexin Corticotrophin releasing factor (CRF)
Melanin concentrating hormone CART
Agouti-related protein a-melanocyte stimulating hormone
Galanin Glucagon-like peptide 1
Table 1.2 Neuropeptides that affect feeding behaviours
1.3 Leptin and the Leptin Receptor
1.3.1 Identification and organisation of the ob(leptin) gene
There are at least five strains of mice that show an obese phenotype. The autosomal
recessive, obese strain of mice {ob) identified in the 1950s is associated with obesity
and type II diabetes (Ingalls et al., 1950) (see figure 1.1).
Parabiosis is a technique that can be used to investigate such phenotypes by employing
surgical techniques to cross-circulate blood between mutant and wild type mice. This
procedure demonstrated a deficiency in a blood-bome factor that regulated food intake
and metabolism by virtue of the fact that cross-circulation ameliorated the ob mouse
phenotype (Coleman et al., 1978). However, the blood-bome factor was not actually
identified until 1994, when a positional cloning approach to locate and identify the
mouse obese gene was undertaken. To achieve this, a genetic and physical map of the
region was obtained followed by isolation of the gene and detection of the causative
mutation (Zhang et al., 1994). For the positional cloning, a yeast artificial chromosome
(YAC) contig was generated spanning a region on mouse chromosome 6 known to
contain the gene due to preliminary localisation by RFLP analysis. The Critical region
containing the gene was further refined, and DNA from the critical region cloned into
exon-trapping vectors. Putative exons were screened against corresponding RNA in
northern blotting experiments and one particular exon hybridised to a 4.5kb RNA
species from white adipose tissue only. This transcript was absent in ob/ob mice.
Subsequent isolation of cDNA clones (mouse leptin cDNA sequence is available at
http://www.ncbi.nlm.nih.gov via the GenBank database, accession number
Figure 1.1: Picture of ob mouse compared to wild type mice (Picture from front cover of Nature, volume 372, issue 6505)
which in ob/ob mice contained a C to T base change at codon 105 coding for a premature stop codon. The human genome organisation (HUGO) subsequently named
the mouse gene Lep. They proceeded to hybridise the mouse Lep cDNA to a human adipose tissue cDNA library, isolating homologous clones with 84% amino acid
identity in the ORF between the two species (human leptin cDNA accession number
NM000230). Leptin protein delivered intraperitoneally to ob/ob mice reduced feeding and body weight (Weigle et al., 1995), proving that the gene caused the ob phenotype. Following the breakthrough of locating the gene, He and colleagues (1995) determined
its genomic organisation and promoter activity. The gene comprised a maximum of 4
exons (a minority of the Lep mRNA accommodated an extra untranslated exon) with the coding sequence present in exons 2 and 3 (see figure 1.2). Using successive
deletion mutants of the promoter sequence (cloned into a luciferase reporter vector to
analyse changes in promoter activity), the 762-bp promoter was shown to have a
minimal promoter region of 161bp. The minimal promoter contained Spl and
CCAAT/enhancer-binding protein (C/EBP) motifs.
The human homologue (named by HUGO as LEP) spanned 20kb, with 3 exons separated by 2 introns (10.6kb and 2.3kb respectively), and the promoter region
contained a TATA box-like sequence and several cis-acting regulatory elements including C/EBP motife but also an AP-2 binding site and GC boxes (Isse et al., 1995). Moreover, Isse and colleagues (1995) assigned the chromosomal position of the
human LEP gene by fluorescence in situ hybridisation using probes specific for the ob gene, these hybridised at position 7q31.3. This agreed with comparative mapping of
mouse chromosome 6, containing the LEP gene, to a syntenic portion on human chromosome 7q that was later refined to position 7q31.3 by genetic mapping (Green
s
g
CD m_(GO ’■£3
fcq a, ^ -gS3
kJ 8 S
I 2
-G CO
CD g
o ^
^ <L>
S3 T 3
.2 £CO O
O S3 VH ••H CO 2
.8 *3
T d 05
O S3 O o
<D 'g
-S3 O
H ^ <j <1
IS
q o“ CLh
C I c3 1/3 <D g
G g
CD CO
C O ^ v
^ 2
G ctf a MO -G+-> U-io G O • *H c3 G O 05 <0 u, S ^
CU =:
J-, -G O T3 •rj d>
* 0
S -§ ^
2 « <n £ -G as
. . T3
<N a> r tsa •*-> 05 G O ts 'ot G c$ Li +-» a> -G H 0 5 a> X o o
uj -a
^ G CO -33
S . 2 (D 05 05
1.3.2 Leptin protein structure
Leptin is a 16-kDa protein expressed and secreted by the adipose tissue. Using X-ray
crystallography, Zhang et al., (1997) determined the structure of the protein (see figure
1.3). For this, they took advantage of an introduced glutamine to tryptophan amino
acid substitution at codori 100 that dramatically improved the ability of the protein to
crystallise whilst still maintaining its biological activity. Cysteine residues at codons 96
and 146 were shown to form a disulphide bond and mutation of either rendered the
protein biologically inactive. This indicates that disulphide formation is important for
structure folding and receptor binding. An overall four-helix bundle structure was
revealed that is shared with members of the long-chain helical cytokine family such as
G-CSF, LIF and IL-6. These structures consist of four antiparallel alpha-helices
arranged in a twisted helical bundle forming a hydrophobic cylindrical core. The
similarity of these ligands and the sequence similarity of their receptors are suggestive
of similar mechanisms of ligand receptor interaction.
1.3.3 Identification and organisation of the leptin receptor gene
Upon discovery of the leptin gene, the tools became available to locate its native
receptor. Tartaglia and colleagues (1995) generated a series of leptin-alkaline
phosphatase (AP) fusion proteins and initiated a binding survey of cell lines and tissues.
Leptin binding sites were located to the mouse choroid plexus. Using this piece of
information, a cDNA expression library was constructed from the tissue, screened with
Figure 1.3: Three dimensional model of the human leptin protein structure containing four anti-parallel alpha helices (red, blue, green and turquoise) which form a barrel structure with a hydrophobic core (Picture derived from Zhang et al., 1997).
(mouse leptin receptor accession number NM146146 and classified as Lepr by
HUGO). By hybridising the mouse cDNA to a human cDNA library, a human
homologue was found (accession number NM002303 and named LEPR by HUGO). It
was syntenically mapped, in relation to the db locus in mice, to chromosome lp.
In an effort to identify the gene responsible for the mouse db/db phenotype (which
exhibits obesity, hyperphagia and insulin insensitivity), Lee and colleagues (1996)
generated refined physical and genetic maps at the db locus.
Furthermore, they utilised exon trapping and cDNA selection from mouse
hypothalamus to identify candidate genes from the db region. Several cDNA clones
contained sequence identical to the extracellular domain LEPR sequence. Some of
these clones varied in their C-terminal sequences beyond the point of the
transmembrane domain suggestive of splice variants coding for varying length
cytoplasmic tails and were designated Ob-Ra to Ob-Re. The study identified that RT-
PCR products from hypothalamic RNA in db/db mice had a longer fragment length of
Ob-Rb whilst sequencing of these products indicated a 106-bp insertion between a
splice donor site at codon 889 and acceptor site at codon 890. A G—»T mutation 108-
bp downstream from codon 890 was shown to result in the creation of a splice donor
site enabling incorporation of the 106-bp sequence. This inserted sequence coded for a
termination codon five amino acids after the splice, junction and so the mutant protein
lacked most of the cytoplasmic region in db/db mice. This indicated a lack of
downstream signalling following leptin binding and provides an explanation for the
obese phenotype seen in db/db mice.
The Zucker (fa) rat is another rodent model of obesity that has a mutation located in
the fa rat phenotype was the same gene responsible for the db mouse by a combination of genetic mapping, and genomic Southern blot analysis of fa and db rodent DNA with a mouse extracellular domain leptin receptor cDNA probe.
The fa rat was subsequently shown to be homozygous for an A to C DNA base missense mutation that introduces a glutamine to proline amino acid substitution at
codon 269 (Philips etal., 1996, White etal., 1997).
In humans, Chung and colleagues (1996) developed a refined genetic map of human
chromosome lp in the region of LEPR by radiation hybrid mapping. Using a panel of individuals from a family, 18 polymorphic markers were genetically mapped to
chromosome lp31 relative to LEPR with the aim of identifying new markers for the analysis of human pedigrees segregating with obesity.
1.3.4 Leptin receptor protein structure
The murine leptin receptor was classified as a single membrane-spanning receptor. A
mature extracellular domain of 816 amino acids (minus a putative 22 amino acid signal
sequence for peptide secretion) was determined from the cDNA sequence followed by
a predicted 23 amino acid transmembrane domain (Tartaglia et al., 1995).
The amino acid sequence is most closely related to the gpl30 signal-transducing
component of the IL-6, receptor with conservation of the characteristic cysteine and
Trp-Ser-X-Trp-Ser motifs (Tartaglia et al., 1995). Sequence comparison places the receptor within the class I cytokine receptor family together with the IL-6 receptor and
growth hormone receptor (GH-R). The extracellular regions of these receptors are
characterised by the presence of multiple domains including the cytokine receptor
(CK), Ca2+binding fold (C2) and fibronectin type III (F3) domains (see figure 1.4).
CK F3
Cell
membrane
IT
U
C2 CK F3
y c k
B F3
i; C2 c
C2V
CK y c kF3
P
F3F3 F3
F3 □ F3
?? ff ff ff f f ff
11 II u u u i i
GH-R IL6-Ra GCSF-R OB-Rb
High-resolution structures for GH-R provide good evidence for a ligand-binding
region within a combined CK-F3 domain (Wells and de Vos, 1996). Although the
crystal structure for the leptin receptor has not been determined, the extracellular
domain contains two repeat CK-F3 domains highlighting potential ligand binding sites.
Using COS-7 cells, Liu et al. (1997) expressed and characterised a soluble human leptin receptor containing the extracellular domain only. Immunoprecipitation of the
receptor revealed a product with a molecular mass of approximately 130-150 kDa,
which is higher than the 92-kDa protein predicted from the coding sequence alone.
This suggests a high level of post-translational modification. Indeed, Haniu et al,
(1998) purified a human leptin receptor from Chinese hamster cells and detected
N-glycosylation approximating 36% of the total protein mass by digesting the receptor
with the enzyme iV-glycanase. Alternatively O-glycosylation, as detected by
O-glycanase treatment was minimal.
In humans and mice, there are several isoforms of the leptin receptor with identical
extracellular domains and varying length intracellular domains. In humans, differentially
spliced transcripts have been observed with one 'long' and three variant isoforms of the
receptor containing the complete extracellular domain and transmembrane domain, but
varying sizes of the intracellular domain (Barr et al., 1999). The different forms of the leptin receptor are termed as ObRa through to ObRe. The longest form (ObRb)
contains a 303 amino acid tail, including two 12 amino acid JAK box domains that are
required for JAK dependent signalling. The three variant isoforms have much shorter
intracellular tails of 34 (ObRa), 44 (ObRc) and 96 (ObRd) amino acids each and only
contain one JAK box domain. The fifth isoform is the soluble isoform, which is the
extracellular domain alone (Lee et al., 1996). Unlike mice, humans do not have mRNA coding for the soluble form, instead it is generated by proteolytic cleavage of
membrane-anchored leptin receptors by a metalloprotease (Maamra et al., 2001). It is the only isoform, which is present systemically. In the blood it is able to bind to leptin
and may play a role in modulating receptor signalling by competing for ligand binding
and it may also reduce leptin degradation and clearance in serum (Huang et al., 2001). It has been stoichometrically demonstrated that leptin binds to its receptor in a 2:2
ratio (Devos et al, 1997), i.e. two leptin molecules bind to two receptor molecules. This suggests a similar binding mode to that of granulocyte-colony stimulating factor
(G-CSF) with its receptor (also a member of the class 1 cytokine receptor family).
Hiroike and colleagues (2000) used the tertiary structure of G-CSF to build a
computer model of the complexed leptin: leptin receptor structure in order to
determine aspects of ligand binding. The model demonstrated a major and minor
interface for both 1:1 leptin: leptin receptor complexes. The model also showed that
site-directed mutations incorporated into the leptin protein (Verploegen et al., 1997, Imagawa et al., 1998, Boganet et al., 1998) which were present within these interfaces led to reduced binding activity. These experimental and modelling results could
therefore contribute to a rational drug design.
1.3.5 Leptin receptor signalling
Belonging to the class I cytokine receptor family, the leptin receptor lacks intrinsic
tyrosine kinase activity. As such, it requires the recruitment and activation of receptor-
associated kinases to initiate signal transduction pathways by phosphorylating tyrosine
residues present in the receptors' cytoplasmic domain. Of the several isoforms, the
long and short membrane-bound forms are the most predominant in tissues and are
conserved between humans and mice, with the long form but not the short form having
signalling, ligand binding to the extracellular domain is necessary. Yet it is interesting
to note that several papers (Devos et al, 1997, White et al, 1999) indicate a ligand-
independent ability of the receptors to homo-oligomerise. Specifically, White and
colleagues demonstrated that pre-formed leptin receptor complexes were formed
following receptor immunoprecipitation from human embryonic kidney (HEK) 293
cells transfected with vectors encoding the long form of the protein. Ligand treatment
of these cells minimally altered levels of oligomerisation. This would suggest that
ligand binding is not essential for receptor oligomerisation but would presumably be
required for alteration of signalling capacity. More recently, Couturier and colleagues
(2003) used bioluminescence resonance energy transfer techniques to show that leptin
receptors exist as constitutive dimers but that leptin induces conformational changes in
the pre-existing receptor dimers.
A signalling pathway that the leptin receptor is able to activate is the JAK/STAT
pathway. Leptin binding leads to a conformational change in the intracellular domain of
the receptor enabling juxtaposition of JAK proteins, which phosphoiylate each other
and specific tyrosine residues of the receptor. Then, signal transducer and activator of
transcription proteins (STATs) interact with the phosphoiylated residues, are
activated, forming hetero- or homodimers and translocate to the nucleus where they
modulate transcription of target genes including c-fos and c-jun.
Both the fa/fa rat and db/db mouse have mutations that affect JAK/STAT signalling
and analysis of these models stimulated investigation of the pathways involved. The
mutation in db/db mice dramatically reduces expression of the long form of the
receptor. Using electrophoretic mobility shift assays (EMSA), in which STAT proteins
bind to specific DNA sites and exhibit reduced mobility on PAGE gels, Ghilardi and
colleagues (1996) showed that STAT 3, 5 and 6 were activated in normal mice but
not in the case of db/db mice.
Expression vectors containing the leptin receptor with the fa point mutation in the extracellular domain, were able to constitutively activate transcription via STAT 1 and
3 independently of ligand binding (White et al, 1997). STAT5B was not, however, constitutively activated and ligand-induced STAT5B activation was greatly reduced
compared to the wild type receptor. Taken as a whole, these results suggested that the
mutation induces a conformational change that partially mimics the ligand-bound state,
enabling ligand-independent activation of ST ATI and 3 but not STAT5B.
The long form of the receptor contains the largest number of sequence elements that
recruit JAKs. Having two conserved box motifs (which specifically recruit JAK
proteins) compared to only one for the other isoforms (Baumann et al, 1996, Ghilardi
etal., 1997).
Using site-directed and deletion mutagenesis strategies towards different isoforms of
the murine leptin receptor, both Kloek and colleagues (2002) and Bahrenberg and
colleagues (2002) reported that loss of the box 1 domain and immediate surrounding
residues terminated JAK2 phosphorylation. Although the shorter forms of the receptor
contain the box 1 domain, they lack these critical surrounding residues and fail to
signal via the JAK2 kinase family.
In vitro studies have shown that activated JAKs, phosphorylate tyrosine residue -1138 on the long form of the murine receptor enabling recruitment of STAT3, and tyrosine
residue 985 which recruits the SH2 domain containing protein, SHP-2 (Li et al,
1999). Banks et al (2000) presented data suggesting that SHP-2 controls activation of extracellular factor-regulated kinases (ERKs), a set of serine/threonine kinases
to measure this relied upon detection of phosphorylated proteins, in this instance from
the ERK pathway, whilst specific accumulation of mRNA transcribed from the c-fos
gene was detected as well. Interestingly, in the same study mRNA accumulation of
suppressor of cytokine signalling 3 (SOCS3) mRNA was detected after STAT3
activation suggesting that at least one function of STAT3 activation is to inhibit
signalling by increasing levels of SOCS3. SOCS proteins have been shown to inhibit
cytokine signalling. They contain a central SH2 domain that may inhibit signalling by
binding to phosphorylated JAK proteins and/or by occupying phosphorylated residues
on the receptor and indeed SOCS3 is recruited by the tyrosine residue at position 985
(Banks etal., 2000, Bjorbaek etal., 2000).
In vivo and in vitro studies in mice have shown that following leptin treatment, the tyrosine phosphatase, protein tyrosine phosphatase IB (PTP1B) attenuates signalling
by dephosphorylating JAK2. This subsequently blocks STAT3 phosphorylation and
STAT3 induction of gene transcription (Cheng et al, 2002, Kaszubska et al, 2002, Zabolotny et al, 2002). By reducing the expression of genes that are up regulated by leptin indicates that PTP1B negatively regulates leptin signalling. Inhibitors of PTP1B
may therefore reduce leptin resistance, making it a potential target for drug therapies
against obesity.
Chinese hamster ovary (CHO) cell lines expressing the short or long form of the rat
leptin receptor were shown to have enhanced levels of tyrosine phosphorylation of
STAT3, in long form expressing cells only, and mitogen-activated protein kinase
(MAPK), in long and short form expressing cells. The data suggests that the short
form is actually able to transmit signals via the MAPK pathway (Yamashita et al,
1998). MAPKs are known to be stimulated by several growth factors and in turn
phosphorylate many transcription factors and cytoplasmic proteins involved in a
number of cell functions.
The involvement of leptin signalling in biological processes other than weight
regulation has become apparent. Recent studies in mice by Bates and colleagues
(2003) demonstrated that substitution of an intracellular tyrosine residue, which is
required for STAT3 signalling led to targeted disruption of STAT3 signalling in the
long form of the receptor. The mice were obese but fertility was maintained. This
result provided evidence for different biological effects resulting from different
signalling pathways.
Such insights into the regulation and types of leptin receptor signalling will
undoubtedly be explored further as studies continue and could highlight any potential
dysregulation involved in various conditions (see figure 1.5 for overview of leptin
receptor signalling).
1.3.6 Leptin and leptin receptor levels in humans
Leptin is expressed and secreted by adipocytes into the blood stream A circadian
rhythm (Sinha et al, 1996) for leptin has been observed with circulating levels peaking
at midnight and the early hours that could help to suppress appetite during the night.
Gender is another factor which affects leptin levels, with women having higher levels
for a given fat mass compared to men (Schwartz et al., 1996). This difference is likely
to be influenced by sex hormone variation between the sexes and indeed a reduction in
leptin levels is observed after the menopause (Rosenbaum et al, 1996) possibly
reflecting the reduction of female sex hormones. Gender specific differences in leptin
mRNA expression have also been observed, with females having a higher ratio of
Lept
in receptor long form
plasma
membrane
PTPBlJ limits
Box 1 signalling
JAK2
Box 2
ERK STAT
activation SHP-2
Tyr 985
>C STAT3
Tyr 1138
c-fos
socs
negative feedback
nucleus
Figure 1.5: Schematic representation of model of signalling for the long form of the leptin receptor containing the two conserved box motifs required for interaction with JAK2. Upon ligand stimulation, JAK2 phosphorylates tyrosine residues on the receptor. These residues recruit STAT 3, which is tyrosine phosphorylated by JAK2, whereupon it translocates to the nucleus to mediate transcription of socs3, c-jun and other genes. SOCS3 protein ultimately feeds back by inhibiting JAK2 and binding to the
phosphorylated tyrosine residue at position 985.
Leptin levels increase proportionally with increasing BMI and percentage body fat
(Considine et al, 1996). Basal levels of leptin are markedly increased in obese individuals. This state of 'leptin resistance' is characteristic of obesity and suggestive of
a lack of signalling response despite the high levels of leptin. Brain perfusion studies in
mice have established that leptin transport into the brain is a saturable mechanism
(Banks et al., 2000, Maness et al, 2000). At high serum leptin levels, saturation of the transport mechanism may impart a rate limiting effect which may limit the cytokines
satiety effects in the brain contributing to leptin resistance (Banks, 2003).
Soluble leptin receptor levels, as detected by enzyme linked immunosorbent assay
(ELISA), are inversely correlated with percentage body fat (Ogier et al, 2002, Van Dielen et al, 2002) with soluble receptor levels being lower in obese and over-weight individuals. Individuals in Ogier’s study undertook a three-month low calorie diet and
an increase of soluble receptor levels with concurrent loss of fat mass were detected.
One possible explanation of these results that requires investigation is that higher
circulating levels of leptin down-regulate soluble leptin receptor release whilst high
receptor levels may enhance leptin action in lean subjects.
Interestingly, in the same study an increased soluble receptor level was seen in men
when compared to women, but not only in the obese state. On the other hand, Quinton
et al (1999) noticed no sex difference in leptin binding activity as determined by a radioactive leptin-binding assay of serum samples from a sample in which a range of
BMI was represented. It is possible that the combination of lean and overweight
individuals in this study design may explain the discrepancy with the results obtained by
1.3.7 Other activities of the leptin system
Leptin has been shown to be expressed from a range of tissues other than adipose
tissue. These include the stomach (Breidert et al, 1999), skeletal muscle (Wang et al,
1998) and umbilical cord (Akerman et al, 2002). As a result, research has opened up into the peripheral activities of leptin distinct from its role in the central regulation of
appetite.
1.3.8 Reproduction
A major focus area of research aside from weight regulation is the involvement of
leptin in reproductive function. An indication of this comes from the observation that
leptin deficient ob/ob mice are infertile. Administration of exogenous leptin to the hypothalamus, causes maturation of the reproductive system and restoration of fertility
(Weigle et al, 1996). In humans, expression of leptin and the leptin receptor has been detected in the ovaries (Loffler et al, 2001) and placenta (Hauguel-de Mouzon, 2003). It is suggested that leptin’s ability to regulate the female’s level of adiposity is
important within the context of attaining long-term energy stores which are essential
for reproduction. The availability of nutrients for fetal growth and development require
substantial energy stores and indeed women who have BMI levels below a certain level
will tend to be infertile. Furthermore, the onset of puberty is linked to fat storage, with
pioneering studies by Kennedy and Mitra (1969) proposing that signals from fat were
responsible for hypothalamic regulation of ovarian activity. In the ob mouse model, progression to puberty was rescued by administration of exogenous leptin. In humans
with mutations in the leptin and leptin receptor, failure to progress through puberty
was also observed (Strobel et al., 1998, Clement et al., 1998). Quinton and colleagues (1999) determined that leptin binding activity in serum was high in pre-pubertal years
in both boys and girls and fell during puberty. They postulated that the fall in leptin
binding activity reflected a reduction in soluble leptin receptor (which is able to bind to
leptin in the circulation) enabling more leptin to be available to the full-length leptin
receptor causing the biological signal of leptin to be transmitted.
1.3.9 Leptin and the cytokine network
As has been demonstrated with many cytokines, leptin is able to interact within the
cytokine network in several different situations in an overlapping and complementary
manner.
For example, Santos-Alvarez et al (1999) reported that by increasing production of
the cytokines, IL-2 and interferon gamma (IFN-y), leptin enhances the activation and
proliferation of circulating T lymphocytes in humans. Considering that the db/db
mouse has reduced levels of T and B lymphocytes (Bennett et al, 1996), these results
suggest that by regulating other cytokines, leptin could have an important role in
lymphopoiesis and is necessary for the proinflammatory immune response.
Another piece of evidence suggestive of a role for leptin in the immune response was
recognised when administration of the endotoxin, lipopolysaccharide (LPS) in hamsters
up- regulated leptin gene expression in adipose tissue and protein serum levels
(Grunfeld et al, 1996). These compounds can potently induce cytokine production in
vivo, with leptin induction apparently mediated via release of IL-1 and TNF-a. (Sarraf
et al., 1997). Indeed, LPS fails to increase leptin levels in IL-lp knockout mice
(Faggioni et al, 1998) whilst ob mice exhibit attenuated levels of serum TNF-a and
The results of these studies suggest that leptin could interact with other cytokines to
modulate responses to infection and inflammation which are associated with reduced
food intake and weight loss.
Further evidence of the specific interaction of leptin with IL-1 has been seen in rats,
Luheshi and colleagues (1999) observed that injecting leptin into the brains of normal
rats increased IL-lp levels in the hypothalamus and, the central injection of IL-1
receptor antagonist (IL-lra) inhibited the satiety action of leptin.
Leptin has been shown to induce the secretion of IL-lra in human monocytes (Gabay
et al, 2001). Recently, the molecular mechanism of activation of the IL-lra promoter
via the long form of the leptin receptor was discovered (Dreyer et al, 2003). It
involves signalling through a MAPK pathway with binding of p42/44 MAPK protein
and an uncharacterised complex of transcription factors to a nuclear factor kB/PU. 1
site in the IL-lra promoter region Considering that MAPK pathways are usually
proinflammatory, an overall inflammatory action of leptin has been postulated which is
in keeping with the clinical observation of local inflammatory reactions after
subcutaneous administration of leptin in humans (Heymsfield et al, 1999).
1.4 Genet
ic Concepts and Methods
Although the genetic material is very alike in humans, throughout the human genome
there are numerous variations at specific positions between individuals.
These sites of variation, or polymorphisms, are present in duplicate because the human
genome is comprised of pairs of matched chromosomes. Each copy (allele) is inherited
from an individual's parents and passed on to their offspring.
As a generalisation, DNA variants present in >1% of the population are termed
polymorphisms. A particularly deleterious DNA variation is usually present in less than
1% of the population. However, as common polymorphisms can contribute to disease,
the delineation between the two is becoming less clear. Genetic studies of diseases
such as obesity/anorexia involve the analysis of such DNA variations, used as genetic
markers.
1.4.1 Single Nucleotide Polymorphisms (SNPs): a type of genetic variation
SNPs are the most common form of DNA variation in the human genome occurring on
average once every 0.3-1 kilobase of DNA (Schork etal., 2000).
This form of DNA variation involves variation in a single base. Substitutions can occur
within coding DNA sequence and, as such, may result in a substitution of one amino
acid for another. If this is the case, the substitution may be conservative, whereby one
amino acid is substituted for another amino acid with similar charge and size
properties. Alternatively, a non-conservative change may take place involving the
incorporation of an amino acid with different properties which may alter the protein’s
conformation and, perhaps, activity. A nonsense SNP substitution will code for one of
the three stop codons resulting in the formation of a truncated protein. A 'silent' change
may also occur whereby the substitution maintains the same amino acid. SNPs that are
present in the third base of a triplet codon are an example of a silent polymorphism as
any one amino acid can be coded for by different triplet codons, each one varying in
the third base only. This degeneracy of the genetic code was described by Crick (Crick,
1966). SNPs can reside in non-coding sequences and therefore may have a minimal
expression, such as the promoter sequences, or at splice recognition sites which are
required for correct splicing of RNA transcription products.
The base change at any one SNP may generate or abolish a restriction site for a class II
endonuclease enzyme. If so, then DNA amplified over this region can be conveniently
digested using the appropriate enzyme, the products subjected to electrophoresis and
individuals typed for the particular SNP. Recent advances in technology, including
real-time PCR and denaturing high performance liquid chromatography have increased
automation and sample throughput. The high frequency of SNPs, rapid screening
characteristics and the potential to have a functional effect on gene expression or on
the protein itself, makes SNPs desirable to study. This is because there are enough of
them in and around genes to represent candidate polymorphisms (individually or in
unison) some of which may influence a disease/disease trait. Such advantages coupled
with the ease of typing for the SNP in individuals and the relative stability of SNPs
over generations has led to international efforts to generate maps of SNPs spanning the
human genome, one example being the NCBI SNP database
(http://www.ncbi.nlmnih.gov/SNP).
1.4.2 Linkage disequilibrium
A phenomenon observed through studies of genetic variability is that of linkage
disequilibrium In a population, it has been described as the co-occurrence of specific
alleles from more than one marker at a higher frequency than would be predicted by
random chance (Genetics Home Reference database at the U.S. National Library of
Medicine website, http://ghr.nlmnih.g0v/ghr//page/H0me). This may be because the
alleles are physically close so that the chance of being disrupted by recombination at
meiosis is low and they are inherited together over successive generations. These
are inherited together over successive generations. These combinations of alleles are
described as haplotypes, and changes in frequency at one allele may reflect / cause
changes in the others. Therefore, the knowledge of whether a cluster of SNPs is in
linkage disequilibrium is beneficial for two reasons, firstly, as analysis of any one SNP
may represent the functional effects of a neighbouring SNP or secondly, a combination of
SNPs represented by their alleles in a conserved haplotype may be contributing to a
disease state.
1.4.3 Linkage analysis
Linkage studies have been classically used to analyse the co-segregation of DNA markers
with a particular monogenic disease in family pedigrees. This methodology, in its
simplest form involves studying pairs of affected siblings, but larger multiplex families
are also used.
Unlike this qualitative classification which is based on the presence or absence of a
disease, many diseases can be defined by an underlying quantitative trait, such as
percentage body fat or BMI in obesity. This approach is commonly used when linkage
studies are applied to multifactorial diseases, which may result from the combined effects
of more than one gene and where patterns of hereditary are usually more complex than
those of single-gene disorders. These traits provide a measure of disease severity and the
trait itself may be affected by a smaller number of factors compared to the variety of
genetic and environmental factors that lead to the presence or absence of the disease
itself Such features can enable the quantitative variable to have a stronger correlation
with variants of one particular gene amongst the several genes which contribute to the
contribute to the disorder, improving the identification of causative susceptibility
variants.
1.4.4 Association studies
The comparison of allele and genotype distribution between patients and controls is a
strategy for the detection of disease susceptibility genes. Any observed difference in
frequencies between the two groups may arise from a functional effect of the allele
under investigation. Alternatively, the allele may be in linkage disequilibrium with a
nearby susceptibility locus. The original SNP may therefore be a marker of
susceptibility to a disease without having a causal role.
Such case control studies require careful matching. For example, maintaining the same
ethnicity between cases and controls is important because different ethnic populations
may have different frequencies for a particular allele, which could be mis-construed as
a significant difference in an association study.
The confounding effect of population stratification on association studies is also a
concern. In this scenario, a population is assumed to be homogenous with respect to
allele frequencies for a particular marker but in reality is composed of several
subpopulations each with different allele frequencies. If the subpopulations have
different risks of disease then an association between the candidate gene and disease
may be spuriously assigned.
Another consideration is cohort size as the greater its size, the more statistically
significant the results will be. This may be of importance if the frequency of the variant
allele, which is hypothesised to make individuals susceptible to a disease, is low
(Schork, 2002).
1.4.5 Transmission disequilibrium test
This test detects association in the presence of linkage. It involves a statistical
comparison between candidate susceptibility alleles transmitted or not transmitted to
affected offspring from parents who are heterozygous for the DNA variant being
studied. These studies circumvent the issue of needing to find carefully matched
controls as analysis is based within a family.
1.5 Genetics of Leptin and the Leptin Receptor in Humans
Following the discovery of the leptin and leptin receptor genes and their involvement in
obesity deduced from rodent models, these genes became obvious candidates for the
condition in humans.
In obese humans, very few mutations have been discovered which affect obesity.
A rare example is described by Montague and colleagues (1997b) who demonstrated
severe early-onset obesity in two children, from a highly consanguineous family of
Pakistani origin, caused by a frameshift mutation at codon 133 in the LEP gene. This
resulted in a mutant truncated leptin protein with an aberrant C-terminus, that was not
secreted normally from cells (Rau et al, 1999).
Another study by Clement and colleagues (1998) uncovered a homozygous mutation at
a splice site, which causes deletion of exon 18 from the mature mRNA, forming a
truncated leptin receptor lacking the transmembrane and intracellular domain. This
results in morbid obesity for the affected individuals from a family of Kabilian origin.
Such null mutations that lead to morbid obesity have rarely been found in humans. This
defect and is probably a complex disorder with a combination of several genes and
environmental factors likely to contribute or predispose to the disorder. Searches for
common polymorphisms within key genes were mounted to determine whether they
make a more modest contribution to regulation of obesity.
Sequencing of the LEP gene reported an A to G substitution in the untranslated exon
one (Hager et al, 1998) and a G to A base change at nucleotide position -2548 in the
promoter region (Mammes etal, 2000).
Location of these SNPs in the LEP gene enabled association studies to be conducted
within normal populations and between obese and normal weight groups (as
determined by obesity indicators such as BMI, percentage fat mass etc). This requires
comparison of allele frequencies and distribution for each poly