Inter-ply stitching optimisation of highly drapeable multi-ply
preforms
S Chen, A Endruweit, L T Harper, N A Warrior
Polymer Composites Group, Division of Materials, Mechanics and Structures, Faculty of Engineering, The University of Nottingham, UK, NG7 2RD
Abstract
An efficient finite element model has been developed in Abaqus/Explicit to solve highly
non-linear fabric forming problems, using a non-orthogonal constitutive relation and membrane
elements to model bi-axial fabrics. 1D cable-spring elements have been defined to model
localised inter-ply stitch-bonds, introduced to facilitate automated handling of multi-ply
preforms. Forming simulation results indicate that stitch placement cannot be optimised
intuitively to avoid forming defects. A genetic algorithm has been developed to optimise the
stitch pattern, minimising shear deformation in multi-ply stitched preforms. The quality of the
shear angle distribution has been assessed using a maximum value criterion (MAXVC) and a
Weibull distribution quantile criterion (WBLQC). Both criteria are suitable for local stitch
optimisation, producing acceptable solutions towards the global optimum. The convergence
rate is higher for MAXVC, while WBLQC is more effective for finding a solution closer to the
global optimum. The derived solutions show that optimised patterns of through-thickness
stitches can improve the formability of multi-ply preforms compared with an unstitched
reference case, as strain re-distribution homogenises the shear angles in each ply.
Keywords
1. Introduction
For medium volume applications, composite components are frequently manufactured
based on preforming of fibrous reinforcement structures, followed by impregnation with a
thermoset resin. The challenge in introducing advanced preforming technologies is
characterising and optimising the forming behaviour of 2D reinforcements in order to
produce repeatable 3D components with acceptable quality, which is related to the level of
shear deformation. In particular, wrinkling and fibre buckling are undesirable in a preformed
reinforcement because of the influence on mechanical properties. Fixation of the fibrous
structure through application of through-thickness stitch-bonds reduces in-mould assembly
time and can aid robotic placement by enabling multi-layer stacks to be processed as one
single preform. Previous research on reinforcement forming has generally addressed the
simulation of components consisting of a single fabric ply [1, 2], or preforms of multiple plies
with identical orientation [3, 4], where the difference in draw-in between plies and inter-ply
friction is not as significant as in heterogeneous multi-ply preforms [5, 6]. However, little work
has been reported on forming of complex stacking patterns or multi-ply preforms containing
localised stitch-bonds. The present work seeks to understand the opportunities offered by
locally stitching multiple plies together to create a single preform blank which can be formed
into a complex 3D shape.
One approach for simulation of multi-ply forming is to use multi-layered finite elements
(FE), where one layer of elements represents multiple fabric layers, for more efficient
simulation [6]. However, this method ignores relative sliding between plies, which is one of
the main forming modes for multi-ply systems. In order to account for sliding, each ply needs
to be modelled independently as a separate element layer. Cheruet et al. [7] modelled
forming of a Z-shaped component consisting of 10 pre-impregnated plies and found that
predicted relative inter-ply sliding agreed well with experimental data. Harrison et al. [8]
conducted forming simulations for two cross plies (0°/90° UD) of thermoplastic prepreg,
that the main in-plane deformation mode was trellising (shear), similar to a woven material.
However, when the fibres are dry, the deformation mechanism changes, and intra-ply sliding
of loosely fixated yarns becomes more important, particularly for multi-ply forming of
non-crimp fabrics (NCF) [9]. Experimental results show that NCFs experience high levels of slip
within each layer of the bi-directional material, as the stitches provide less restraint than
interweaving of warp- and weft-yarns. This phenomenon was captured in simulations by using
bar elements to represent the stitch between UD plies modelled as shell elements. Good
agreement was shown between numerical simulations and experimental results for forming
of a hemisphere, but sliding was limited to the fibre direction, which may be an
oversimplification for more complex geometries.
Investigations into the influence of stitches have been generally limited to studying
intra-ply stitches in NCFs [9] or single woven plies [3], to understand how they can be used to
control local yarn angles. Molnar et al. [4] investigated the influence of inter-ply stitching
experimentally. Local stitch-bonds were found to affect shear deformation in the formed
fabric. It was concluded that it is possible to transfer shear forces into un-sheared regions of
the ply during forming. Through-thickness stitching in multi-ply preforms has been simulated
in explicit finite element analyses using spot weld constraints [3, 10]. Whilst only multi-ply
stacks with identical ply orientations were studied, for certain cases, redistribution of strains
within the fabric through use of stitches was proven feasible to avoid wrinkling. Duhovic et al.
[3] studied the force-displacement relationship for stitches in detail. It was found that stitches
did not restrict the fabric shear behaviour when a strain offset was defined to account for
slack in the thread during tensile loading, and was set to a value obtained from experiments.
Bel et al. [11] investigated the influence of local stitch-bonds on preforming of commercial
components, using beam spring elements to model the stitches in explicit FE studies.
Margossian et al. [12] found that the contribution of stitches to the in-plane mechanical
properties of a ply is almost negligible compared to that of the yarns in the fabric. Assembly
decrease the relative local inter-ply displacement. This effect becomes much more significant
for adjacent plies with different initial fibre orientations, since the relative inter-ply
displacement is greater under these circumstances. Since their in-plane influence can be
ignored, each through-thickness stitch can be considered in isolation (in-plane stitch path can
be overlooked).
Shear deformation in the fabric plies caused by the introduction of stitch bonds may
negatively affect the properties of the finished component. A mathematical algorithm is
required to determine optimised stitching patterns, to minimise local fabric shear. While
there is no published work on the optimisation of inter-ply stitching, several suitable
approaches have been identified from other optimisation problems. For optimisation based
on large numbers of non-linear FE analyses, the enumeration approach is unsuitable, as the
total computation time is unfeasibly long. Also, gradient/sensitivity-based search methods are
inapplicable due to the lack of explicit relationships between the stitching patterns and the
shear angle distribution. On the other hand, heuristic algorithms are an effective way to solve
problems with large numbers of variables, and consequently genetic algorithms (GAs) have
been chosen for this work.
This paper presents a finite element model developed to study the effect of local
stitch-bonds in multi-ply preforms, particularly those with multiple ply orientations. Results from a
numerical study of a simple hemisphere geometry demonstrate the capability of simulating
the forming behaviour of a multi-ply stack in a single operation. A genetic algorithm has been
developed to determine the optimum position of local stitches, in order to improve preform
quality and ultimately facilitate automated component manufacture. Two different criteria
have been implemented to assess the forming outcome; the maximum value criterion
(MAXVC) and the Weibull distribution quantile criterion (WBLQC). The convergence rates and
optimum solutions for both criteria have been compared to understand the compromise
2. Modelling approach
2.1 Material model for non-orthogonal bi-axial materials
The proposed material model captures the dominant factors in fabric forming, including
in-plane shear, fibre elongation and inter-tow/intra-ply slipping. A macro-scale
homogenisation scheme has been adopted to avoid modelling discrete tows. The effects of
parameters associated with the fibre architecture (yarn spacing, cross-sectional shape, crimp
etc.) are captured in the in-plane shear behaviour, which is defined by a non-linear
stress-strain curve with a progressive hardening step. A hypo-elastic model [5, 13] has been adopted
to capture both material and geometric non-linearity due to large displacements and large
rotations of the yarns [5, 13, 14]. Elastic models are typically used for forming simulations for
simplicity, even though the fabric response during deformation is not necessarily elastic.
However, deformation is arrested when the forming process is complete in order to conform
to permanent deformation [15].
2.1.1 Implementation of material model
The material model is implemented in a user-defined subroutine in Abaqus/Explicit. A
non-orthogonal fibre coordinate system, where the axes coincide with the current
orientations of yarns at any material point, has been used. The non-orthogonal constitutive
relation captures anisotropic behaviour of biaxial composite materials under large shear
deformation more accurately than an orthogonal model [16, 17]. A VFABRIC subroutine has
been developed to define the mechanical constitutive relations of woven fabrics. The
VFABRIC routine is valid for materials that exhibit two structural directions, which may not
remain orthogonal following deformation.
The non-orthogonal material model is summarised in Fig. 1. The in-plane engineering
strains at the beginning of each time increment in the explicit time integration scheme (ߝௗభ ,
ߝௗమ ,ߛௗభమi.e.[ߝ]ௗభమ) and the corresponding strain increments (݀ߝభ,,݀ߝమ,݀ߛଵଶi.e.[݀ߝ]భమ)
non-orthogonal fibre coordinate system. For each fibre direction in the non-non-orthogonal system,
material properties ([C]௧భ ,[C]௧మ ) are defined in an orthogonal system, where one base
vector is parallel to the fibre direction. For the fabric forming process, the shear deformation
can be large, and the two yarn orientations may no longer be perpendicular to each other
during forming. Material properties are transformed into the non-orthogonal fibre coordinate
system ([C]ି௧భమ ) using the current coordinate transformation matrix,[Q]. Finally, the
initial stress tensor ([ߪ]ௗభమ) can be updated to be[ߪ] భమ
௪ by superimposing it with the stress
increment tensor ([݀]భమ), which is calculated from the current constitutive matrix in the
non-orthogonal fibre coordinate system. This is subsequently returned to Abaqus/Explicit for
further processing.
Although material properties along the fibre directions (such asEଵଵ) can be applied directly in
VFABRIC, other properties (such asEଵଶ) need to be transformed into the non-orthogonal fibre
coordinate system (i.e. the system defined by the warp-fibre vectorfଵ, the weft-fibre vectorfଶ
and the out-of-plane vectorfଷ) using the current coordinate transformation matrix. Only very
minor modifications are required in VFABRIC to establish a non-orthogonal constitutive matrix
compared with the more generalised VUMAT approach in Abaqus/Explicit. Implementing a
VFABRIC routine therefore reduces the number of tensor operations and results in a more
computationally efficient model.
2.1.2 Material model validation
Numerical tests have been performed to verify that the constitutive relation used in
the current VFABRIC subroutine is correct for bi-axial fabrics, using experimental and
numerical data from the International Forming Benchmark study [18]. The choice of material
parameters is consistent with published data [5, 13, 19, 20] for a balanced plain weave
constant (35.4 GPa) in each fibre direction, ignoring any initial non-linearity in the
stress-strain curve due to fibre crimp. Including the influence of fibre crimp in the material model
was found to have an insignificant effect on the forming behaviour of a woven glass fabric in
hemisphere forming simulations by Boisse et al [1]. The shear modulus was described by the
polynomial:
ܩଵଶ= (6.7135|ߛଵଶ|ସ−9.8228|ߛଵଶ|ଷ+ 6.3822|ߛଵଶ|ଶ−1.5928|ߛଵଶ|
+ 0.1948) MPa Eqn. 1
whereߛଵଶis the in-plane shear angle in radians.
Each ply was discretised into 4096 square membrane elements (Abaqus/Explicit
element type M3D4R). All parts of the tooling were considered to be rigid bodies. A penalty
contact algorithm was used to define the behaviour at all interfaces. An isotropic Coulomb
friction model was adopted for both the tooling-material and material-material contacts with
a constant coefficient of 0.2. Displacement boundary conditions were applied to the punch
and a force of 100 N was applied to the blank holder to control blank slippage. Two material
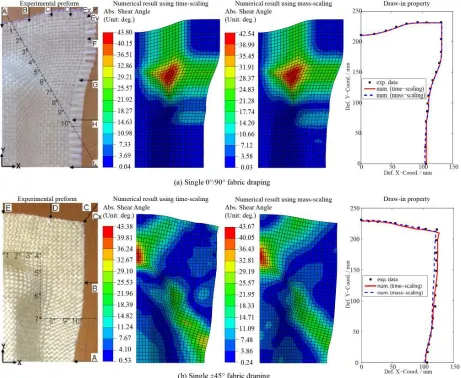
configurations were studied during the validation stage; forming of a single 0°/90° ply and a
single ±45° ply.
The run time of the model is important for successful implementation of the stich
optimisation, as large numbers of iterations need to be run to determine the optimum
pattern. Both mass scaling (MS) and time scaling (TS) have been evaluated in this study to
reduce CPU time. Fig. 2 indicates that there is a very strong correlation between experimental
forming results from the literature [5, 13, 20, 21] and numerical forming results based on the
VFABRIC model developed here, and that TS or MS do not compromise the validity of the
simulation results. Both shear angle distribution and material draw-in are very closely
matched when adopting MS or TS. The local shear angle has been checked at 10 discrete
Table 1) and compared quantitatively against experimental data [5, 13]. The peak
shear angles differ by about 3 % (1.26°) between the MS and TS models.
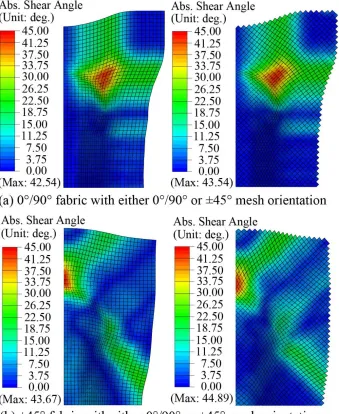
The element edges in the mesh for each ply are aligned with the geometry axes, rather
than with the fibre orientations, which facilitates definition and implementation of inter-ply
stitches in the numerical model. A sensitivity analysis has been performed to assess the
potential issue of finite element shear locking for cases where the material directions are not
aligned with the element edges, which is discussed in the literature [22, 23]. Simulation
results for local shear angle distributions in 0°/90° and±45° fabric plies at different mesh
orientations are plotted in Fig. 3. The shear angle distributions for the 0°/90° ply appear to be
insensitive to the mesh orientation, with maximum shear angles of 42.54° (aligned) vs 43.54°
(misaligned) respectively. For the ±45° ply, differences in local shear angle distributions for
different mesh alignment are more significant than for the 0°/90° case, but the difference
between maximum shear angles, 44.89° (aligned) and 43.67° (misaligned), is still small. Since
global ply deformation patterns appear to be unaffected, and hence no significant effect on
the outcome of the stitch optimisation is anticipated, a slight reduction in accuracy of results
for plies with misalignment between material orientations and mesh orientations is
considered acceptable here.
2.2 Inter-ply stitch model
Assembly stitches have been modelled as inter-ply connections by constraining
coincident nodes using a user-defined 1D cable-spring element in Abaqus/Explicit, as shown
in Fig. 4. Both ends of each stitch element have unconstrained rotational degrees of freedom,
and the compression modulus is set to zero, hence providing tensile stiffness only. A degree
of ‘slack’ is built into the model by enabling the stitch elements to extend under zero tensile
load (see Fig. 5). The behaviour of the stitch is defined by the tensile stiffness along the axial
between the fabric plies, since the spring element represents a constraint of nodal mobility
without physical surface properties.
The stitch constrains nodal displacement, as shown in Fig. 4. The magnitude of the
reaction force is equal to the axial stitch force. For an arbitrary inter-ply stitch element
connecting nodes݅and݆, the relative displacement∆݈can be calculated as
∆݈= ห݈⃗୧ᇲ୨ᇲห−ห݈⃗ห Eqn. 2
݈⃗ᇲᇲ= ݈⃗ᇲ−݈⃗ᇲ= (ݔᇲ,ݕᇲ,ݖᇲ)−(ݔᇲ,ݕᇲ,ݖᇲ) Eqn. 3
݈⃗= ݈⃗−݈⃗= (ݔ,ݕ,ݖ)−(ݔ,ݕ,ݖ) Eqn. 4
where(ݔ,ݕ,ݖ)and(ݔ,ݕ,ݖ)are the initial nodal positions of a stitch element, while (ݔᇲ,ݕᇲ,ݖᇲ)and(ݔᇲ,ݕᇲ,ݖᇲ)are the current nodal positions of the same stitch element. All
of these coordinates are calculated by Abaqus/Explicit at each time increment.
As shown in Fig. 5, the axial stiffness of a stitch (i.e.݇௦௧) is defined as
݇௦௧=ቊ0 , ∆݈≤ ∆݈
݇௧௦௧ , ∆݈>∆݈ Eqn. 5
where the superscript “st” denotes properties associated with the stitch element,∆݈is the
critical relative displacement to identify whether the stitch element is slack or stretched, and
݇௧௦௧ is the tensile stiffness along the axial direction. These parameters can be obtained from
material testing [3]. Values of݇௧௦௧ = 32.55 kN/mand∆݈= 0.57 mm[3] have been used
throughout this study.
Hence, the axial force for each stitch element (i.e.ܨ௦௧) can be calculated as
ܨ௦௧=݇௦௧∙ ∆݈ Eqn. 6
The stitch force is updated in each time increment by invoking the above 1D user-defined
stitch element.
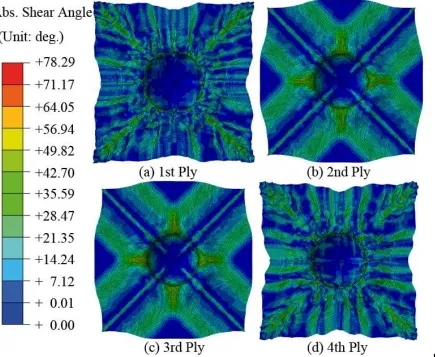
An example of a stitched preform stack is shown in Fig. 6 for a hemisphere geometry.
in a [(0°/90°) / ±45°]sconfiguration. The hemisphere has a diameter of 100 mm, and the
formed height is 50 mm. Stitch bonds have been applied at every node along the two
diagonals from corner to corner.
The numerically calculated maximum shear angle for this case (78.29°) is significantly
higher than the values for the example in Fig. 2, resulting in visible wrinkles on the formed
hemispherical surface. This maximum shear angle exceeds the shear locking angle of the
fabric (approximately 45° [19]). Unrealistically high values like this can occur as a consequence
of the polynomial fit to the high shear modulus region of the experimental shear data [17].
The stitch paths go through the centre of the highest sheared regions in the 0°/90° plies,
which results in the shear deformation being distributed more globally than in the unstitched
case, since the mobility of the fibres along the diagonals is restricted. This can be seen clearly
in Fig. 7, which shows the local shear angles plotted along a diagonal path from the centre of
the hemisphere to the top-right hand corner. Large deformations in the ±45° plies occur due
to them being directly coupled to the 0°/90° plies. These results highlight the consequence of
choosing a poor stitch pattern and emphasise the importance of developing a stitch
optimisation routine to reduce excessive shear deformation.
3. Methodology of stitching optimisation
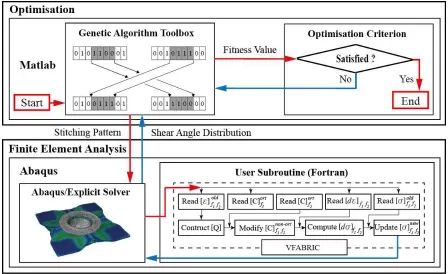
The stitching optimisation is implemented using Matlab, as shown in Fig. 8. For each loop
or “generation” in the GA, a group of stitching patterns called “individuals” is generated, and
Abaqus/Explicit input files are produced. Abaqus/Explicit simulations are employed to
determine the shear angle distribution for each individual, which is then returned to Matlab.
For the returned shear angle data, the corresponding fitness value is determined individually
3.1 Implementation of genetic algorithm
A binary encoding method is applied to formulate each individual stitching pattern for
the optimisation algorithm. Each stitching pattern represents a binomial-status series, which
can be described numerically by the encoding scheme in Fig. 9. Each bit in the binary code
represents one potential stitching position and its value corresponds to a “stitched” or
“unstitched” status. By using this encoding scheme, the physical problem can be converted
into a mathematical problem to perform a series of GA manipulations to heuristically search
for the optimum stitch pattern.
The stitching optimisation problem can be written as:
Minimise: ݂{ଵ,ଶ,⋯,; γଵଶ(ݔ,ݕ,ݖ)} Eqn. 7
subject to: =൜1 , stitched0 , unstitched (݅= 1,2,⋯,݊) Eqn. 8
γଵଶ(ݔ,ݕ,ݖ)∈[0°, 90°] Eqn. 9
(ݔ,ݕ,ݖ) ∈ Ωெ Eqn. 10
where,݂{∙}is the fitness function of the stitching optimisation in GA to describe the selection
criterion, which is employed to assess the distribution of shear angles in the material field. (݅= 1,2, ⋯ ,݊)is theithoptimisation variable, which denotes the stitching status at theith
potential stitching position.݊is the total number of potential stitching positions.
3.2 Fitness function
The fitness function is used to assess how well each individual stitch pattern is adapted
to the assessment criteria. Its value reflects the relative distance from the optimum solution,
where a smaller value is preferential. During stitching optimisation, the aim is to optimise the
shear angle distribution in the spatial material field. However, the shear angle is a field
variable which it is too difficult to optimise directly. Hence, an appropriate fitness function is
Appropriate selection of the fitness function is important, as it dominates the convergence
rate of optimisation and the accuracy of the optimum solution.
At the material level, characterisation of in-plane shear is assessed by measuring the
non-linear mechanical response of the material during shear loading. A limit is often imposed
on the level of deformation, in the form of a “locking angle” [2], which is the point at which
tows are no longer able to rotate freely. The locking angle represents the maximum level of
shear deformation that can be achieved before material wrinkling/buckling occurs, which is
undesirable in a preformed reinforcement because of the influence on mechanical properties
[19]. The objective is therefore to keep all local shear angles below the locking angle. Since
the value of shear angle is limited by
|γଵଶ(x, y, z)|∈0, max(୶,୷,)∈ஐ
{|γଵଶ(x, y, z)|}൨ Eqn. 11
the optimisation objective can be reduced to minimise the maximum shear angle, referred to
in this work as the maximum value criterion (MAXVC). The maximum can be derived from the
finite element approximation for|γଵଶ(x, y, z)|. Thus,
݂ெ {ଵ,ଶ,⋯,; γଵଶ(ݔ,ݕ,ݖ)} = max(௫,௬,௭)∈ஐ
ಾ{|γଵଶ(ݔ,ݕ,ݖ)|}≈୧ୀଵmax,ଶ,⋯,{γ୧} Eqn. 12 where݂ெ {∙}denotes the fitness function using MAXVC;Ωெ is the spatial material region; γଵଶ(ݔ,ݕ,ݖ)is the continuous shear angle distribution in the material regionΩெ;ܰis the total number of material points; |∙|is the absolute value of the variable;γ୧= |γଵଶ(ݔ,ݕ,ݖ)|is the
absolute value of the shear angle at theithmaterial point(ݔ
,ݕ,ݖ). Since the stitching
pattern determines the obtained shear angle distribution, the value of݂ெ is used for
quantitative assessment of the fitness of the corresponding stitching pattern.
Although MAXVC is suitable for assessing the behaviour for most conditions, it can be
somewhat conservative for achieving fast convergence. Additionally, the maximum shear
angle only represents an upper bound and may not be representative of the overall
distribution, resulting in an unfavourable stitch placement decision. For example, it may not
shear angles, as these may be classed as outliers, and consequently the global shear angle
distribution will be unaffected by the optimisation procedure [24]. Hence, a more global
criterion is employed to summarise the shear angle data and a corresponding statistical
criterion is proposed to assess the fitness of the stitching pattern. Since Extreme Value Theory
suggests that the Weibull distribution is suitable for modelling mechanical failure phenomena
[25, 26], a two-parameter Weibull distribution is analogously employed here to characterise
the stochastic behaviour of the shear angle distribution. The cumulative distribution function
(CDF),ܨ(ߛ;ߟ,ߚ), is expressed as
ܨ(ߛ;ߟ,ߚ) = 1−݁ିቀఊఎቁ
ഁ
,ߛ∈[0, +∞) Eqn. 13
whereߟ(ߟ> 0) is the scale parameter andߚ(ߚ> 0) is the shape parameter for the
two-parameter Weibull distribution. Thus, their corresponding estimators,ߟƸandߚመ, can be
determined by combining the following two equations obtained from the maximum likelihood
method
ߟ̂ = ൬1
ܰ൰ ߛఉ ே ୀଵ ൩ ଵ ఉ Eqn. 14
ߚመ= 1 ܰ
ߚመ∙ ∑ୀଵே ቀߛఉ∙lnߛቁ− ∑ேୀଵ(lnߛ) Eqn. 15
whereߟƸ> 0andߚመ> 0. The unknown parametersߟƸandߚመare calculated by solving Eqn. 14
and Eqn. 15 numerically; based onߛଵ,ߛଶ, ⋯ ,ߛே, which are obtained from finite element
analysis. Ifγଵିఈis the upperαquantile of the distribution, i.e. the probability to find a shear
angle with a value greater thanγଵିఈisα, then
F(ߛଵି) = 1− α= 1−݁ି൬ఊభషಉఎෝ ൰
ഁ
Eqn. 16
is the probability to find a shear angle smaller thanߛଵି. Whenαhas a small enough value
solved for ߛଵି. This is considered to be the extreme value (i.e. the maximum shear angle)
with a probability of(1 − α)[25].
Instead of using the maximum shear angle from all material points, the statistical
extreme value is employed to represent the fitness score for each stitching pattern. The lower
this value becomes, the better the stitching pattern. Hence, the fitness function using the
Weibull distribution quantile criterion (WBLQC) can be written as
݂ ୕େ{ଵ,ଶ,⋯,; γଵଶ(ݔ,ݕ,ݖ)} =ߛଵି =ηො∙൬ln1− α1 ൰ ଵ
ఉ Eqn. 17
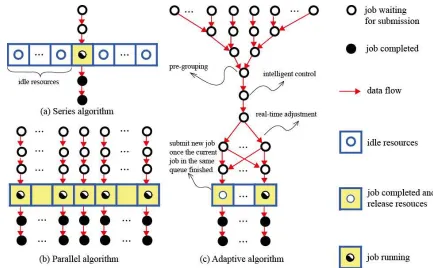
3.3 Adaptive programming strategy
Due to the non-analytical relation between stitching pattern and shear angle distribution,
shear angle data must be collected for every individual stitching pattern from FE analyses.
Although the run time for each simulation has been reduced by mass scaling, processing a
large number of FE jobs in series (Fig. 10(a)) is not an efficient way to conduct the
optimisation, because of considerable idling time of computational resources. It is also
impractical to utilise a parallel algorithm to submit the jobs simultaneously (Fig. 10(b)), since
only a limited number of jobs can be submitted each time, due to typical constraints on the
number of software licenses available and computing hardware. Thus, an adaptive hybrid
algorithm has been developed for running the stitch optimisation as shown in Fig. 10(c). It can
manage and balance the computational resources and task allocation effectively, according to
real-time feedback information.
4. Results and discussion
Stitching patterns were optimised for a hemisphere model with a diameter of100݉ ݉.
The model consisted of a matched punch and die, with a planar blank holder applying normal
pressure to the material to maintain tension in the tows throughout the forming process. The
Section 2.1.2, using a symmetric layup [(0°/90°) / ±45°]s. The plies were numbered in order
from bottom to top as 1stply to 4thply.
The mechanical properties of stitches defined in Section 2.2 were assigned to every stitch
element in each finite element model where applicable. In total, 81 potential positions,
spaced at 40 mm intervals on a regular square grid, were considered as stitching variables.
The population size was 100 in each generation and the tolerance for the fitness function was
0.05°. The crossover and mutation coefficients were 0.80 and 0.20 respectively.
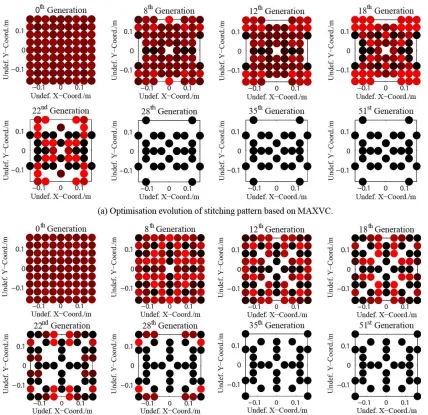
To compare the natural selection criteria, both MAXVC and WBLQC were employed to
execute the optimisation. Several generations have been selected to illustrate the
optimisation evolutions using different fitness functions in Fig. 11. Each generation represents
a summary of 100 individual stitch patterns, where the dots represent the locations for
clusters of stitches, rather than individual stitches. The choice of the individuals in the initial
population may influence the convergence speed, but not the final stitch pattern. The initial
population of 100 patterns for the zeroth generation was generated randomly, which then
evolve into subsequent generations according to the genetic algorithm. The number of
individuals is chosen to be greater than the number of variables (81) to ensure a diverse
population. The low tolerance for the fitness function ensures that the optimisation
procedure is not terminated prior to achieving the optimum.
The frequencies for occurrence of each of the 81 stitch positions were equally
represented in the zeroth generations in Fig. 11, as indicated by a relatively uniform red level
for each dot. The shade of red changes as the stitch patterns evolve for each subsequent
generation, where a darker red (tending towards black) represents a higher frequency for that
stitch position and a lighter shade of red (tending towards white) represents a lower
frequency. As the fitness function converges, all dots appear black, which indicates that all
100 stitch patterns for that generation are the same.
Fig. 11 indicates that: (1) both natural selection criteria converge to produce respective
converged stitch positions are similar for both selection criteria. The basic patterns resemble
a quadrilateral with a cross running through the centre and several additional stitches around
the edges. However, their dimensions are different; (3) the convergence speed is faster for
MAXVC (generation 28) than for WBLQC (generation 35). Whilst the shear angle distributions
for the unstitched case are totally symmetrical, there are no symmetry conditions imposed
during the optimisation process. Therefore the optimum stitch patterns are not always
symmetrical, leading to asymmetric shear angle distributions.
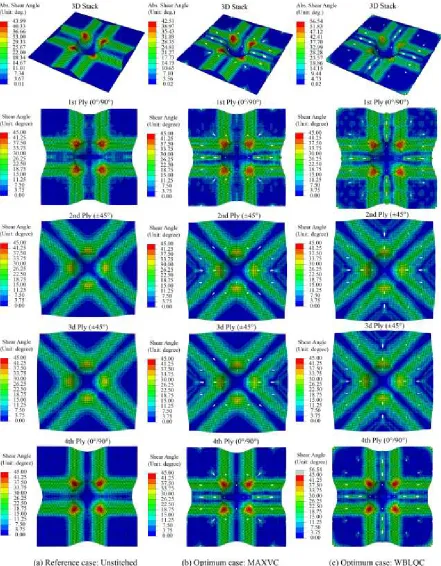
The unstitched case was taken as a reference case to evaluate the quality of the stitch
optimisation. Fig. 12 shows that the maximum shear angle of the optimum case using MAXVC
(42.51°) is slightly smaller than for the unstitched case (43.99°). However, the maximum
shear angle from the WBLQC criteria (56.54°) is significantly higher than the maximum of the
unstitched case. For this particular scenario, the shear angles of the 4 corner elements are
extremely large and are far from the global average. Thus, they can be considered to be
outliers. These severely sheared areas are small relative to the whole material field and are
located at the perimeter of the blank away from the final formed surface. They will not
influence the quality of the final component, but this outcome highlights the relevance of the
statistical criterion.
The global distribution of shear angles produced from the two criteria is almost identical
as shown in Fig. 12. Hence, both criteria appear to produce sensible solutions. Severely
sheared regions (i.e. red) only occur in the0°/90°plies (i.e. 1stand 4thplies), whilst the
maximum shear angle for the±45°plies (i.e. 2ndand 3rdplies) is smaller. This phenomenon is
captured by both criteria.
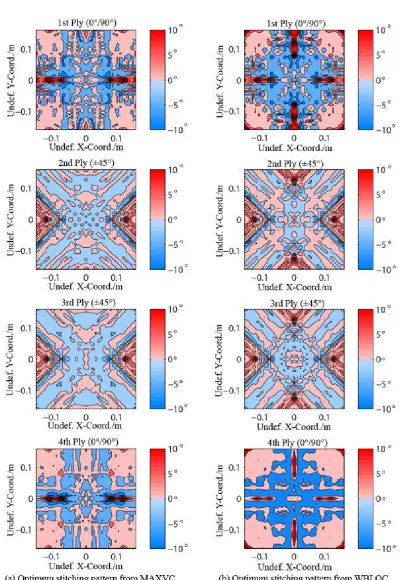
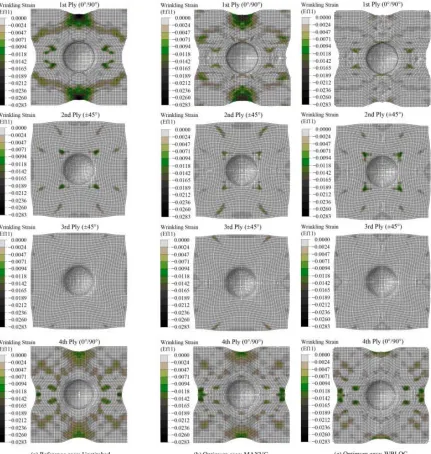
The shear angle distributions have been plotted on the undeformed blank shape and
normalised with respect to the unstitched configuration to make comparisons easier, as
illustrated in Fig. 13. The blue regions represent a reduction in shear angle compared with the
unstitched case and red indicates an increase. For the0°/90°plies (i.e. 1stand 4thplies),
and darker for the WBLQC case in Fig. 13(a) than for the MAXVC case in Fig. 13(b). Hence, the
optimum stitch patterns that result from the WBLQC effectively homogenise the global shear
angle distribution more than the MAXVC, as expected. Reduction in size and intensity of the
blue regions is not so considerable for the±45°plies (i.e. 2ndand 3rdplies) according to Fig.
13.
There are also regions of increasing shear angle for both converged solutions, since load
paths have been changed by placing localised stitches. These regions experience more
deformation than in the unstitched case due to strain re-distribution through localised
stitches, which flatten the shear profile in high deformation regions. The influence of these
local increases depends on the affected area as well as its final absolute shear angle. If these
increases occur on the formed surface of the final component then these effects can be
considered to be negative. However, most of the darker red regions are concentrated around
the edges of the blank and are therefore not critical in this case. Fig. 13indicates that the
increasing shear angle regions (red regions) do not reduce the overall quality of the preform,
as the global shear angle is generally less than 30°, with only small discrete regions
approaching 50°. Stitch patterns produced by WBLQC yield shear angle distributions closer to
the unstitched benchmark solution and can provide better quality formed parts. However, the
cost of using WBLQC is higher, taking more computational time to converge than MAXVC.
The optimisation procedure has successfully homogenised both the local and global shear
angle distributions, using both criteria. However, it is important to avoid introducing
additional defects when minimising the local shear angle. The compressive strains in the fibre
direction (1-direction) have been plotted in Fig. 14 to understand the likelihood of bundle
wrinkling, as reported by Long et al. [27]. (Strain distributions in 2-direction are similar). In
general, there is a reduction in the magnitude of the compressive strains for the two
optimised cases, with the WBLQC case indicating the lowest risk of bundle wrinkling. This
provides further confidence in the optimisation results, but is only a qualitative assessment
5. Conclusions
A finite element model has been developed to solve complex forming problems
consisting of multi-ply preforms containing localised stitch-bonds. A non-orthogonal
constitutive relation has been defined for bi-axial materials with large deformation, using a
user-defined VFABRIC model in Abaqus/Explicit. Assembly stitches have been modelled using
user-defined 1D cable-spring elements. A simulation was performed for a balanced 4 ply
preform with stitches applied in a diagonal configuration. Results indicated that the local
maximum shear angle was significantly higher than in the unstitched case, and local
stitch-bonds influence the global shear angle distribution rather than having just a localised effect. It
was concluded that placing stitch bonds is not an intuitive process and this highlighted the
need for a stitch optimisation routine.
An optimisation methodology has been developed for placing local inter-ply stitches on
multi-ply preforms, by coupling finite element analysis with a genetic algorithm. A binary
encoding scheme has been employed and two different criteria have been proposed to assess
the quality of the shear angle distribution for the optimised solution; the maximum value
criterion (MAXVC) and the Weibull distribution quantile criterion (WBLQC). An adaptive
hybrid processing strategy was designed to accelerate the optimisation by managing
computational resources and task allocation efficiently.
Both MAXVC and WBLQC were found to be suitable criteria for local stitch optimisation,
producing acceptable solutions towards the global optimum. The convergence speed is higher
when adopting MAXVC compared with WBLQC, but WBLQC is more effective for finding a
solution closer to the global optimum by eliminating the influence of outliers. The choice of
criterion is therefore a compromise between optimisation quality and computational cost.
According to the optimisation results, it can be concluded that using optimised patterns of
an unstitched benchmark. Load paths are changed globally due to strain re-distribution
through the localised stitches, which results in a more uniform shear angle distribution.
Acknowledgements
This work was partially funded by the Engineering and Physical Sciences Research Council
[grant number: EP/IO33513/1], through the “EPSRC Centre for Innovative Manufacturing in
Composites”
References
[1] Boisse, P., M. Borr, K. Buet, and A. Cherouat,Finite element simulations of textile composite forming
including the biaxial fabric behaviour.Composites Part B: Engineering, 1997. 28(4): p. 453-464.
[2] Long, A.C.,Design and manufacture of textile composites. 2005: CRC press.pp
[3] Duhovic, M., P. Mitschang, and D. Bhattacharyya,Modelling approach for the prediction of stitch influence
during woven fabric draping.Composites Part A: Applied Science and Manufacturing, 2011. 42(8): p.
968-978.
[4] Molnar, P., A. Ogale, R. Lahr, and P. Mitschang,Influence of drapability by using stitching technology to
reduce fabric deformation and shear during thermoforming.Composites Science and Technology, 2007.
67(15): p. 3386-3393.
[5] Khan, M.A.,Numerical and experimental forming analyses of textile composite reiforcements based on a
hypoelastic behaviour. 2009.
[6] Ten Thije, R. and R. Akkerman,A multi-layer triangular membrane finite element for the forming simulation
of laminated composites.Composites Part A: Applied Science and Manufacturing, 2009. 40(6): p. 739-753.
[7] Cheruet, A., D. Soulat, P. Boisse, E. Soccard, and S.-L. Poec,Analysis of the interply porosities in thermoplastic
composites forming processes.International journal of forming processes, 2002. 5: p. 247-258.
[8] Harrison, P., R. Gomes, and N. Curado-Correia,Press forming a 0/90 cross-ply advanced thermoplastic
composite using the double-dome benchmark geometry.Composites Part A: Applied Science and
Manufacturing, 2013. 54: p. 56-69.
[9] Bel, S., N. Hamila, P. Boisse, and F. Dumont,Finite element model for ncf composite reinforcement
preforming: Importance of inter-ply sliding.Composites Part A: Applied Science and Manufacturing, 2012.
43(12): p. 2269-2277.
[10]Sidhu, R., R. Averill, M. Riaz, and F. Pourboghrat,Finite element analysis of textile composite preform
stamping.Composite structures, 2001. 52(3): p. 483-497.
[11]Bel, S., A. Margossian, D. Leutz, U. Beier, R. Hinterhoelzl, and K. Drechsler.Validation of local stitching
simulation for stitched ncf ply stacks. inThe 19th International Conference on Composite Materials2013. pp
7070-7077
[12]Margossian, A., S. Bel, J. Balvers, D. Leutz, R. Freitas, and R. Hinterhoelzl,Finite element forming simulation
of locally stitched non-crimp fabrics.Composites Part A: Applied Science and Manufacturing, 2014. 61: p.
152-162.
[13]Khan, M.A., T. Mabrouki, E. Vidal-Salle, and P. Boisse,Numerical and experimental analyses of woven composite reinforcement forming using a hypoelastic behaviour. Application to the double dome benchmark.
Journal of materials processing technology, 2010. 210(2): p. 378-388.
[14]Boisse, P.,Finite element analysis of composite forming, inComposite forming technologies, A. Long, Editor. 2007.
[15]Lim, T.-C. and S. Ramakrishna,Modelling of composite sheet forming: A review.Composites Part A: Applied Science and Manufacturing, 2002. 33(4): p. 515-537.
[16]Peng, X. and J. Cao,A dual homogenization and finite element approach for material characterization of
textile composites.Composites Part B: Engineering, 2002. 33(1): p. 45-56.
[17]Peng, X. and J. Cao,A continuum mechanics-based non-orthogonal constitutive model for woven composite
fabrics.Composites part A: Applied Science and manufacturing, 2005. 36(6): p. 859-874.
[19]Cao, J., R. Akkerman, P. Boisse, J. Chen, H. Cheng, E. De Graaf, J. Gorczyca, P. Harrison, G. Hivet, and J. Launay,Characterization of mechanical behavior of woven fabrics: Experimental methods and benchmark
results.Composites Part A: Applied Science and Manufacturing, 2008. 39(6): p. 1037-1053.
[20]Peng, X. and Z.U. Rehman,Textile composite double dome stamping simulation using a non-orthogonal
constitutive model.Composites Science and Technology, 2011. 71(8): p. 1075-1081.
[21]Boisse, P., Y. Aimène, A. Dogui, S. Dridi, S. Gatouillat, N. Hamila, M.A. Khan, T. Mabrouki, F. Morestin, and E. Vidal-Sallé,Hypoelastic, hyperelastic, discrete and semi-discrete approaches for textile composite
reinforcement forming.International journal of material forming, 2010. 3(2): p. 1229-1240.
[22]Yu, X., B. Cartwright, D. McGuckin, L. Ye, and Y.-W. Mai,Intra-ply shear locking in finite element analyses of
woven fabric forming processes.Composites Part A: Applied Science and Manufacturing, 2006. 37(5): p.
790-803.
[23]Ten Thije, R. and R. Akkerman,Solutions to intra-ply shear locking in finite element analyses of fibre
reinforced materials.Composites Part A: Applied Science and Manufacturing, 2008. 39(7): p. 1167-1176.
[24]Rice, J.,Mathematical statistics and data analysis. 2006: Cengage Learning.pp [25]Gumbel, E.J.,Statistics of extremes. 2012: Courier Dover Publications.pp
[26]Forbes, C., M. Evans, N. Hastings, and B. Peacock,Statistical distributions. 2011: John Wiley & Sons.pp [27]Long, A., A.A. Skordos, P. Harrison, M. Clifford, and M.P. Sutcliffe.Optimisation of sheet forming for textile
composites using variable peripheral pressure. inSAMPE. 2006. Paris, France. pp
[image:20.595.69.500.445.594.2]6. Tables and Figures
Table 1:Comparison of shear angle data from Abaqus/Explicit VFABRIC model using time-scaling (TS) and mass-time-scaling (MS) against experimental results from literature [5, 13]; left: plain weave fabric at 0°/90°; right: plain weave fabric at ±45.
0°/90° Plain Weave Fabric ±45° Plain Weave Fabric
ID Coord. (mm) Shear Angle (deg.) ID Coord. (mm) Shear Angle (deg.) Def. X Def. Y Exp. Num. (TS) Num. (MS) Def. X Def. Y Exp. Num. (TS) Num. (MS)
1 19 209 7.84 7.33 7.69 1 1 169 42.16 42.36 42.75
2 29 194 14.48 14.55 14.25 2 25 168 23.61 22.17 23.05
3 38 177 22.61 21.50 21.63 3 43 168 9.67 9.78 10.59
4 49 161 33.66 34.22 32.89 4 57 168 0.00 0.42 3.13
5 58 147 38.94 39.28 38.91 5 56 141 8.87 8.52 5.96
6 67 132 26.53 24.22 26.42 6 56 106 14.82 16.01 16.00
7 77 116 16.62 16.05 15.46 7 56 69 22.82 20.34 21.93
8 86 101 3.21 3.76 3.31 8 78 66 21.79 23.12 20.53
9 95 86 7.06 7.96 7.77 9 99 67 17.83 17.79 17.33
10 105 69 0.00 1.08 1.64 10 118 66 7.77 6.06 8.56
Avg. Abs. Errorଵ
ே∑หߛଵଶ௨ −ߛଵଶ
௫ห 0.80° 0.59° Avg. Abs. Errorଵ
ே∑หߛଵଶ௨ −ߛଵଶ
௫ห 0.93° 1.28°
Fig. 1:Flow chart of user-defined VFABRIC material model.
[image:21.595.68.529.291.669.2]Fig. 3:The effect of mesh orientation relative to material orientations on the shear angle distribution for both 0°/90° and ±45° plies.
[image:22.595.70.521.579.733.2]Fig. 5:Definition of axial behaviour for stitch element.
[image:23.595.76.511.360.717.2]Fig. 7:Local shear angles plotted along a diagonal path from the centre of the hemisphere to the top-right corner (see Fig 6).
[image:24.595.66.514.366.640.2]Fig. 9.Binary encoding and manipulation scheme for stitching pattern.
[image:25.595.61.494.475.743.2]![Table 1: Comparison of shear angle data from Abaqus/Explicit VFABRIC model using time-scaling (TS) and mass-scaling (MS) against experimental results from literature [5, 13]; left:plain weave fabric at 0°/90°; right: plain weave fabric at ±45.](https://thumb-us.123doks.com/thumbv2/123dok_us/8667288.376206/20.595.69.500.445.594/comparison-abaqus-explicit-vfabric-scaling-scaling-experimental-literature.webp)