1
Kinetic study of time-dependent fixation of U
VIon biochar
.
A. Ashry a,b, E.H. Bailey a*, S.R.N. Chenery c and S.D. Young a
a. Division of Agricultural and Environmental Sciences, School of Biosciences, University of Nottingham, Sutton Bonington, Leicestershire LE12 5RD, UK. b. Radiation Protection Department, Nuclear Research Centre, Egyptian Atomic
Energy Authority, Cairo, Egypt.
c. British Geological Survey, Nicker Hill, Keyworth, Nottingham NG12 5GG, UK.
*Corresponding author: [email protected], Tel:+44(0)1159516255
Abstract
Biochar, a by-product from the production of biofuel and syngas by gasification, was tested as a material for adsorption and fixation of UVI from aqueous solutions. A batch experiment was conducted to study the factors that influence the adsorption and time-dependent fixation on biochar at 20oC, including pH, initial concentration of UVI and contact time. Uranium (UVI) adsorption was highly dependent on pH but adsorption on biochar was high over a wide range of pH values, from 4.5 to 9.0, and adsorption strength was time-dependent over several days. The experimental data for pH > 7 were most effectively modelled using a Freundlich adsorption isotherm coupled to a reversible first order kinetic equation to describe the time-dependent fixation of UVI within the biochar structure. Desorption experiments showed that UVI was only sparingly desorbable from the biochar with time and isotopic dilution with 233UVI confirmed the low, or time-dependent, lability of adsorbed 238UVI. Below pH 7 the adsorption isotherm trend suggested precipitation, rather than true adsorption, may occur. However, across all pH values (4.5–9) measured saturation indices suggested precipitation was possible: autunite below pH 6.5 and either swartzite, liebigite or bayleyite above pH 6.5.
2
1
Introduction
Increasing demand for energy has persuaded many countries to look for alternative and renewable sources such as biofuel and syngas [1]. Their production by gasification, pyrolysis or hydrothermal carbonization (HTC) of plant or animal biomass (e.g. wood, manure, leaves or bone) in an oxygen deficient environment [2] generates large quantities of carbonaceous by-products known collectively as ‘biochar’ [3]. The composition and properties of biochar depend upon the production method and source material being combusted. This results in variation in physical and chemical properties such as pH, ash content, surface area and chemistry [4]. Material produced from gasification and/or pyrolysis has a higher ash content than biochar produced via HTC which is richer in carbon [3]. Comparison of the characteristics of biochars produced from the same pinewood source material by HTC at 300oC or pyrolysis at 700oC for copper adsorption from aqueous solution [5] found that HTC-biochar had more active adsorption sites and stable carbon-oxygen complexes on its surface with a 95% increase in oxygen-containing groups compared to the source material. By contrast, there was a 56% decrease in oxygen-containing groups in biochar produced by pyrolysis. BET surface area measurements showed that the biochar produced by HTC had a lower surface area (21 m2 g-1) compared to the biochar produced via pyrolysis (29 m2 g-1), but had a greater capacity to adsorb copper.
3
Few studies have examined the capacity of biochar for removal of radioactive materials from aqueous solutions or its potential as a soil amendment for the remediation of radioactively contaminated soil. Biochar produced from HTC of switch grass was investigated as a potential permeable reactor barrier material [3]. The UVI adsorption capacity increased from 2120 mg kg-1 at pH 3.0 to ~4000 mg kg-1 at pH 5.9 then declined at higher pH. This suggests that UVI adsorption is highly dependent on the U speciation in solution with formation of carbonate complexes at higher pH. Factors affecting U removal and recovery from aqueous solutions by HTC-biochar including pH, initial UVI concentration, contact time, ionic strength and temperature have also been investigated [13]. Maximum uptake capacity was attained at a pH of ~6.0 after 50 minutes equilibration. A pseudo-second order kinetic model best described the adsorption kinetics and a Langmuir adsorption isotherm described the adsorption process at equilibrium. The thermodynamic parameters ∆Go (298 Ko) ∆Ho and ∆So defining the adsorption reaction were reported as -14.4, 36.1 kJ mol-1 and 169.7 J mol-1 K-1, respectively, indicating that UVI sorption on biochar was endothermic [13]. Regeneration of the biochar was possible by leaching with 0.05 mol L-1 HCl solution, possibly suggesting reversible bonding to oxyacid surface groups.
The aim of the current study was to investigate the ability of a phosphate-rich bone-derived biochar to adsorb and fix UVI from solution over a period of 15 days. Most biochars are of plant/wood origin whereas bone biochar, used in this study, has dual characteristics in that it consists of a carbon-based matrix in intimate association with a Ca phosphate mineral phase. The underlying hypothesis was that while oxy-acid functional groups on the biochar (e.g. COOH) provide sites for rapid adsorption of UVI a longer-term fixation mechanism might result from gradual incorporation into the apatite structure with UO22+ ions replacing Ca2+. The main objectives of this work were to address the questions:
i. Does biochar show time-dependent fixation of UVI or is the adsorption reaction wholly reversible and rapid?
ii. What factors affect the strength of adsorption and fixation of UVI in the biochar and what underlying mechanisms appear to operate?
iii. Is the bone-biochar a suitable material for water purification or better suited to soil remediation?
4
(adsorbed) UVI was assessed using desorption into a solution matrix in which only the UVI concentration differed from the pre-equilibrated adsorption solution. An attempt was made to use isotopic dilution with 233UVI to quantify the ‘reactivity’ (lability) of the previously adsorbed UVI. The free ion activity products of candidate solid phases were tested for possible surface precipitation of U on biochar. We believe this is the first study to quantify, and model, uranium fixation in a phosphatic biochar through concurrent measurement of (i) adsorption kinetics, (ii) desorbability and (iii) isotopic exchangeability with enriched 233U.
2
Materials and methods
All chemicals and reagents were of trace analysis grade unless otherwise stated. All solutions were prepared using Milli-Q water (~18 MΩ cm, TOC ≤10 µg L-1). Uranium calibration standards and 238UVI spike solution were prepared by dilution of a stock ICP-MS standard solution containing 1000 mg L-1 UVI dissolved in 2% HNO3.
Biochar, produced from gasification of cow bone in the absence of oxygen at approximately 850oC, was obtained from Brimac Environmental Services Ltd., Greenock, UK and dried at room temperature for 1 week.
2.1
Instrumentation
2.1.1
Inductively coupled plasma mass spectrometry (ICP-MS)
Elemental analysis was undertaken by quadrupole ICP-MS (iCAP-Q, Thermo Scientific) employing a peltier-cooled spray chamber equipped with concentric quartz glass nebulizer. Internal standards included Rh (20 µg L-1) and Ir (10 µg L-1) in 2% HNO3. Trace elements were calibrated using Claritas-PPT grade CLMS-2 (Certiprep/Fisher); Major alkali(-earth) cations were calibrated using a bespoke standard (PlasmaCAL, SCP Science, France) and P, B and S calibrations utilized an in-house standard solution (KH2PO4, K2SO4 and H3BO3). Limits of detection (µg L-1) were: Ca (13.8), Mg (0.41), P (3.51), 238U (0.00028), 233U (0.00001). In-sample switching was used to measure B and P in STD mode, Se in H2-cell mode and all other elements in He-cell mode. Peak dwell times were 10 mS for most elements with 150 scans per sample. Sample processing was undertaken using Qtegra™ Intelligent Scientific Data Solution™ (ISDS) software (Thermo- Fisher Scientific, UK).
2.1.2 Scanning electron microscopy (SEM)
5
Oxford Instruments INCA Energy 450 energy-dispersive X-ray microanalysis (EDXA) system and silicon drift X-ray detector (SDD) capable of operating at high input X-ray count rates (up to ~106 counts per second). The ESEM was operated in low vacuum mode, with an accelerating voltage of 20 kV, beam probe currents of c.0.6 nA and a working distance of ~10 mm [14].
2.1.3
Biochar Elemental Composition
Biochar was acid digested using a mixed HF-HNO3-HClO4 acid protocol. Biochar samples (c. 0.200 g) in triplicate were weighed into PFA vials and heated on a 48-place Teflon-coated graphite block digester with 4 ml of concentrated HNO3 for 30 min to digest the organic fraction. A further 2 ml of HNO3 and 1 ml of HClO4 were then added with heating at 80°C for 8 hr and then at 100°C for a further 2 hr. An aliquot (2.5 ml) of hydrofluoric acid (40% AR) was added and samples were heated to 120°C for 8 hr until dry. Finally, 2.5 ml of HNO3 and 2.5 ml of Millli-Q water were added and the samples left for one hour at 50oC. Finally, the digestate was made to 50 ml by adding Millli-Q water. Operational blanks were prepared in the same way. Analysis of C%, N% and H% was undertaken in duplicate using a FLASH 2000 CHNS/O Analyzer (Thermo Fisher Scientific). Inorganic C% was determined in triplicate using a Shimadzu TOC-VCS/CP analyzer SSM-5000A.
2.1.4
Dissolved organic and inorganic carbon
Total dissolved carbon (TC) and dissolved organic carbon (DOC) were determined on biochar suspensions in 0.01 M Ca(NO3)2 using a Shimadzu TOC-VCPH. Samples were acidified with HCl to pH 2-3 to remove inorganic carbon, before the remaining (organic) carbon was detected as CO2 by non-dispersive infrared detection after heating to 720°C with a platinum-coated alumina catalyst. Inorganic carbon was estimated from the difference between TC and DOC.
2.2
Batch adsorption experiment
6
The amount of UVI adsorbed (Uads, mg kg-1) was determined from the difference between the added UVI concentration (Uadded, mg L-1) and measured solution U concentration (Usoln, mg L-1) from Eq.(1):
𝑈𝑎𝑑𝑠 = (𝑈𝑎𝑑𝑑𝑒𝑑− 𝑈𝑠𝑜𝑙𝑛) ∗ (𝑊𝑉) (1)
where 𝑉 is the total volume of suspension (L) and 𝑊 the weight of biochar (kg).
2.2.1
Reversible first order model (RFO)
A reversible first order kinetic model (RFO) was used to describe the time-dependent adsorption of UVI onto the biochar. Following the initial rapid attainment of a reversible equilibrium, further sorption was considered as a time-dependent, but reversible, reaction:
𝑈𝑉𝐼+ 𝐵𝑖𝑜 − 𝑆 𝑘𝑎⇆ 𝑘𝑏
𝐵𝑖𝑜 − 𝑆 − 𝑈𝑉𝐼
Where ka and kb are reversible first order forward and reverse rate constants, respectively and Bio-S is the active site on the biochar surface.
The first order model equation can be expressed as described in Eq.(2) [15]:
[𝑈]𝑡= [𝑈]𝑜(𝑘𝑏+𝑘𝑎𝑒
−(𝑘𝑎+𝑘𝑏)𝑡
𝑘𝑎+𝑘𝑏 ) (2)
where [U]o is the initial concentration of UVI in solution at ‘time zero’, established instantaneously by adsorption of labile U, [U]t is the UVI concentration in solution at time t and ka and kb are the forward and reverse rate constants describing slower time-dependent UVI sorption. The Microsoft Excel Solver tool was used to predict the parameters [Uo], ka and kb by minimising the sum of proportional error squared (SPES).
It should be noted that, in allowing for instantaneous adsorption of UVI ions, [U]o differs from Uadded. The model-fitted concentrations of U in solution at zero time, [Uo], for different added UVI concentrations and pH values (7, 8 and 9) were used to obtain ‘zero-time’ Freundlich adsorption isotherm parameters kf and nf which are assumed to represent the equilibrium of wholly labile UVI ions (Eq.3):
𝑈𝑎𝑑𝑠,𝑡=0 = 𝑘𝑓(𝑈𝑜)𝑛𝑓 (3)
7
2.2.2
Spherical diffusion model
The spherical diffusion model is based on the assumption that sorption is controlled by diffusion into uniform spherical particles of radius (r) controlled by a diffusion coefficient (D) [16-18]. It has been successfully applied to describe time-dependent sorption processes in materials, including soil [19, 20], minerals [21] activated carbon [22] and waste materials e.g. ‘bottom ash’ and de-oiled soya [23].
The model equation is shown in Eq.(4) [16, 17]:
𝑈𝑡= 𝑈𝑜(𝜋62 ∑𝑛=∞𝑛12
exp
− (𝑛2𝜋𝑟22𝐷𝑡)𝑛=1 ) (4)
where n is an integer, D is the intra-aggregate diffusion coefficient (m2 d-1) and r is the aggregate radius. Equation 4 was fitted to the time-dependent U adsorption data by optimising the compound parameter D/r2 to minimise the SPES. Again, it is important to make a distinction between Uadded and Uo in that some instantaneous adsorption of labile UVI ions is assumed.
2.3
Isotopic exchange with
233U
VIto determine
238U
VIE-values (
238U
E)
Isotopic dilution (ID) has been widely used to measure the isotopically exchangeable, or ‘labile’, pool of an element in soils/sediments. The procedure involves spiking a geocolloidal suspension with a small quantity of an enriched minor isotope of the element of interest. The introduced spike isotope (233UVI) should behave in an identical way to the natural isotope under consideration (238UVI) but mix only with the labile pool of metal present [24-26].
At the end of the adsorption experiment (equilibrated for 7 days) selected biochar suspensions with added 238U concentrations (Uadded) of 2, 3 and 5 mg L-1, and with the full range of pH values, were chosen for spiking with 233U to measure the labile pool of 238UVI. Suspensions spiked with 233UVI were returned to the shaker at 25 oC and sub-samples collected at 1, 2, 3, 4, 5, 6 and 8 days to investigate the effect of 233U isotope mixing time on the measurement of isotopically exchangeable 238U. The 233U/238U ratio in solution was determined on filtered (<0.2 µm) supernatant solutions. The apparent concentration of isotopically exchangeable 238U (238UE; mg kg-1) was calculated to establish the extent of 233U ⇌ 238U isotope mixing on the biochar and thus the apparent lability of the added 238U, as shown in Eq.(5):
𝑈𝐸 = 𝑈𝑠𝑜𝑙𝑛[𝐾𝑑+𝑊𝑉𝑡𝑜𝑡𝑎𝑙
𝑠𝑜𝑙𝑖𝑑]
238
238 (5)
Where 238𝑈𝑠𝑜𝑙𝑛 is the concentration (mg L-1) of 238U in the solution of an equilibrated spiked suspension, 𝐾𝑑 is the distribution coefficient of a 233U spike (L kg-1), 𝑉
8
total volume (L) of suspension and Wsolid (kg) is the weight of biochar in the suspension. The lability of the 238U in the system can be expressed as a proportion (%) of added U (%238UE).
2.4
Desorption experiment
Prior to measuring desorption, UVI was allowed to adsorb on biochar for 15 d at added UVI concentrations of 2, 3 and 5 mg L-1. A Freundlich equation was fitted to the adsorbed data. Bespoke desorbing solutions were prepared by pre-equilibrating samples of biochar in 0.01 M Ca(NO3)2 and filtering the suspension to prepare a solution that was as close as possible to the suspensions equilibrated with U. Suspensions were allowed to equilibrate in 0.01 M Ca(NO3)2 for the same period of time and under the same conditions of pH and temperature as the U-spiked suspensions [27]. This approach was preferred over desorbing the in fresh 0.01 M Ca(NO3)2 solutions as any change in pH or anionic ligand (e.g. phosphate, bicarbonate) concentration could increase, or decrease, U solubility for reasons other than a simple change in UVI solution concentration [28-30].
Desorption was undertaken by replacing 50% of the filtered supernatant solution with the U-free desorbing solution. The suspension was then shaken for 24 h. Before sampling the suspension was allowed to settle (30 min), filtered (<0.22 µm) and the solution acidified to 2% HNO3 before analysis. This process was repeated for 4 days.
The amount of UVI desorbed (Udes; µg kg-1) was calculated for each desorption step from measured solution concentrations and the volume of supernatant removed [12]. The new adsorbed U concentration (Uads,d; µg kg-1) was calculated from the progressive loss of U in the desorbing solutions (Udes) [12]. The measured solution concentration of U (Usoln,d; µg L-1) was then used to calculate the ‘expected’ concentration of adsorbed U (Uads,a; µg kg-1), if U adsorption was completed reversible, from Frendlich parameters (kf, nf) fitted to the adsorption trend for 15 days. The difference between Uads,d and Uads,a represents the desorbability of the adsorbed U and can be expressed as:
%𝑈𝑑𝑒𝑠𝑜𝑟𝑏 =
[𝑘𝑓(𝑈𝑠𝑜𝑙𝑛,𝑜)𝑛𝑓 − 𝑈𝑎𝑑𝑠,𝑑] 100
𝑘𝑓(𝑈𝑠𝑜𝑙𝑛,𝑜)𝑛𝑓 − 𝑘𝑓(𝑈𝑠𝑜𝑙𝑛,𝑑)𝑛𝑓 (6)
Where Usoln,o is the solution concentration of U at the end of the initial 15-day adsorption period.
2.5
Geochemical speciation model
(
WHAM-VII)
9
UO22+ were predicted and used to calculate the saturation index (SI) of potential solid phases [32]:
𝑙𝑜𝑔10SI = 𝑙𝑜𝑔10(IAP/KSP) (7)
Where IAP is the ion activity product for the candidate solid phase and KSP is its solubility product. If the log10SI is >0 then the solution is supersaturated and the solid phase should be actively precipitating.
2.6
Statistical analysis
The residual standard deviation (𝑅𝑆𝐷) was used to assess the performance of empirical models:
𝑅𝑆𝐷 = √∑𝑛𝑖=1(𝑀𝑖−𝑃𝑖)2
(𝑛−𝑐) (8)
10
3
Results and discussion
3.1
Biochar characterization
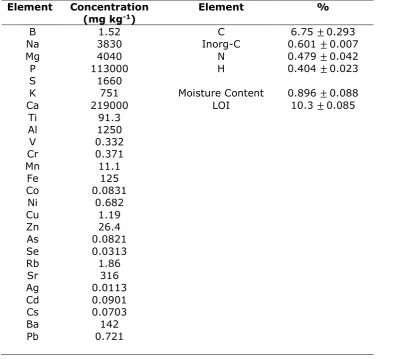
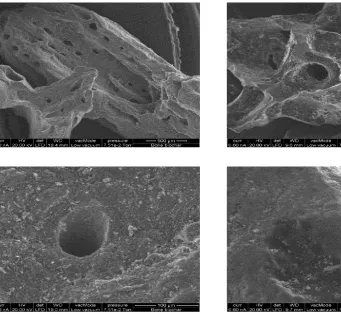
Biochar suspensions had a naturally high pH of 9.6. Elemental analysis (Table 1) gives a mole ratio of Ca:P of 1.50 suggesting the presence of Ca-deficient hydroxyapatite Ca5(PO4)3(OH) (Ca:P = 1.67). SEM images (Fig 1) showed grains were irregular in shape with a porous structure, probably originating from the original bone material.
3.2
Kinetics of U
VIadsorption
Reversible first order kinetic (RFO) and spherical diffusion models (SDM) were applied to describe the kinetics of UVI adsorption. There was a marked initial loss of U from solution which was greatest at low pH values (Fig. 2). Thereafter, however, both models adequately described the time-dependent UVI adsorption trends (Fig. 2).
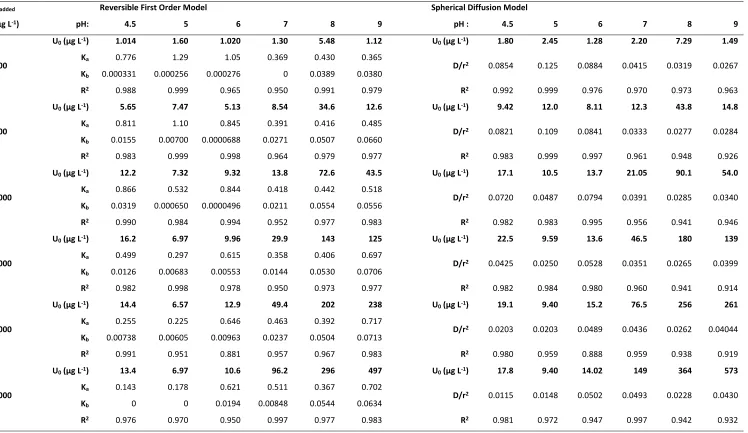
Initial UVI concentrations in solution (Uo), rate constant parameters of the RFO model (ka and kb) and values of D/r2 for the SDM (Eqs 2 and 3) were all optimised independently for each combination of suspension pH and added U concentration (Uadded); values are shown in Table 2. ‘Initial U concentration’ (Uo) is a fitted variable and was typically between 1–10% of the ‘added U concentration (Uadded)’ (Table 2) as a result of instantaneous U adsorption by the biochar. Thus the majority of the U was adsorbed very rapidly and this was followed by a slower continuing adsorption reaction (Fig. 2), limited either by reaction rate or diffusion within the biochar structure [33]. Values of ka were much greater than kb, especially at low pH and U concentrations. The diffusion parameter D/r2 varied with pH and U concentration; averaged across the added U range it was maximal at pH 6 (0.0673 d-1) and across the pH range was greatest at the lowest U concentration (0.0665 d-1). An exact physical meaning of D/r2 is compromised by the irregularity of the biochar particles and their variable particle size (Fig. 1); changes in U speciation with pH will also affect the values of the effective diffusion coefficient (D) and Uo.
11
(Fig. 4). This approach provided a good overall representation of the kinetics of UVI adsorption on biochar (Fig. 4) but was only successful within a pH range (7 – 9) in which adsorption, rather than precipitation, appeared to control U retention in the solid phase.
3.3
Isotope dilution
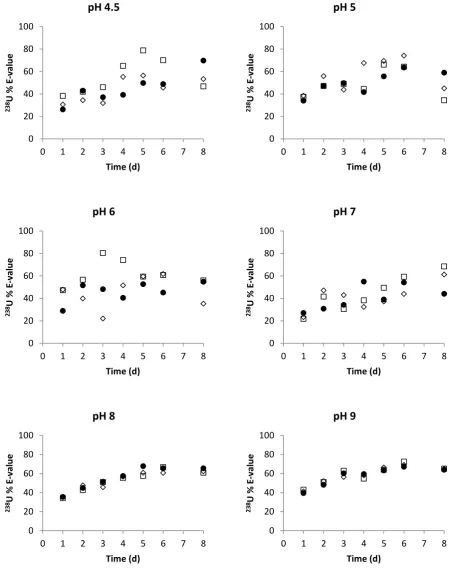
Time-dependent adsorption may signify diffusion-limited access to otherwise labile adsorption sites or a fixation reaction e.g. crystallization, or solid-phase diffusion which liberates new surface adsorption sites. Simply measuring adsorption of 238UVI does not determine the ‘reactivity’ of the adsorbed U. Thus, E-values (238UE, Eq. 4) were measured in an attempt to estimate the isotopically exchangeable 238U in the suspensions. Values of 238UE were determined for suspensions containing Uadded concentrations of 2, 3 and 5 mg L-1 and at all six pH values following 238UVI adsorption for 7 days. However, the short adsorption times being examined (up to 7 days) presents a problem for interpretation of 238UE because the isotopic equilibration time normally allowed is typically 2 or 3 days (Ahmed et al., 2006). Furthermore, the combination of biochar as adsorbent and an enriched isotope of U (233U) as tracer has not previously been investigated in this context. Therefore, we tested several 233UVI isotope equilibration times, including 1-6 and 8 days. Figure 5 shows that %238UE increased with isotope equilibration time up to day 4 or 5. This increase in (apparent) E-value can be attributed to slow mixing of the tracer isotope (233UVI) into less labile pools of 238U and suggests the presence of slowly reactive adsorbed 238U fractions on the biochar. After day 5 the measured %238UE tended towards an asymptote corresponding to about 50 – 75% of the adsorbed 238U depending on the suspension pH. The trend was highly scattered for pH values of 4.5–7 reflecting low precision due to very low concentrations of 233U in solution but was clearer for pH 8 and 9 where carbonate complex formation maintained a higher U concentration in solution.
The 238UVI added to the system was not in true equilibrium at the time of spiking with 233UVI as shown by the time-dependent adsorption (Figures 2 and 4). This compromises measurement of 238UE to some degree, but the change in solution and solid phase concentrations of 238U were proportionately small between contact times of 7 and 15 days (the time period tested with 233U equilibration). Therefore a more realistic interpretation of the 233U equilibration data in Fig. 5 is that they genuinely reflect the slow reaction kinetics of adsorbed 238U but also suggest that the majority of recently adsorbed 238U remains isotopically exchangeable within a period of several days.
3.4
Desorption of
238U
VI12
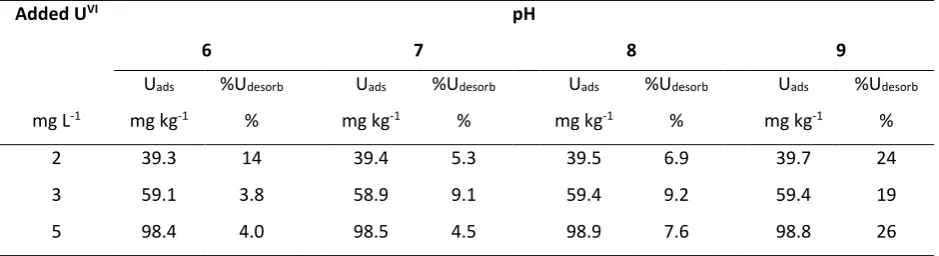
desorption steps using a U-free solution prepared in a similar way to the adsorption suspensions described previously. Four 1-day cycles of desorption were undertaken, (Figure 6), following an initial reaction time (adsorption) of 15 days. The general trend in Fig. 6 displays substantial adsorption hysteresis with desorption of UVI following a markedly different trend from the original adsorption process with poor buffering of the solution concentration. Desorbability (%Udesorb; Eq.6) of adsorbed UVI (Table 4) was assessed after the fourth 24 h desorption cycle. Values of %Udesorb were very low for pH ≥6 with an average of 6.0±0.7 % across all U concentrations and pH values. For pH 9, the adsorbed U was more strongly buffered with an average value for %Udesorb of 23±2.1 %. Direct comparison of %238UE and %Udesorb is conceptually valid as the latter should represent the proportion of adsorbed U which is capable of responding to a change in equilibrium with the solution phase. Values of %238UE include U in solution but this is a trivial proportion of the total labile pool. For pH 6, 7 and 8 values of %Udesorb were substantially lower than %238UE for an equivalent 1 day isotopic equilibration (Figure 5). This may reflect the greater contact time (15 d) prior to desorption compared to the initial E-value measurement following 7 d adsorption. For pH 9, the two indices of U lability were much closer, both measurements probably reflecting the influence of carbonate complex formation in retaining adsorbed U in a more labile, reactive state.
3.5
U
VIspeciation and stability diagram
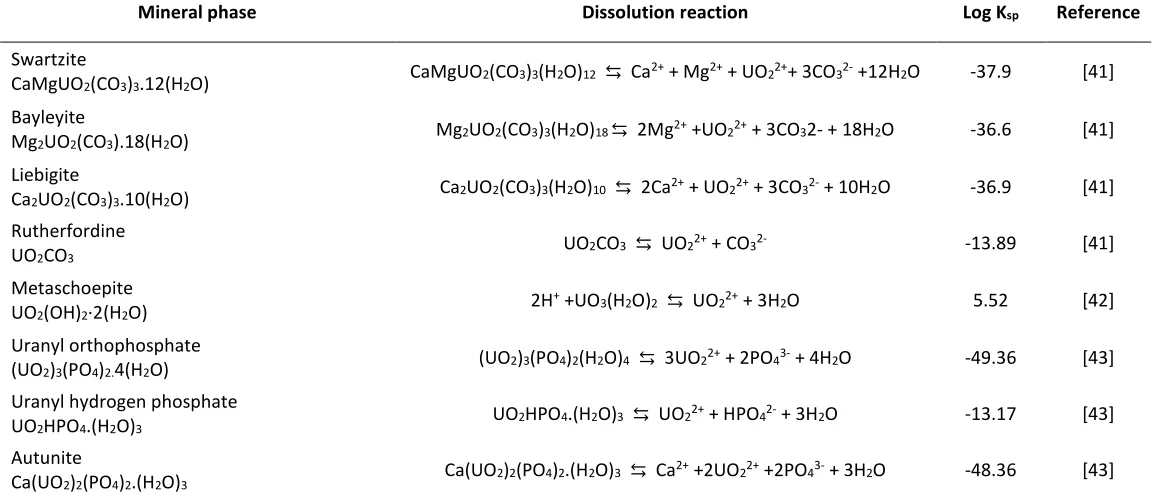
To assess the likelihood of U precipitation contributing to the apparent fixation of U, chemical speciation of UVI in the suspensions was calculated using WHAM-VII. Saturation indices for possible U-containing solid phases (Table 3) were calculated from predicted free ion activities of calcium, carbonate, magnesium, phosphate and uranium at pH values of 4.5, 5, 6, 7, 8 and 9, adsorption times of 1-5 d and 7 d and initial UVI concentrations of 0.1, 0.5, 1, 2, 3 and 5 mg L-1.
13
(≥7; current study) there was oversaturation of swartzite, bayleyite and liebigite. This suggests that UVI uptake by biochar is not only controlled by adsorption reactions but also by precipitation reactions, depending on the pH range - a similar conclusion to that of a study on UO22+ adsorption on hydroxyapatite [37]. Mehta et al (2016) used batch experiments to assess the extent of U(VI) immobilization by calcium and phosphate over a range of pH 4-7.5 and also observed autunite formation at pH 4 and 6 with U(VI) sorbed on Ca-PO4 solid phases at pH 7.5 or structurally incorporated into amorphous calcium phosphate phases where sufficient dissolved calcium and phosphate were available [38].
Precipitation could also explain the slow reaction kinetics, time-dependent sorption, poor desorbability and non-isotopic exchangeability of U adsorbed on the biochar. Interpolated model lines for predicted solid phases are shown in Fig 7 using free ion activities calculated at each pH value from the WHAM VII speciation model. It is evident that solubility of UO22+ was governed by autunite [Ca(UO2)2(PO4)2.10H2O] at pH 4.5, 5.0 and 6.0. The dominant solid phases at higher pH appear to be swartzite, bayleyite and liebigite as suggested in other studies [39, 40].
4
Conclusions
In this work, we demonstrated the time-dependent fixation of UVI from aqueous solution into biochar produced by gasification of cow bones. Fixation of UVI on biochar exhibited rapid adsorption on the reactive groups on biochar surfaces followed by a slower reaction rate suggesting that the UVI may gradually penetrate the porous structure of biochar grains or form progressively stronger surface complexes or new, less soluble, solid phases. The suggestion that the slow adsorption reaction reflected a ‘fixation’ reaction was supported by measurement of isotopically exchangeable 238U with 233U, slow isotopic equilibration over several days, poor desorbability, especially at low pH values and a test of ion activity products which suggested the formation of new U-containing solid phases. Speciation of UVI solid phases predicted from WHAM-VII showed that the controlling solid phase at pH 4.5-6 was autunite while at higher pH (7-9) the controlling solid phases were swartzite, bayleyite and liebigite.
14
Acknowledgements
15
Table 1: Elemental composition of biochar.
Table 2: Kinetic rate constants (ka, kb; d-1) for the reversible first order model and the parameter D/r2 (d-1) for the spherical diffusion model. The variable U0 (µg L-1) is the extrapolated U concentration in solution at zero time.
Table 3: Solubility products of selected U phases.
16
[image:16.595.65.465.147.506.2]Table 1: Elemental composition of biochar.
Element Concentration
(mg kg-1) Element %
B 1.52 C 6.75 ± 0.293
Na 3830 Inorg-C 0.601 ± 0.007
Mg 4040 N 0.479 ± 0.042
P 113000 H 0.404 ± 0.023
S 1660
K 751 Moisture Content 0.896 ± 0.088
Ca 219000 LOI 10.3 ± 0.085
Ti 91.3
Al 1250
V 0.332
Cr 0.371
Mn 11.1
Fe 125
Co 0.0831
Ni 0.682
Cu 1.19
Zn 26.4
As 0.0821
Se 0.0313
Rb 1.86
Sr 316
Ag 0.0113
Cd 0.0901
Cs 0.0703
Ba 142
17
Table 2: Kinetic rate constants (ka, kb; d-1) for the reversible first order model and the parameter D/r2 (d-1) for the spherical diffusion model. The variable U0 (µg L-1) is the extrapolated U concentration in solution at zero time.
Uadded Reversible First Order Model Spherical Diffusion Model
(µg L-1) pH: 4.5 5 6 7 8 9 pH : 4.5 5 6 7 8 9
100
U0 (µg L-1) 1.014 1.60 1.020 1.30 5.48 1.12 U0 (µg L-1) 1.80 2.45 1.28 2.20 7.29 1.49
Ka 0.776 1.29 1.05 0.369 0.430 0.365
D/r2 0.0854 0.125 0.0884 0.0415 0.0319 0.0267
Kb 0.000331 0.000256 0.000276 0 0.0389 0.0380
R2 0.988 0.999 0.965 0.950 0.991 0.979 R2 0.992 0.999 0.976 0.970 0.973 0.963
500
U0 (µg L-1) 5.65 7.47 5.13 8.54 34.6 12.6 U0 (µg L-1) 9.42 12.0 8.11 12.3 43.8 14.8
Ka 0.811 1.10 0.845 0.391 0.416 0.485
D/r2 0.0821 0.109 0.0841 0.0333 0.0277 0.0284
Kb 0.0155 0.00700 0.0000688 0.0271 0.0507 0.0660
R2 0.983 0.999 0.998 0.964 0.979 0.977 R2 0.983 0.999 0.997 0.961 0.948 0.926
1000
U0 (µg L-1) 12.2 7.32 9.32 13.8 72.6 43.5 U0 (µg L-1) 17.1 10.5 13.7 21.05 90.1 54.0
Ka 0.866 0.532 0.844 0.418 0.442 0.518
D/r2 0.0720 0.0487 0.0794 0.0391 0.0285 0.0340
Kb 0.0319 0.000650 0.0000496 0.0211 0.0554 0.0556
R2 0.990 0.984 0.994 0.952 0.977 0.983 R2 0.982 0.983 0.995 0.956 0.941 0.946
2000
U0 (µg L-1) 16.2 6.97 9.96 29.9 143 125 U0 (µg L-1) 22.5 9.59 13.6 46.5 180 139
Ka 0.499 0.297 0.615 0.358 0.406 0.697
D/r2 0.0425 0.0250 0.0528 0.0351 0.0265 0.0399
Kb 0.0126 0.00683 0.00553 0.0144 0.0530 0.0706
R2 0.982 0.998 0.978 0.950 0.973 0.977 R2 0.982 0.984 0.980 0.960 0.941 0.914
3000
U0 (µg L-1) 14.4 6.57 12.9 49.4 202 238 U0 (µg L-1) 19.1 9.40 15.2 76.5 256 261
Ka 0.255 0.225 0.646 0.463 0.392 0.717
D/r2 0.0203 0.0203 0.0489 0.0436 0.0262 0.04044
Kb 0.00738 0.00605 0.00963 0.0237 0.0504 0.0713
R2 0.991 0.951 0.881 0.957 0.967 0.983 R2 0.980 0.959 0.888 0.959 0.938 0.919
5000
U0 (µg L-1) 13.4 6.97 10.6 96.2 296 497 U0 (µg L-1) 17.8 9.40 14.02 149 364 573
Ka 0.143 0.178 0.621 0.511 0.367 0.702
D/r2 0.0115 0.0148 0.0502 0.0493 0.0228 0.0430
Kb 0 0 0.0194 0.00848 0.0544 0.0634
[image:17.842.43.791.103.536.2]18
Table 3: Solubility products of selected U phases.
Mineral phase Dissolution reaction Log Ksp Reference
Swartzite
CaMgUO2(CO3)3.12(H2O) CaMgUO2(CO3)3(H2O)12 ⇆ Ca
2+ + Mg2+ + UO
22++ 3CO32- +12H2O -37.9 [41]
Bayleyite
Mg2UO2(CO3).18(H2O) Mg2UO2(CO3)3(H2O)18 ⇆ 2Mg 2+ +UO
22+ + 3CO32- + 18H2O -36.6 [41]
Liebigite
Ca2UO2(CO3)3.10(H2O) Ca2UO2(CO3)3(H2O)10 ⇆ 2Ca 2+ + UO
22+ + 3CO32- + 10H2O -36.9 [41]
Rutherfordine
UO2CO3 UO2CO3 ⇆ UO2
2+ + CO
32- -13.89 [41]
Metaschoepite
UO2(OH)2·2(H2O) 2H
+ +UO3(H2O)2 ⇆ UO22+ + 3H2O 5.52 [42]
Uranyl orthophosphate
(UO2)3(PO4)2.4(H2O) (UO2)3(PO4)2(H2O)4 ⇆ 3UO2 2+ + 2PO
43- + 4H2O -49.36 [43]
Uranyl hydrogen phosphate
UO2HPO4.(H2O)3 UO2HPO4.(H2O)3 ⇆ UO2
2+ + HPO
42- + 3H2O -13.17 [43]
Autunite
Ca(UO2)2(PO4)2.(H2O)3 Ca(UO2)2(PO4)2.(H2O)3 ⇆ Ca 2+ +2UO
19
Table 4: Adsorbed UVI (Uads; mg kg-1) and desorbability (%Udesorb; Eq.6) of U from biochar after 15 days contact at different pH and initial UVI concentrations (2, 3 and 5 mg L-1) calculated following four successive 24 h desorption cycles.
Added UVI pH
6 7 8 9
Uads %Udesorb Uads %Udesorb Uads %Udesorb Uads %Udesorb
mg L-1 mg kg-1 % mg kg-1 % mg kg-1 % mg kg-1 %
2 39.3 14 39.4 5.3 39.5 6.9 39.7 24
3 59.1 3.8 58.9 9.1 59.4 9.2 59.4 19
[image:19.595.67.537.151.279.2]20
Figure 1: Scanning electron micrographs of bone biochar.
Figure 2: Effect of pH and contact time on U concentration in biochar suspensions.
Lines represent optimnised fits of the reversible first order reaction model ــــــــــــ and spherical diffsion model --- fitted independently to data for each added UVI concentration: U0=0.1 mg L-1, U0=0.5 mg L-1, U0=1 mg L-1, U0=2 mg L-1, U0=3 mg L-1, U0=5 mg L-1.
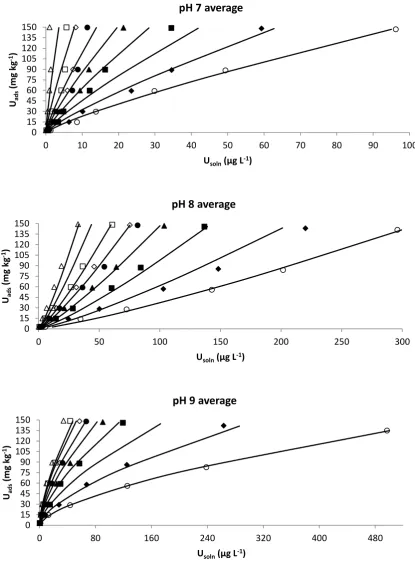
Figure 3: Zero time Freundlich isotherms at different pH ( pH= 7, pH= 8, pH= 9) predicted from reversible first order kinetics.
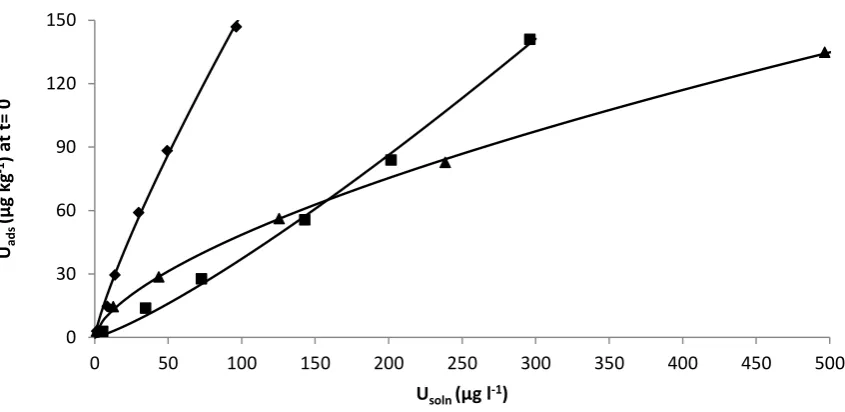
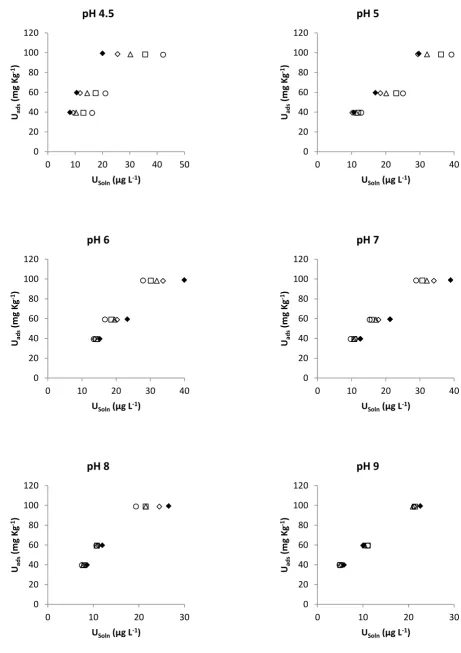
Figure 4: Time-dependent adsorption isotherms for UVI on biochar for equilibration times (days) of: zero (
•
), 1 ( ), 2 ( ), 3 ( ), 4 ( ), 5 ( ), 7 ( ), 15 ( ). Instantaneous adsorption (•
) was estimated from the ‘zero time’ Freundlich isotherm parameters (Figure 3); the model lines shown were calculated from average values of the reversible first-order kinetic model parameters ka and kb.Figure 5: U lability (%E-value) at different added UVI concentrations ( U0=2 mg L-1, U0=3 mg L-1, U0=5 mg L-1) as a function of total adsorbed UVI on biochar.
Figure 6: Uranium (UVI) desorbed from biochar at different pH values; = adsorption (15 days), and desorption = 1 day, = 2 days, = 3 days and = 4 days.
Figure 7: Stability diagram showing predicted solid phases formed during adsorption of
21
22 0 5 10 15 20 25
0 3 6 9 12 15
Usoln (µ g L -1) Time (Days)
pH 4.5
0 2 4 6 8 10 12 140 3 6 9 12 15
Usoln (µ g L -1) Time (Days)
pH 5
0 2 4 6 8 10 12 14 160 3 6 9 12 15
Usoln (µ g L -1) Time (Days)
pH 6
0 20 40 60 80 100 120 140 1600 3 6 9 12 15
Usoln (µ g L -1) Time (Days)
pH 7
0 50 100 150 200 250 3000 3 6 9 12 15
Usoln (µ g L -1) Time (Days)
pH 8
0 100 200 300 400 500 600 7000 3 6 9 12 15
Usoln (µ g L -1) Time (Days)
pH 9
Figure 2: Effect of pH and contact time on U concentration in biochar suspensions. Lines
[image:22.595.56.558.87.715.2]23
0 30 60 90 120 150
0 50 100 150 200 250 300 350 400 450 500
Uads
(µ
g
kg
-1)
at
t= 0
[image:23.595.89.512.97.303.2]Usoln (µg l-1)
24 0 15 30 45 60 75 90 105 120 135 150
0 10 20 30 40 50 60 70 80 90 100
Uads
(m
g k
g
-1)
Usoln(µg L-1)
pH 7 average
0 15 30 45 60 75 90 105 120 135 150
0 50 100 150 200 250 300
Uads
(m
g k
g
-1)
Usoln(µg L-1)
pH 8 average
0 15 30 45 60 75 90 105 120 135 150
0 80 160 240 320 400 480
Uads
(m
g k
g
-1)
[image:24.595.96.512.42.610.2]Usoln(µg L-1)
pH 9 average
25 0 20 40 60 80 100
0 1 2 3 4 5 6 7 8
238 U % E-val u e Time (d)
pH 4.5
0 20 40 60 80 1000 1 2 3 4 5 6 7 8
238 U % E-val u e Time (d)
pH 5
0 20 40 60 80 1000 1 2 3 4 5 6 7 8
238 U % E-val u e Time (d)
pH 6
0 20 40 60 80 1000 1 2 3 4 5 6 7 8
238 U % E-val u e Time (d)
pH 7
0 20 40 60 80 1000 1 2 3 4 5 6 7 8
238 U % E-val u e Time (d)
pH 8
0 20 40 60 80 1000 1 2 3 4 5 6 7 8
[image:25.595.73.528.101.671.2]238 U % E-val u e Time (d)
pH 9
26 0 20 40 60 80 100 120
0 10 20 30 40 50
Uads
(m
g Kg
-1)
USoln(µg L-1)
pH 4.5
0 20 40 60 80 100 1200 10 20 30 40
Uad s (m g K g -1)
USoln(µg L-1)
pH 5
0 20 40 60 80 100 1200 10 20 30 40
Uads
(m
g Kg
-1)
USoln(µg L-1)
pH 6
0 20 40 60 80 100 1200 10 20 30 40
Uad s (m g K g -1)
USoln(µg L-1)
pH 7
0 20 40 60 80 100 1200 10 20 30
Uads
(m
g Kg
-1)
USoln(µg L-1)
pH 8
0 20 40 60 80 100 1200 10 20 30
Uad s (m g K g -1)
USoln(µg L-1)
pH 9
[image:26.595.68.530.88.742.2]27
-20
-15
-10
-5
0
5
4.5
5.5
6.5
7.5
8.5
9.5
Log(UO
2
2+)
pH
Uranyl orthophosphate
Uranyl hydrogen phosphate
Rutherfordine
metaschopite
Autunite
Bayleyite
Liebigite
Swartzite
Figure 7: Stability diagram showing predicted solid phases formed during adsorption of uranyl
[image:27.595.50.488.66.533.2]28
Electronic Annex 1: Saturation indices of solid phases that may form during UVI adsorption on biochar.
pH Time
(d)
Swartzite CaMgUO2(CO3)3.12(H2O) Bayleyite Mg2UO2(CO3).18(H2O) Liebigite Ca2UO2(CO3)3.10(H2O) Initial concentration (mol L-1 x 10⁻⁶) of U in biochar suspension
0.42 2.10 4.20 8.40 12.6 21.0 0.42 2.10 4.20 8.40 12.6 21.0 0.42 2.10 4.20 8.40 12.6 21.0
4.5
1 -9.97 -9.30 -8.99 -8.81 -9.23 -8.74 -9.45 -8.77 -8.47 -8.31 -8.71 -8.22 -8.44 -7.75 -7.46 -7.28 -7.69 -7.21 2 -9.30 -8.99 -8.81 -9.23 -8.74 -10.94 -8.77 -8.47 -8.31 -8.71 -8.22 -10.41 -7.75 -7.46 -7.28 -7.69 -7.21 -9.41 3 -8.99 -8.81 -9.23 -8.74 -10.94 -10.23 -8.47 -8.31 -8.71 -8.22 -10.41 -9.70 -7.46 -7.28 -7.69 -7.21 -9.41 -8.69 4 -8.81 -9.23 -8.74 -10.94 -10.23 -9.88 -8.31 -8.71 -8.22 -10.41 -9.70 -9.36 -7.28 -7.69 -7.21 -9.41 -8.69 -8.36 5 -9.23 -8.74 -10.94 -10.23 -9.88 -9.51 -8.71 -8.22 -10.41 -9.70 -9.36 -8.99 -7.69 -7.21 -9.41 -8.69 -8.36 -7.97 7 -8.74 -10.94 -10.23 -9.88 -9.51 -9.29 -8.22 -10.41 -9.70 -9.36 -8.99 -8.79 -7.21 -9.41 -8.69 -8.36 -7.97 -7.78
5
1 -7.80 -6.51 -6.31 -6.33 -6.70 -6.21 -9.67 -8.36 -8.18 -8.21 -8.57 -8.06 -8.24 -6.95 -6.74 -6.74 -7.13 -6.66 2 -8.19 -7.35 -6.81 -6.74 -6.74 -6.54 -10.1 -9.20 -8.67 -8.61 -8.60 -8.39 -8.63 -7.80 -7.25 -7.16 -7.17 -6.99 3 -8.83 -7.88 -7.26 -7.03 -6.92 -6.88 -10.7 -9.73 -9.12 -8.90 -8.78 -8.72 -9.28 -8.33 -7.69 -7.46 -7.36 -7.33 4 -10.0 -8.43 -7.47 -7.16 -7.03 -6.66 -11.9 -10.3 -9.33 -9.04 -8.90 -8.51 -10.5 -8.89 -7.90 -7.58 -7.47 -7.11 5 -10.7 -8.41 -7.80 -7.19 -6.17 -6.84 -12.6 -10.3 -9.66 -9.07 -7.03 -8.68 -11.2 -8.86 -8.24 -7.62 -7.61 -7.29 7 -10.6 -8.32 -8.03 -7.24 -6.98 -6.96 -12.4 -10.2 -9.90 -9.13 -8.85 -8.82 -11.0 -8.76 -8.46 -7.66 -7.41 -7.41
6
1 -2.04 -1.80 -0.872 -0.794 -0.707 -0.953 -3.71 -3.40 -2.51 -2.45 -2.36 -2.61 -2.67 -2.50 -1.54 -1.44 -1.35 -1.60 2 -2.82 -1.91 -1.92 -1.50 -1.32 -1.60 -4.48 -3.49 -3.54 -3.14 -2.96 -3.25 -3.46 -2.62 -2.60 -2.16 -1.98 -2.26 3 -2.95 -1.90 -1.56 -0.382 -1.07 -1.51 -4.60 -3.48 -3.19 -1.02 -2.71 -3.15 -3.60 -2.62 -2.24 -2.04 -1.73 -2.17 4 -4.83 -2.35 -2.34 -1.74 -2.15 -2.29 -6.48 -3.93 -3.96 -3.38 -3.79 -3.93 -5.47 -3.06 -3.02 -2.41 -2.82 -2.95 5 -4.26 -2.95 -3.82 -2.34 -2.36 -1.66 -5.92 -4.53 -5.44 -3.97 -3.99 -3.30 -4.91 -3.67 -4.49 -3.00 -3.02 -2.31 7 -5.26 -2.51 -2.23 -2.36 -2.03 -1.18 -6.91 -4.10 -3.85 -4.00 -3.67 -2.83 -5.90 -3.23 -2.91 -3.02 -2.69 -1.84
7
1 -1.24 -0.445 -0.225 0.125 0.263 0.948 -2.77 -1.96 -1.73 -1.39 -1.28 -0.593 -2.02 -1.23 -1.02 -0.661 -0.490 0.189 2 -1.53 -0.704 -1.53 -0.153 -0.052 0.272 -3.04 -2.21 -4.02 -1.66 -1.59 -1.26 -2.33 -1.50 -1.34 -0.950 -0.819 -0.493 3 -1.68 -0.825 -0.629 -0.254 -0.185 0.068 -3.19 -2.33 -2.11 -1.75 -1.71 -1.46 -2.48 -1.62 -1.44 -1.06 -0.956 -0.700 4 -1.77 -0.911 -0.753 -0.368 -0.320 -0.200 -3.27 -2.41 -2.24 -1.87 -1.85 -1.73 -2.57 -1.71 -1.57 -1.17 -1.09 -0.972 5 -1.86 -1.00 -0.849 -0.452 -0.385 -0.346 -3.36 -2.50 -2.32 -1.95 -1.91 -1.87 -2.66 -1.81 -1.67 -1.26 -1.16 -1.12 7 -2.14 -1.16 -1.00 -0.603 -0.539 -0.509 -3.64 -2.66 -2.48 -2.11 -2.07 -2.04 -2.94 -1.96 -1.81 -1.40 -1.31 -1.27
8
1 -0.382 0.446 1.25 1.11 1.23 1.36 -1.61 -0.767 0.006 -0.072 0.022 0.108 -1.46 -0.640 0.186 -0.017 0.142 0.313 2 -0.573 0.221 0.490 0.815 0.993 1.16 -1.79 -0.983 -0.739 -0.361 -0.208 -0.077 -1.66 -0.875 -0.580 -0.309 -0.106 0.105 3 -0.768 0.084 0.362 0.747 0.877 1.05 -1.98 -1.12 -0.865 -0.422 -0.322 -0.196 -1.85 -1.02 -0.711 -0.384 -0.223 -0.014 4 -0.853 0.017 0.278 0.660 1.29 0.945 -2.06 -1.19 -0.952 -0.509 0.090 -0.293 -1.94 -1.08 -0.793 -0.471 0.186 -0.117 5 -0.951 -0.068 0.216 0.593 0.738 0.911 -2.16 -1.27 -1.00 -0.576 -0.455 -0.323 -2.04 -1.17 -0.863 -0.538 -0.368 -0.154 7 -1.07 -0.194 0.104 0.524 0.636 0.818 -2.28 -1.40 -1.12 -0.648 -0.559 -0.420 -2.15 -1.29 -0.968 -0.605 -0.468 -0.245
9
29
Electronic annex 1 cont’d.
pH Time
(d)
Autunite Ca(UO2)2(PO4)2.10H2O Metaschoepite UO3(H2O)2.2H2O Rutherfordine UO2CO3
Initial concentration (mol L-1 x 10⁻⁶) of U in biochar suspension
0.42 2.10 4.20 8.40 12.6 21.0 0.42 2.10 4.20 8.40 12.6 21.0 0.42 2.10 4.20 8.40 12.6 21.0
4.5
1 -1.03 0.435 1.06 1.58 1.65 1.76 -7.57 -6.84 -6.51 -6.30 -6.25 -6.19 -7.09 -6.37 -6.06 -5.87 -5.96 -5.76 2 -1.92 -0.490 0.229 1.14 1.48 1.56 -7.99 -7.29 -6.96 -6.50 -6.35 -6.29 -6.37 -6.06 -5.87 -5.96 -5.76 -7.69 3 -2.33 -0.848 -0.239 0.941 1.28 1.39 -8.19 -7.45 -7.15 -6.59 -6.41 -6.34 -6.06 -5.87 -5.96 -5.76 -7.69 -6.99 4 -3.33 -1.38 -0.567 0.199 1.15 1.31 -8.58 -7.72 -7.32 -6.95 -6.50 -6.38 -5.87 -5.96 -5.76 -7.69 -6.99 -6.65 5 -3.47 -1.69 -0.765 -0.147 0.761 1.29 -8.77 -7.89 -7.43 -7.14 -6.68 -6.41 -5.96 -5.76 -7.69 -6.99 -6.65 -6.22 7 -6.99 -2.04 -0.955 -0.532 0.319 1.10 -10.53 -8.09 -7.54 -7.36 -6.93 -6.52 -5.76 -7.69 -6.99 -6.65 -6.22 -6.06
5
1 -0.217 1.31 1.73 1.91 2.14 2.01 -6.80 -6.05 -5.86 -5.78 -5.66 -5.61 -6.5 -5.61 -5.41 -5.36 -5.40 -5.19 2 -1.29 0.302 1.35 1.74 1.82 1.90 -7.35 -6.52 -6.00 -5.84 -5.83 -5.69 -7.03 -6.19 -5.66 -5.53 -5.54 -5.37 3 -2.33 -0.469 0.956 1.38 1.54 1.45 -7.81 -6.92 -6.17 -5.98 -5.90 -5.87 -7.54 -6.64 -5.91 -5.71 -5.63 -5.58 4 -4.60 -1.39 0.085 1.21 1.16 1.41 -8.94 -7.35 -6.65 -6.10 -6.13 -5.93 -8.68 -7.09 -6.32 -5.84 -5.82 -5.57 5 -6.09 -1.50 -0.196 1.04 1.32 1.56 -9.72 -7.42 -6.79 -6.20 -5.91 -5.87 -9.46 -7.15 -6.52 -5.93 -5.64 -5.59 7 -6.06 -1.91 -0.825 0.424 1.00 1.19 -9.72 -7.63 -7.09 -6.51 -6.24 -6.06 -9.43 -7.27 -6.82 -6.17 -5.90 -5.78
6
1 -0.360 2.36 1.41 1.73 2.04 2.19 -5.55 -4.11 -4.71 -4.46 -4.36 -4.29 -5.08 -4.05 -4.13 -3.94 -3.85 -3.88 2 0.088 1.53 2.07 2.68 3.10 2.91 -5.24 -4.44 -3.90 -3.90 -3.72 -3.88 -5.13 -4.31 -3.91 -3.81 -3.62 -3.81 3 -2.89 -0.617 0.139 0.992 1.37 1.13 -6.57 -5.36 -5.12 -4.35 -4.46 -4.65 -6.04 -4.90 -4.63 -3.95 -4.02 -4.28 4 -6.17 -1.13 -1.07 0.339 1.50 1.46 -8.19 -5.58 -5.68 -4.90 -4.38 -4.53 -7.75 -5.19 -5.25 -4.53 -4.33 -4.48 5 -2.87 -0.422 0.162 0.938 1.05 1.27 -6.49 -5.18 -6.00 -4.55 -4.43 -3.85 -6.44 -5.14 -5.95 -4.51 -4.42 -3.81 7 -5.13 -1.27 -0.709 0.555 -0.080 2.16 -7.59 -5.56 -5.40 -4.71 -5.07 -4.08 -7.52 -5.26 -5.05 -4.64 -4.77 -3.83
7
1 -8.12 -6.15 -5.72 -0.508 -3.98 -2.14 -7.75 -6.81 -6.59 -3.89 -5.83 -4.78 -7.53 -6.62 -6.43 -4.50 -5.74 -4.80 2 -5.52 -3.20 -8.25 -2.56 -1.55 -0.665 -6.10 -5.07 -7.68 -4.77 -4.39 -4.02 -6.50 -5.55 -7.75 -5.17 -4.88 -4.53 3 -8.71 -6.80 -6.31 -5.87 -4.98 -4.14 -7.65 -6.74 -6.53 -6.30 -6.01 -5.57 -7.57 -6.68 -6.49 -6.22 -5.99 -5.62 4 -8.69 -6.80 -6.39 -5.75 -1.57 -4.78 -7.66 -6.72 -6.57 -6.23 -4.26 -5.99 -7.61 -6.72 -6.57 -6.20 -4.87 -5.99 5 -5.02 -3.23 -2.92 -3.21 -1.89 -1.80 -5.74 -4.86 -4.77 -4.86 -4.37 -4.33 -6.38 -5.50 -5.40 -5.32 -4.99 -4.94 7 -9.26 -7.22 -6.56 -6.29 -2.29 -5.14 -8.05 -7.03 -6.80 -6.64 -4.74 -6.19 -8.03 -7.02 -6.82 -6.59 -5.30 -6.26
8
1 -9.93 -8.22 -6.83 -6.41 -6.98 -5.40 -6.83 -5.94 -5.22 -5.18 -5.51 -4.70 -7.48 -6.60 -5.87 -5.89 -6.06 -5.49 2 -6.92 -5.00 -3.63 -0.721 -3.01 -2.16 -5.22 -4.21 -3.71 -1.30 -3.12 -2.90 -6.48 -5.52 -5.10 -3.33 -4.54 -4.37 3 -9.78 -8.99 -4.71 -6.52 -6.79 -6.69 -6.76 -5.76 -3.49 -5.10 -4.86 -4.93 -7.54 -6.57 -4.91 -5.93 -5.73 -5.73 4 -11.3 -8.11 -9.64 -6.74 -6.84 -8.44 -6.97 -5.98 -6.03 -5.26 -5.02 -5.30 -7.72 -6.77 -6.72 -6.08 -5.72 -6.03 5 -13.8 -10.1 -13.3 -5.42 -8.71 -3.03 -7.22 -6.22 -6.14 -3.77 -5.64 -3.43 -7.92 -6.96 -6.80 -5.11 -6.31 -4.79 7 -6.99 -8.58 -8.31 -7.31 -7.40 -7.12 -5.79 -6.56 -6.41 -5.97 -5.97 -5.87 -7.04 -7.25 -7.06 -6.63 -6.59 -6.48
9
30
References
[1] J. Popp, Z. Lakner, M. Harangi-Rákos, M. Fári, The effect of bioenergy expansion: Food, energy, and environment, Renewable and Sustainable Energy Reviews, 32 (2014) 559-578.
[2] M. Ahmad, A.U. Rajapaksha, J.E. Lim, M. Zhang, N. Bolan, D. Mohan, M. Vithanage, S.S. Lee, Y.S. Ok, Biochar as a sorbent for contaminant management in soil and water: a review, Chemosphere, 99 (2014) 19-33.
[3] S. Kumar, V.A. Loganathan, R.B. Gupta, M.O. Barnett, An Assessment of U(VI) removal from groundwater using biochar produced from hydrothermal carbonization, Journal of environmental management, 92 (2011) 2504-2512.
[4] J.M. Novak, I.X. Lima, Baoshan; , J.W. Gaskin, C. Steiner, K.C. Das, M. Ahmedna, D. Rehrah, D.W. Watts, W.J. Busscher, H. and Schomberg, Characterization of designer biochar produced at different temperatures and their effects on a loamy sand, Annals of Environmental Science, 3 (2009) 195-206.
[5] Z. Liu, F.-S. Zhang, J. Wu, Characterization and application of chars produced from pinewood pyrolysis and hydrothermal treatment, Fuel, 89 (2010) 510-514.
[6] C. Wang, M.T. Walter, J.Y. Parlange, Modeling simple experiments of biochar erosion from soil, Journal of Hydrology, 499 (2013) 140-145.
[7] J.H. Park, G.K. Choppala, N.S. Bolan, J.W. Chung, T. Chuasavathi, Biochar reduces the bioavailability and phytotoxicity of heavy metals, Plant and Soil, 348 (2011) 439-451.
[8] Z. Liu, F.S. Zhang, Removal of lead from water using biochars prepared from hydrothermal liquefaction of biomass, Journal of Hazardous Materials, 167 (2009) 933-939.
[9] M. Uchimiya, I.M. Lima, K. Thomas Klasson, S. Chang, L.H. Wartelle, J.E. Rodgers, Immobilization of heavy metal ions (CuII, CdII, NiII, and PbII) by broiler litter-derived biochars in water and soil, Journal of agricultural and food chemistry, 58 (2010) 5538-5544.
[10] M. Inyang, B. Gao, Y. Yao, Y. Xue, A.R. Zimmerman, P. Pullammanappallil, X. Cao, Removal of heavy metals from aqueous solution by biochars derived from anaerobically digested biomass, Bioresource technology, 110 (2012) 50-56.
[11] N. Borchard, K. Prost, T. Kautz, A. Moeller, J. Siemens, Sorption of copper (II) and sulphate to different biochars before and after composting with farmyard manure, European Journal of Soil Science, 63 (2012) 399-409.
[12] F. Rees, M.O. Simonnot, J.L. Morel, Short-term effects of biochar on soil heavy metal mobility are controlled by intra-particle diffusion and soil pH increase, European Journal of Soil Science, 65 (2014) 149-161.
[13] Z.-b. Zhang, X.-h. Cao, P. Liang, Y.-h. Liu, Adsorption of uranium from aqueous solution using biochar produced by hydrothermal carbonization, Journal of Radioanalytical and Nuclear Chemistry, 295 (2012) 1201-1208.
[14] L. Field, T. Barnie, J. Blundy, R.A. Brooker, D. Keir, E. Lewi, K. Saunders, Integrated field, satellite and petrological observations of the November 2010 eruption of Erta Ale, Bulletin of Volcanology, 74 (2012) 2251-2271.
[15] N.J. Nnaji, J.U. Ani, A.M. and Ekwonu, The solution of reversible first order reaction equation revisited, Acta Chimica & Pharmaceutica Indica, 3 (2013) 212-218.
[16] L.M. Brown, H.S. Sherry, F.J. Krambeck, Mechanism and kinetics of isotopic exchange in zeolites. I. Theory, The Journal of Physical Chemistry, 75 (1971) 3846-3855.
[17] W.H. Shetaya, S.D. Young, M.J. Watts, E.L. Ander, E.H. Bailey, Iodine dynamics in soils, Geochimica et Cosmochimica Acta, 77 (2012) 457-473.
31
[19] J.B. Cliff, P.J. Bottomley, R. Haggerty, D.D. and Myrold, Modeling the effects of diffusion limitations on nitrogen-15 isotope dilution experiments with soil aggregates, Soil Science Society of America Journal, 66 (2002) 1868–1877.
[20] S. Altfelder, T. Streck, Capability and limitations of first-order and diffusion approaches to describe long-term sorption of chlortoluron in soil, Journal of contaminant hydrology, 86 (2006) 279-298.
[21] I.R. Iznaga, V. Petranovskii, G.R. Fuentes, C. Mendoza, A.B. Aguilar, Exchange and reduction of Cu2+ ions in clinoptilolite, Journal of Clloid and Interface Science, 316 (2007) 877-886.
[22] E. Costa, G. Calleja, F. Domingo, Adsorption of gaseous hydrocarbons on activated carbon: Characteristic kinetic curve, AIChE Journal, 31 (1985) 982-991.
[23] A. Mittal, L. Kurup, V.K. Gupta, Use of waste materials—Bottom Ash and De-Oiled Soya, as potential adsorbents for the removal of Amaranth from aqueous solutions, Journal of Hazardous Materials, 117 (2005) 171-178.
[24] E.R. Marzouk, S.R. Chenery, S.D. Young, Measuring reactive metal in soil: a comparison of multi-element isotopic dilution and chemical extraction, European Journal of Soil Science, 64 (2013) 526-536.
[25] Z.-Y. Huang, T. Chen, J. Yu, X.-C. Zeng, Y.-F. Huang, Labile Cd and Pb in vegetable-growing soils estimated with isotope dilution and chemical extractants, Geoderma, 160 (2011) 400-407.
[26] R.E. Hamon, D.R. Parker, E. Lombi, Advances in Isotopic Dilution Techniques in Trace Element Research: A Review of Methodologies, Benefits, and Limitations, in: Isotopic Dilution Book Advances in Agronomy (Advances in Agronomy), 2008.
[27] I.A.M. Ahmed, N.M.J. Crout, S.D. Young, Kinetics of Cd sorption, desorption and fixation by calcite: A long-term radiotracer study, Geochimica et Cosmochimica Acta, 72 (2008) 1498-1512.
[28] R. Han, W. Zou, Y. Wang, L. Zhu, Removal of uranium(VI) from aqueous solutions by manganese oxide coated zeolite: discussion of adsorption isotherms and pH effect, Journal of environmental radioactivity, 93 (2007) 127-143.
[29] X. Shuibo, Z. Chun, Z. Xinghuo, Y. Jing, Z. Xiaojian, W. Jingsong, Removal of uranium (VI) from aqueous solution by adsorption of hematite, Journal of environmental radioactivity, 100 (2009) 162-166.
[30] G. Wang, J. Liu, X. Wang, Z. Xie, N. Deng, Adsorption of uranium (VI) from aqueous solution onto cross-linked chitosan, Journal of Hazardous Materials, 168 (2009) 1053-1058.
[31] S. Lofts, E. Tipping, Assessing WHAM/Model VII against field measurements of free metal ion concentrations: model performance and the role of uncertainty in parameters and inputs, Environmental Chemistry, 8 (2011) 501-516.
[32] J.S. Arey, J.C. Seaman, P.M. Bertsch, Immobilization of Uranium in Contaminated Sediments by Hydroxyapatite Addition, Environmental science & technology, 33 (1999) 337-342.
[33] B. Ozkaya, Adsorption and desorption of phenol on activated carbon and a comparison of isotherm models., Journal of Hazardous Materials, 129 (2006) 158-163. [34] M.J. Beazley, R.J. Martinez, P.A. Sobecky, S.M. Webb, M. Taillefert, Uranium Biomineralization as a Result of Bacterial Phosphatase Activity: Insights from Bacterial Isolates from a Contaminated Subsurface, Environmental Science and Technology, 41 (2007) 5701-5707.
[35] C.C. Fuller, J.R. Bargar, J.A. Davis, M.J. Piana, Mechanisms of uranium interaction with hydroxyapatite: Implications for groundwater remediation, Environmental Science & Technology, 36 (2002) 158-165.
[36] A. Singh, J.G. Catalano, U. Kai-Uwe, D.E. Giammar, Molecular-scale structure of uranium(VI) immobilized with goethite and phosphate, Environmental Science & Technology, 46 (2012) 6594-6603.
32
[38] V.S. Mehta, F. Maillot, Z. Wang, J.G. Catalano, D.E. Giammar, Effect of reaction pathway on the extent and mechanism of uranium(VI) immobilization with calcium and phosphate. , Environmental Science & Technology, 50 (2016) 3128-3136.
[39] J.Y. Lee, J.I. Yun, Formation of ternary CaUO2(CO3)32- and Ca2UO2(CO3)3(aq) complexes under neutral to weakly alkaline conditions, Dalton Transactions, 42 (2013) 9862-9869.
[40] J.R. Bargar, R. Reitmeyer, J.J. Lenhart, J.A. Davis, Characterization of U(VI)-carbonato ternary complexes on hematite: EXAFS and electrophoretic mobility measurements, Geochimica et Cosmochimica Acta, 64 (2000) 2737-2749.
[41] D. Gorman-Lewis, P.C. Burns, J.B. Fein, Review of uranyl mineral solubility measurements, The Journal of Chemical Thermodynamics, 40 (2008) 335-352.
[42] D. Gorman-Lewis, J.B. Fein, P.C. Burns, J.E.S. Szymanowski, J. Converse, Solubility measurements of the uranyl oxide hydrate phases metaschoepite, compreignacite, Na– compreignacite, becquerelite, and clarkeite, The Journal of Chemical Thermodynamics, 40 (2008) 980-990.