University of Warwick institutional repository
This paper is made available online in accordance with publisher policies. Please scroll down to view the document itself. Please refer to the repository record for this item and our policy information available from the repository home page for further information.
To see the final version of this paper please visit the publisher’s website. Access to the published version may require a subscription.
Author(s): Rosalind S. Hunter Andrew J. Oswald and Bruce G. Charlton
Article Title: The Elite Brain Drain Year of publication: 2009
Link to published version: http://dx.doi.org/10.1111/j.1468-0297.2009.02274.x
The Elite Brain Drain
Rosalind S. Hunter Andrew J. Oswald Bruce G. Charlton
DISCUSSION P
APER SERIES
The Elite Brain Drain
Rosalind S. Hunter
University of Warwick
Andrew J. Oswald
University of Warwick and IZA
Bruce G. Charlton
University of Newcastle
Discussion Paper No. 4005
February 2009
IZA
P.O. Box 7240 53072 Bonn
Germany
Phone: +49-228-3894-0 Fax: +49-228-3894-180
E-mail: [email protected]
Anyopinions expressed here are those of the author(s) and not those of IZA. Research published in this series may include views on policy, but the institute itself takes no institutional policy positions.
The Institute for the Study of Labor (IZA) in Bonn is a local and virtual international research center and a place of communication between science, politics and business. IZA is an independent nonprofit organization supported by Deutsche Post Foundation. The center is associated with the University of Bonn and offers a stimulating research environment through its international network, workshops and conferences, data service, project support, research visits and doctoral program. IZA engages in (i) original and internationally competitive research in all fields of labor economics, (ii) development of policy concepts, and (iii) dissemination of research results and concepts to the interested public.
ABSTRACT
The Elite Brain Drain
*We collect data on the movement and productivity of elite scientists. Their mobility is remarkable: nearly half of the world’s most-cited physicists work outside their country of birth. We show they migrate systematically towards nations with large R&D spending. Our study cannot adjudicate on whether migration improves scientists’ productivity, but we find that movers and stayers have identical h-index citations scores. Immigrants in the UK and US now win Nobel Prizes proportionately less often than earlier. US residents’ h-indexes are relatively high. We describe a framework where a key role is played by low mobility costs in the modern world.
JEL Classification: O3, J6
Keywords: mobility, science, brain drain, citations
Corresponding author:
Andrew J. Oswald
Department of Economics University of Warwick Coventry CV4 7AL United Kingdom
E-mail: [email protected]
*
The Elite Brain Drain
Where scientific enquiry is stunted, the intellectual life of a nation dries up, which means the withering of many possibilities of future development... Einstein (1934, p.30)
1. Introduction
This study is an analysis of the international movement and productivity levels of elite
research scientists. We begin with data on Nobel Prizes. We then construct a data set
on the world’s most highly-cited physicists. Although our sample, of 158 people, is
inevitably a small one, the individuals covered within it seem of particular interest.
The paper discusses the conceptual implications of the observed empirical patterns.
We attempt to address questions such as the following [and give brief answers
in parentheses]:
How mobile are the world’s top research scientists, and do they
migrate disproportionately to the richest countries? [Very; yes]
Are elite movers more productive, on average, than elite stayers? [No] How -- in the spirit of Freeman (2006) -- might the new world of
globalization be expected to influence nations’ across-person
productivity distributions? [To make them more similar]
Are physicists who migrate to the United States more productive than
home-grown US physicists? [No]
While there is a large literature on the brain drain1,few researchers have looked at
migration among world-class scientists.
To anticipate results to come, it is shown that nearly half of the elite physicists
in our sample no longer work in the country in which they were born, that the major
per-capita importers are the US and Switzerland, and that (at least within this sample
of unusually highly-cited people) migrants and non-migrants have similar
productivities as measured by citations h-indexes. Those in the sample who move
from Europe to the US go on to be neither more nor less distinguished than
1
born elite physicists. One way to make sense of all these patterns, we argue, drawing
partly upon a simple formal model, is that in a world with low mobility costs the
distribution of talent can be expected to be similar across different countries.
More broadly, this paper relates to policy issues discussed in, for example, a
recent 2007 editorial in Nature, and a literature on the competitiveness of European
and US economics and science (Levin and Stephan 1999; Machin and Oswald 2000;
Regets 2001; Royal Society 1963; Oswald 2007b, 2009; Summers 2007; UUK 2007).
Those persuaded by a sanguine view of international brain ‘circulation’, rather than
drain, may wish to know that our later data paint largely a one-way picture, and one
disproportionately towards the United States.
2. Theoretical Issues
Consider a world in which scientists vary in their innate ability and productivity. Let
a person’s productivity be q, which for simplicity here is defined to lie between 0 and
1. We can think of Nobel Prize winners, say, as having a level of q that is close to the
upper bound of unity.
Assume the talent distribution is described by a density function f(q). Among
‘elite’ scientists, define a cut-off minimum threshold of quality, given by q*. Assume
that such scientists can choose whether or not to move to a new country. This
receiving country is rich, by assumption, and will pay a percentage wage premium, p,
compared to the home country.
There is a cost of movement, c. The model will be a timeless one, but this cost
could be thought of as a continuing one per-unit-of-time. It might, for instance, be
viewed as, in part, capturing any continuing cultural and personal cost caused by
living outside one’s nation of birth.
The net utility levels of individuals are taken to be given by a simple additive
form:
Utility of a mover = (1+p)q – c (1)
Utility of a stayer = q (2)
(1+p)q – c – q = pq – c > 0. (3)
The productivities, on average, of the movers and stayers can then be
calculated. The average productivity of elite migrants is
∫
∫
= 1 / 1 / ) ( / ) ( pc c p
dq q f dq q qf
M (4)
By contrast, the average productivity of stayers (in the country to which the migrants
are moving), who are drawn partially from a different segment of the talent
distribution, is
∫
∫
= 1 * 1 * ) ( / ) ( q q dq q f dq q qfS (5)
The difference in mean productivities is therefore
S M q p c D
D= ( , , *)= − (6)
and it can be checked that D(c, p, q*) is an increasing function of the mobility cost c,
and equivalently a decreasing function of the premium p, so that for example:
0 ) ( / ) ( 1 / 1 / ≥ − = + − = ∂ ∂
∫
∫
cpM dq q f dq q qf p c c D p
c c p
(7)
If the cost of mobility and the premium are both positive, then in a large class
of cases:
D(c, p, q*) > 0 (8)
and the quality of movers, on average, will exceed the quality of stayers. This is
Put into words, if it is extremely costly to leave one’s country, only absolutely
outstanding scientists will find it worth their while. Such people will then stand out in
ability among those of their adopted nation. When the costs of international mobility
are sufficiently low, however, elite migrants and elite non-migrants come from
approximately the same section of the underlying talent distribution, and they will
therefore have similar observed productivity levels. In this case, as c declines, the
difference D approaches zero.
Kwok and Leland (1982) also allow for distributions of ability in the two
countries; but they assume the existence of asymmetric information, and conclude that
in equilibrium the average productivity of movers will always exceed that of those
workers who stay. We later try to check that empirically. New work on the theory of
the brain drain, and how an optimizing government should act, includes Egger et al
(2007) and Ionescu and Polgreen (2009).
3. Earlier Evidence
Levin and Stephan (1991) gathered data on the age and publishing
productivity of PhD scientists in American institutions. The authors examined six
scientific specialities.2,3 They used four different measures for productivity4 and found
that in five out of the six specialities -- particle physics being the exception -- an
increase in age significantly reduced the level of productivity when controlling for
ability and motivation etc. Weinberg and Galenson (2005) analysed the optimal
productivity age of Nobel Prize winning economists. They concluded that
experimental and applied economists peaked later in life, possibly due to accrued
knowledge over time. In contrast, theoretical economists did their best work early.
Carayol and Matt (2005) combined both individual and collective factors to analyse
influences on productivity. They studied more than a thousand faculty members at
Louis Pasteur University. Dietz and Bozeman (2005) looked at scientists’ inter-sector
job movements within the US. They surveyed 1,200 scientists, from various fields,
with 5,490 career moves between them. The authors showed that job transfers were
2
Three in physics (solid state/condensed matter physics, particle physics, and atomic and molecular physics) and three in Earth Science (oceanography, geophysics, and geology).
3
Defined by Laudel (2003, p.218) as “a community of scientists who directly or indirectly interact in the production of new knowledge about a common subject matter”.
4
associated with higher productivity. However, they could not prove a causal
relationship. Laudel (2003) used bibliometric methods (analysing patterns in
publications) to investigate the movement of elite scientists. Laudel (2005) extended
her previous paper, examining the brain drain of elite scientists. She studied two
different specialities, angiotensin and vibrational spectroscopy, and generated three
important conclusions. First, micro-level studies may identify brain drain effects
which macro studies do not, because migration flows can counteract each other.
Second, some specialities have much higher levels of migration than others. Finally,
migration generally occurs young, and before scientists have gained ‘elite’ status.
In the work closest to our own, Ioannidis (2004) took a cross-section of 1,523
scientists, including 46 physicists, from the Institute of Scientific Information’s (ISI)
Highly Cited Researcher scientist lists. Although the database had many missing
observations (because of non-completion by the majority of individuals), the author
was able to analyse the patterns in scientists’ countries of birth and their current
country affiliations. There was great variation across scientific fields. On an aggregate
level he found that approximately one third had migrated, and that three-quarters of
this third had migrated to the US. Ioannidis argues that although migration may be
good for science, because it exposes scientists to new ways of thinking, when one
country experiences the majority of the net in-flows the other countries experience a
damaging brain drain. He argues that for most fields, excluding those with highly
specialised expensive equipment such as nuclear physics, keeping a small network of
scientists, a critical mass, in a country is important if the field is not to stagnate.
The previous literature identifies factors correlated with scientists’
productivity. Our paper is a (retrospective) study of scientists’ mobility. It is difficult
to say what in the counter-factual case would have happened to the productivity of
each physicist who migrated/remained. Hence this paper cannot conclusively address
the question: how does migration affect a person’s productivity? Nor can we measure
directly how scientists create externalities upon colleagues, although common sense
and sources such as Laband and Tollison (2003) suggest they will. Yet Waldinger
(2008), using a natural experiment, finds spillover effects only on to coauthors rather
than mere departmental colleagues.
This paper provides new data and inquires into the nature of the productivity
distribution -- across different scientists within a nation -- that we would expect to see
4. Data on US and UK Winners of Nobel Prizes
There is an anecdotal view that in the modern world the Unites States acts as a giant
funnel of scientific talent. We document facts consistent with that claim.
We begin by recording the extent of the decline in the ratio of UK/US Nobel
Prizes in science. The results are presented in Table 1. By using biographies and
autobiographies on the official Nobel Prize web pages
(http://nobelprize.org/nobel_prizes/lists/all), we initially examined data since World
War II on all Nobel prize-winners in science broadly defined (physics, chemistry,
physiology/ medicine; and economics since 1969). To do so, we treated the national
affiliation of each laureate in the same way as the Nobel committee – which assigns
the working address of the laureate at the time the prize is awarded. However, official
biographies are of varying clarity and completeness, and sometimes it was not
possible to be sure of a laureate’s educational experience, or to allocate the national
provenance of a prize (for example, when the laureate was retired at the time of
award, worked in several countries or worked at an international laboratory such as
CERN). Such laureates are omitted from the tabulation. As a referee has pointed out,
our approach assumes that the selection criterion for winning Nobels has remained the
same through time.
Table 1 shows the proportions of US relative to UK laureates for each of three
20-year segments. The data are for the period 1947-2006. For the first third of the
period, 1947-66, the UK was a successful Nobel prize-winning nation. It gained
nearly half the number of prizes of the US. Over the past 60 years the population of
the US has approximately doubled from 150 million to 300 million while the UK
population has only increased about 20 percent from 50 million to 60 million. But
UK success in winning Nobel science prizes has sharply declined both in relative US:
UK terms over the whole period and in absolute numbers of UK laureates over the
past 20 years.
A much fuller analysis of UK is provided in the new work of Weinberg
(2009).
It may be assumed that a dominant scientific nation will attract high-quality
scientists who did their university education elsewhere, then migrated either to the US
or UK, where they eventually received a Nobel prize. The row in Table 1 ‘Immigrant
after first degree’ gives the number of US or UK laureates who moved to the US or
UK after they did their first college degree or equivalent; while the row ‘Immigrated
after doctorate’ shows the US or UK laureates who had come to the country, where
they later won the Nobel prize after completing their doctorate (PhD or an equivalent
such as a medical degree). ‘Proportion of immigrant laureates’ is the total immigrant
laureates (both after college and doctorate) expressed as a percentage of the total
number of laureates. The proportion of immigrant laureates represents an approximate
measure of a country’s power to attract the best (potential Nobel-prize-winning)
scientists.
These data reveal that in the past 20 years the UK has lost its previous ability
to attract future Nobel-prize-winning scientists from elsewhere. There is also evidence
of a decline in the percentage of immigrant laureates in the USA: immigrants are now
only 19 percent of total laureates. Considering the overwhelming dominance of the
US in winning Nobel prizes during 1987-2006, the number of immigrant laureates
might have been expected to increase. That this has not happened may indicate signs
of increasing parochialism in US science, or perhaps increasing bureaucratic barriers
preventing the easy movement of top class scientists into the US. It should be said,
however, that the lags between doing the work and receiving the prize make it
difficult to say.
Table 1’s row ‘UK to US migration’ shows the number of scientists during a
20-year segment who were educated in the UK but then migrated to the USA and
eventually were awarded a Nobel prize. (The reverse situation did not happen during
the past 60 years – i.e. by the above definitions there were no UK laureates who had
migrated from the USA). This number may be an approximate measure of the greater
attractiveness of the US compared to the UK as a place of residence and work for the
highest quality scientists. This suggests that the US has become more attractive to
UK-educated scientists over the past 60 years. In 1987-2006, for example, five out of
fourteen of all UK-educated laureates had moved to the USA by the time they won
the Nobel prize.
We now draw upon data on elite physics researchers.
In our analysis, the numbers of physicists in each country at first degree and
the number currently affiliated are measured, and the net gain for each country can
then be established. This is then normalised for population size (source: OECD
Statistics). Country of first degree is used rather than country of birth.Each country’s
net gain is then compared to measures of its wealth to assess if there is a correlation.
There are several ways to calculate a scientist’s career productivity. They
include the total number of publications, average citations per paper, and total
citations. This paper uses a particular citations measure, the h-index. The h-index was
proposed by Hirsch (2005), who is a physicist by profession, as an attempt to
“quantify the cumulative impact and relevance” of an individual’s scientific research
output (Hirsch 2005, p.16,568). The measure incorporates a flavour of both quality
and quantity of publications. Inevitably, the use of a single measure has disadvantages
as well as advantages (Henrekson and Waldenstrom, 2007).
By definition, an h-index of x means that a scientist has x number of papers
with x or more citations. This is calculated by ranking a physicist’s papers from the
most-cited to the least-cited and then descending down the list until the rank of a
paper becomes greater than or equal to the number of citations to that paper. The rank
of this marginal paper is the h-index.
Like other measures of productivity, the h-index has drawbacks. First, it is
affected by career length. Second, although a high h-index typically signifies a
high-quality scientist, the reverse is not always true (Hirsch 2005, p.16,571); a scientist
with only a few highly cited papers may have a fairly low h-index no matter how
important the papers. Third, citations may always not capture a physicist’s true impact
if there is a bias towards English-language journals (Van Leeuwen et. al. 2001). The
h-index also does not account for the number of co-authors on each paper. Hirsch
(2005, p.16,574) suggests a normalization of the h-index for the number of
co-authors; however, as discussed by Laudel (2003, p.221), there is no easy way of
establishing the relative levels of contribution for each co-author. Normalization
would underestimate the output of those who gave a high proportion of the input but
with a large number of co-authors and vice versa. Accordingly, the h-index here is not
6. The Sample of Physicists
Our main sample is drawn from www.isihighlycited.com. We take the ISI list of
physicists, which contained at the time of data collection the names of the 272
most-cited scientists writing in physics journals between 1981 and 1999. Laudel (2003,
p.219) argues that the ISI’s subject groupings are not sufficiently broken down into
specialities, and therefore that in-depth analysis of ‘cause and consequences’ of
migration cannot be analysed. However, data on these factors, such as R&D funding,
do not have sufficient coverage over physics, let alone its specialities, for that depth of
analysis to be undertaken.
The data-collection process took some time. We searched for biographical
and bibliometric information on each of the 272 listed highly-cited physicists. We
particularly wished to determine career movements and overall career productivity.
For each person, their year and place of birth, of first degree, and of PhD, were
recorded. So was country of current affiliation. Data were initially gathered from the
ISI website and then from physicists’ own web-pages. This was followed by a further
search of the internet. To gather further information beyond what was available
through the web, emails were sent to 146 physicists where their email addresses could
be identified. Of these, 63 replied.
In this way, we eventually compiled a data set on 158 highly-cited physicists.
However, we obtained data on their first degrees for only 150 of them. Other
aggregate data, on countries of origin and of current affiliation, were collected from
OECD Statistics. The data for variables such as GDP were averaged between 1970
and 2006 to cover the main period during which the physicists were active. Data were
available for 21 countries5. In order to maintain consistency, data for the missing
countries6 were not collected from other sources
Our physicists currently live in 16 different countries. This produced some
language difficulties for us. We could read websites well only in English or Italian.
We used some online translators. Emails were sent in English. To examine a possible
bias towards English speaking countries, the proportions of the final 158 physicists
can be compared to those of the original 272. The extent of bias seems small. The
5
Australia, Austria, Canada, Denmark, Finland, France, Germany, Greece, Hungary, Ireland, Italy, Japan, Korea, New Zealand, Poland, Spain, Sweden, Switzerland, Turkey, UK and USA
6
USA, however, appears to be overrepresented, and Japan to be underrepresented.
There is no clear way to solve this problem -- our response rate (43%) is similar to
those of previous studies (Laudel 2003, p.224) -- although it is considered later.
The next issue was how to calculate productivity levels. We decided to focus
on citations rather than numbers of publications7. The ISI Web of Knowledge was
used to calculate the h-index. This required us to identify each physicist’s publication
list, which can be problematic when some physicists have the same surname. We
decided to consider each individual separately. In many cases, initial inspection
showed no problems; physicists had identified how many papers they had published.
However, sometimes further examination of the names used on published papers and
the institutions worked for had to be undertaken. In two cases, we had such
difficulties distinguishing names that the physicists had to be removed from the
sample. One advantage of working with the h-index is that the probability of a second
physicist with the same surname and initials appearing within the relatively small
selection of papers which affect an h-index score is lower than occurs when using data
on an entire list of publications. Of the sample of 158 physicists, 1 is female, and 8
have won Nobel prizes. A referee has pointed out that 8 seems a small number given
this distinguished group, but presumably some of these scientists will win the prize in
the future. The majority, 61.4%, have worked in multiple countries, and 97.5% have
worked in multiple institutions. Currently 76% are affiliated to a university; 17% to
other types of public institutions; and 7% are in private institutions. Regarding the
span of their careers, 96% have, at some point, worked in academia since their PhD;
54% have experienced another type of public institution; and 47% have spent a period
in the private sector. The mean number of institutions worked in is 6.03. The mean
number of countries worked in is 2.41.
7. Migration and Productivity
These physicists were born in 32 different countries. They studied for their first
degree in 30 different countries; they did PhDs in 22 countries; and they are presently
located in only 16 countries. Hence the data show a kind of ‘funnelling’ effect of
7
approximately 50% from birth: people from 32 nations now reside in half that
number.
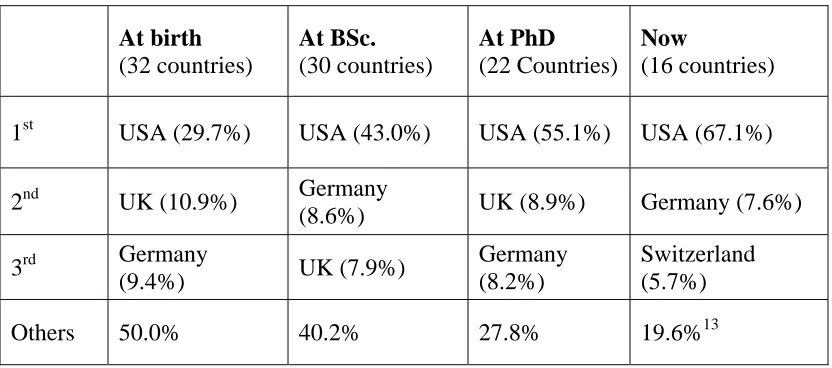
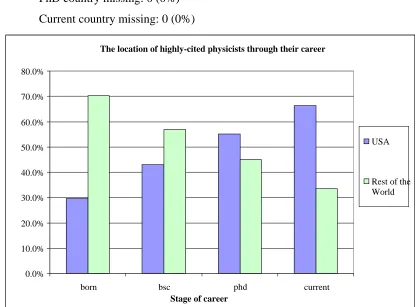
The percentage of physicists present in each country shows a gradual
funnelling effect towards the USA (Table 2 and Figure 1). At birth, 29.7% of
physicists are in the USA. This increases to 43.4% at first degree, to 55.1% at PhD,
and to 67.1% presently. The proportion in the 2nd and 3rd-ranked countries falls by
approximately 3 percentage points from birth to present day, with the share through
time in the rest of the world falling dramatically from 56.4% at birth to only 19.6%
presently.
Overall, 44% of scientists have moved since birth, 33% since their first
degree, and 27% since their PhD. These proportions are in fact only a little different
from those of Ioannidis (2004) who, on a much smaller sample, found 50% of
physicists had moved since birth. We have data on 158 physicists compared to 46 in
Ioannidis’s work.
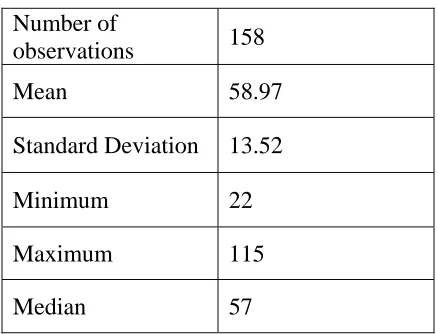
The summary statistics for the individuals’ h-index scores can be seen in Table
3. The mean h-index over the sample is 58.97. The minimum and maximum values
are 22 and 115 respectively.
In order to examine the effect of co-authorship, the number and countries of
the co-authors of ten randomly selected physicists in the sample were examined. The
average number of co-authors for each of the ten varies enormously and the number
of affiliated countries from 1 to 7.25. Although there is a tendency for those with
more co-authors to have higher h-indexes, the evidence is not substantial. This gives
us some reassurance in the decision to not try to adjust h-indexes for co-authorship.
For our sample, we compared these h-index results with the physicists’ total
number of published papers, total citations, and average citation count per-paper. For
the h-index, there is no correlation with the last of these, average citations per article.
But there is a significant positive correlation of 0.40 with total number of published
papers, and of 0.54 with total citations. People with a high h-index also score highly
on these two criteria.
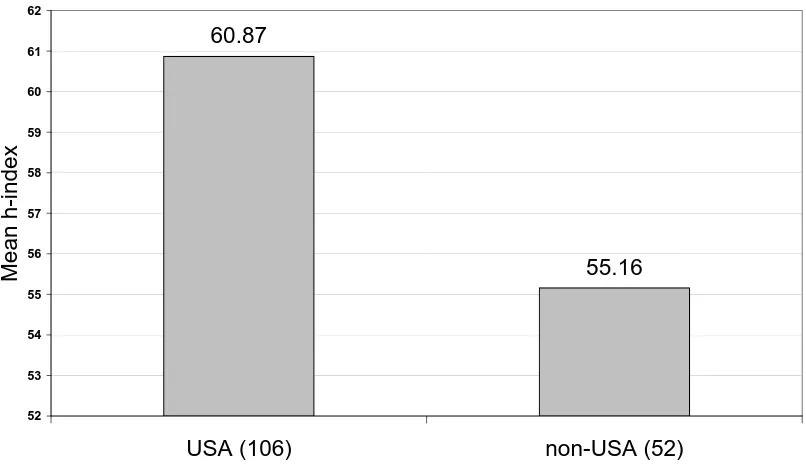
Figure 2 shows that those currently in the USA have an h-index which is on
average 5.71 higher than those in non-USA institutions. This difference -- one that
continues to hold weakly when we adjust the data using regression equations -- is
close to statistically significant at the 5% level. There are several possible reasons for
We now separate the sample into those who have migrated and those who
have not. Whether we work with the periods since birth, BSc. or PhD, we find no
statistically significant difference in productivity as measured by an h-index (Table 4).
There is no way of measuring the productivity levels in the alternative situation.
However, Figure 2 suggests that there are country-specific effects.
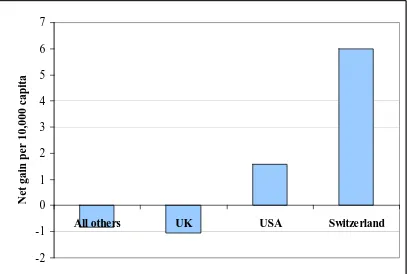
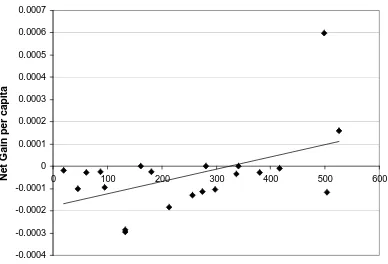
A natural question for economists is how effectively the rich countries draw in
others’ top scientists. Figure 3 demonstrates this for Switzerland and the USA. Figure
4 reveals a relationship between the net gain in physicists and the R&D adjusted GDP
per capita. The correlation coefficient is then 0.49, significant at the 5% level.
Physicists migrate toward richer countries, although the definition of rich should be
adjusted to mean rich in R&D funding. Data on the level of physics funding would be
still better, but we found it too hard to obtain data consistently across nations.
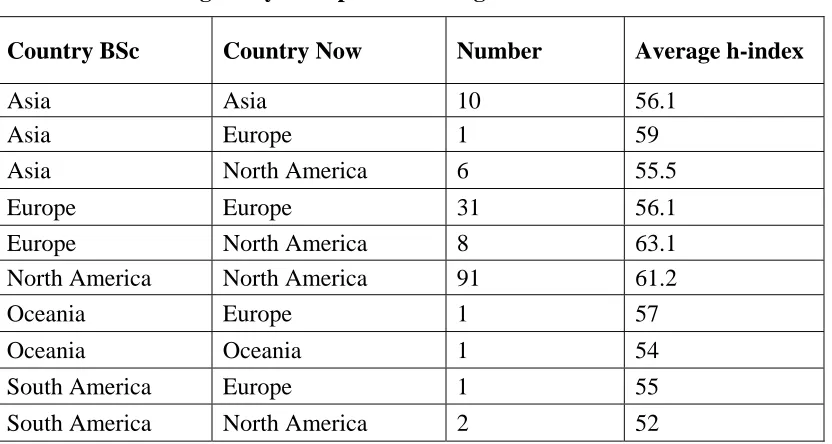
Figures 5a and 5b depict the productivity levels between continental8
migratory groups, looking at differences between country of first degree and present
affiliation. Table 5 gives fuller data. Those individuals who emigrated from Europe
to North America emerge as the most productive with an average h-index of 63.1.
Those who remained in North America are the second most productive group: their
h-index is 61.2. The final three major groups -- those who remained in Europe,
remained in Asia, and moved from Asia to North America -- have average h-index
scores of 56.1, 56.1 and 55.5, respectively. The only statistical significance at the 5%
level here is between those who remained in North America and remained in Europe.
There are other migratory groups, within the sample, with only a couple of
representatives. This means that meaningful averages could not be constructed.
It seems interesting to note that no physicist left North America nor remained
in South America. The European physicists who moved to North America have
productivity levels more in line with those of the natives than those left in Europe.
The two Asian values are statistically the same.
Some caution should be shown when looking at these results. First, the
sub-samples are small, especially for movers. Only 8 Europeans migrated to North
America while 91 remained in North America.
To this point, we have shown only raw patterns in the data. We now turn, in
Table 6, to regression equations. The dependent variable here is at first, in the upper
8
part of the table, the logarithm of the scientists’ h-indexes. In the lower half of the
table, it is the log of total citations to their work.
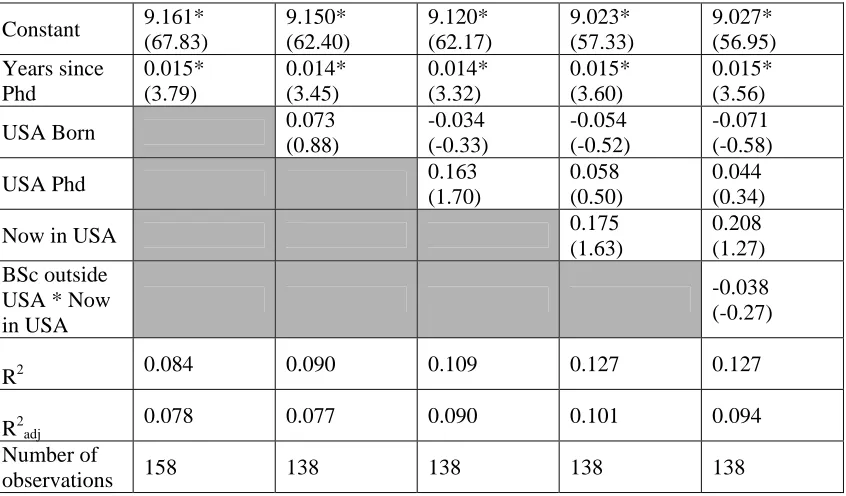
Going from left to right, the columns of Table 6 gradually build up from a
simple to a fuller regression specification. Older people tend to be more cited; this is
to be expected merely because career length affects the period over which citations
can be accrued. Having ten additional years after the year of the PhD increases a
physicist’s h-index by 6%. Being born in the United States has a statistically
insignificant effect. Residing in the US, however, does have a positive coefficient; it
is associated9 with an h-index approximately 13% higher. Nevertheless, this effect
loses statistical significance by the final column of Table 6. In these regression
equations, the adjusted R-squared values are fairly low.
Table 6 includes a simple direct test for an interaction effect. Are those who
were educated initially outside the United States, but now reside in the USA, more
productive (in the sense of having higher h-index scores)? No, not than Americans.
In the final column of Table 6, it can be seen that the coefficient on the variable ‘BSc
outside the US* Now in USA’ is approximately -0.02 with a t-statistic of -0.25.
Hence it is essentially zero. Migrant elite physicists into the United States do not
have an h-index that differs, ceteris paribus, from the h-index of home-grown elite
physicists.
The tenor of these conclusions is replicated for the lower panel, using instead
Log of Total Citations as the dependent variable, in Table 6.
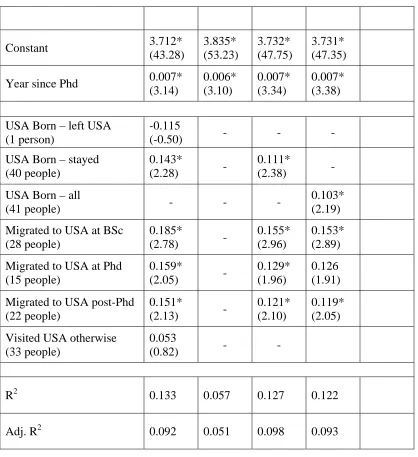
Table 7, following a referee’s suggestion, does a further check. It breaks the
data down by the time point of migration to the United States. Interestingly, whatever
the stage at which someone migrated, their h index is approximately the same as that
of those physicists born in the US. The null of equality of the various key
coefficients, as in column 1 of Table 7, cannot be rejected at conventional
significance levels. Here the size of effect in the h-index regression equation is
fractionally larger than in Table 6’s estimates; it varies from 14% to 19%.
The results provide a little evidence that some groups are more productive
than others, and in particular that everyone working in the United States tends to have
a higher h citations score. However, the reasons for this are more ambiguous. As
previously mentioned, there is no clear causal relationship between migration and
9
productivity. Put into context, migrating to the USA may make you more productive
(direction one) but also the most productive people may be those who are offered jobs
in the USA (direction two). Another, and a more sociological, possibility is that those
in the American scientific circuit simply cite each other 13%-19% more. All three
arguments are plausible, perhaps jointly play some role, and have implications for
discussions on the brain drain. Yet with these data it is not possible to distinguish
among them.
If direction one is the overriding influence then the world body of scientific
knowledge gains from the migration because of the increase in productivity.
However, there are further implications for the country left if the field stagnates or
disappears. If direction two is the overriding influence, then the USA is taking the
best physicists, although it already had a large portion of them. It is the success of
this home-grown group of US physicists that suggests it is the resources in the USA
that make their physicists the most-cited. Even so, there are other explanations for
this apparent difference in productivity, not related to aiding priority, namely that
there are possible biases in the productivity measure. There are suggestions that
US-based scientists disproportionately cite other US-US-based scientists (Leimu and
Koricheva 2005). However, Wong and Kokko (2005) indicate that this is in fact a
location bias: Europeans also disproportionately cite other Europeans. A second
issue, regarding language, arises: the publications used for citation counts by the ISI
being substantially in English. This may reduce the citation counts of those who
publish in languages other than English (Van Leuween et. al. 2001), although articles
in local languages would also be cited less as they are accessible to fewer readers.
Van Leuween et al argue that the research impact of countries such as Germany and
France would increase if more foreign publications were accounted for.
To investigate whether h-index productivity relates to other measures of
productivity, we compared each country’s h-index rank to its patent productivity rank
and its general productivity growth rates.
The results are that h-index rank positively correlates (0.66) with patent rank
and with overall productivity for the majority of the countries (0.66, excluding
Finland and Italy). Hence those countries with the highest average h-indexes also
tend to have higher productivity measured in other ways. The patent productivity
finding seems particularly relevant as it also measures R&D in which physicists are
analysis suggests that the higher level of productivity shown in the US data is not
substantially due to a US/English bias.
A natural question is whether the paper’s finding of approximately equal
productivities for migrants and non-migrants holds for elite scientists in other
disciplines.
The only other data available to us are for bio-scientists. Again, these use ISI
highly-cited scientists as the sample. Appendix Table A4 shows that, as with physics,
it appears that movers and stayers have similar h-indexes. Further discussion for
bio-sciences is contained in the unpublished report by Warwick University (2007).
Finally, a high level of elite mobility has also recently been reported for young
economists in Oswald and Ralsmark (2007). Figure A1 reveals that in the top-10 US
departments of economics approximately 75% of assistant professors did their first
degree outside the United States. This is consistent with, although necessarily not
precisely comparable to, the findings from our data on senior physicists.
8. Conclusions
This paper attempts to contribute to knowledge about the nature of the elite brain
drain. It draws five conclusions.
First, the United Kingdom currently wins fewer Nobel Prizes in science than it
used to10, and the United States garners many more. What is less widely known is
that, in both the UK and the United States, immigrant scientists win the Prize less
often, proportionately, than in earlier decades. Second, by charting the careers of a
group of distinguished physicists, we show that they are strikingly mobile. Almost
half of the highly-cited scientists in our sample are migrants: our 158 physicists were
born in 32 countries but now live in only 16. Approximately 30% migrated after their
first degrees, and went predominantly to the US. Third, among highly-cited
physicists the average productivity (as measured by a citations h-index) of movers is
not different from that of stayers11. We are unable, with our data, to say whether
migration itself causally increases a scholar’s productivity, but it might be argued that
10
Nevertheless, as a referee has emphasized to us, the UK still does well in most sciences by the standards of other European countries.
11
our results are consistent with Waldinger’s (2008) finding that -- except for coauthors
-- there are no strong externality effects among senior scholars. Fourth, international
flows of physicists between first degree and the present day demonstrate that top
scholars head to countries with high levels of R&D spending. Switzerland and the
USA are the world’s large importers, per capita, of elite physicists. CERN in
Switzerland must play some role here, but, because of difficulties caused by multiple
affiliations, we have not attempted to separate out those scientists. Fifth, we find
evidence, from regression equations in Tables 6 and 7, that among elite physicists a
current affiliation in the USA is associated with a 13%-19% higher h-index. This
may be a genuine productivity difference, or reflect some form of pro-US citations
bias, or some mixture of the two.
How, conceptually, can we make sense of the data? One way to view the
findings on physicists is as supporting a theoretical model in which in the modern
globalized world the costs of migration are low. Intuitively, the idea is the following.
Consider a world with very high costs -- whether because of cultural differences
across societies, or costly travel, or poor communication -- of switching between
countries. Then only the very best workers will migrate. This is because they alone
are the ones who will make a big enough return from international labour mobility to
outweigh the high costs. In that case, migrants will be disproportionately from the top
end of the ability distribution. They will be outstanding scientists with, in our
terminology, particularly large h-indexes. Now contrast this with the case of low
mobility costs. In that case, elite scientists of more average kinds of abilities, like the
norm within the country into which they migrate, will find it rational to choose to
switch nations. Hence mobile incoming scientists will be of similar quality to the
average of those in the receiving nation, and most of these newcomers will not go on
to win science prizes in the way that happened in an older world -- think of an early
20th century setting of ocean liners and telegrams -- where mobility costs were high12.
Any increases through time in the wage premium (p in our earlier notation) earned by
distinguished scientists in the rich receiving countries will act to reinforce these
tendencies.
12
References
Baldwin, R.E. and Winters, L.A. (2004). Challenges to Globalization: Analyzing the Economics. Chicago: University of Chicago Press.
Bekhradnia, G. and Sastry, T. (2005). ‘Brain drain: Migration of academic staff to and from the UK.’ HEPI Paper 19. Higher Education Policy Institute, Oxford.
Beine, M., Docquier, F. and Rapoport, H. (2001). ‘Brain drain and economic growth: Theory and evidence.’ Journal of Development Economics, vol. 64, no. 1, pp. 275-89.
Beine, M., Docquier, F. and Rapoport, H. (2008). ‘Brain drain and human capital formation in developing countries: Winners and losers.’ ECONOMIC JOURNAL, vol. 118, no. 528, pp. 631-52.
Bhagwati, J.N. and Hamada, K. (1974). ‘The brain drain, international integration of markets for professionals and unemployment: A theoretical analysis.’ Journal of Development Economics, vol. 1, no. 1, pp. 19-42.
Carayol, N. and Matt, M. (2005). ‘Individual and collective determinants of academic scientists’ productivity.’ Information Economics and Policy, vol. 18, pp. 55-72.
Charlton, B.G. (2007). ‘Scientometric identification of elite 'revolutionary science' research institutions by analysis of trends in Nobel prizes 1947-2006.’ Medical Hypotheses, vol. 68, pp. 931-4.
Commander, S., Kangasniemi, M. and Winters, L.A. (2004). ‘The brain drain: Curse or boon? A survey of the literature.’ In Baldwin and Winters (2004), pp. 235–78.
Constant, A.F. and D’Agosto, E. (2008). ‘Where do the brainy Italians go?’, IZA paper 3325. IZA Discussion Paper series; Institute for the Study of Labour.
Cronin, B. and Atkins, H.B. (2000). The Web of Knowledge. Medford, New Jersey: Information Today, Inc.
Dietz, J. and Bozeman, B. (2005). ‘Academic careers, patents, and productivity: Industry experience as scientific and technical human capital.’ Research Policy, vol. 34, pp. 349–67.
Editorial (2007). ‘In praise of the brain drain.’ Nature, vol. 446, p.231.
Egger, H., Falkinger, J. and Grossmann, V. (2007). ‘Brain drain, fiscal competition, and public education expenditure.’ IZA paper 2747. IZA Discussion Paper series; Institute for the Study of Labour.
Einstein, A. (1934). The World as I See it. English translation, Carol Publishing Group Edition (1999). USA: Carol Publishing Group.
Grossman, V. and Stadelmann, D. (2008). ‘International mobility of the highly skilled, endogenous R&D, and public infrastructure investment.’ IZA paper 3366. IZA Discussion Paper series; Institute for the Study of Labour.
Henrekson, M. and Waldenstrom, D. (2007). ‘Should research performance be measured unidimensionally? Evidence from rankings of academic economists.’ Working paper, Research Institute of Industrial Economics, Stockholm.
Hirsch, J. E. (2005). ‘An index to quantify an individual’s scientific research output.’
Proceedings of National Academy Science, vol. 102, no. 46, pp. 16569-72.
Hunter, R. (2007). Dissertation, Department of Economics, Warwick University.
Ioannidis, J.P.A. (2004). ‘Global estimates of high-level brain drain and deficit.’ The Journal of the Federation of American Societies for Experimental Biology, vol. 18, pp. 936-9.
Ionescu, A. and Polgreen, L. (2009). ‘A theory of brain drain and public funding for higher education in the U.S.’ American Economic Review, May 2009 (Papers & Proceedings), forthcoming.
Institute for Scientific Information (ISI). Highly Cited Physicists [online]. Available from: www.isihighlycited.com [originally accessed October 2006].
Johnson, J. M. and Regets, M. (1998). ‘International mobility of scientists and engineers to the United States - Brain drain or brain circulation?’ National Science Foundation (June). NSF 98-316.
Kanbur, R. and Rapoport, H. (2005). ‘Migration selectivity and the evolution of spatial inequality.’ Journal of Economic Geography, vol. 5, no. 1, pp. 43-57.
Kuhn, P.J. and McAusland, C. (2006). ‘The international migration of knowledge workers: When is brain drain beneficial?’ IZA paper 2493. IZA Discussion Paper series; Institute for the Study of Labour.
Kwok, V. and Leland, H.E. (1982). ‘An economic model of the brain drain.’
American Economic Review, vol. 72, no. 1, pp. 91-100.
Laband, D. and Tollison, R.D. (2003). ‘Good colleagues.’ Journal of Economic Behavior and Organization, vol. 52, no. 4, pp. 505-12.
Laudel, G. (2003). ‘Studying the brain drain: Can bibliometric methods help?’
Scientometrics, vol. 57, no. 2, pp. 215-37.
Leimu, R. and Koricheva, J. (2005). ‘What determines the citation frequency of ecological papers?’ Trends in Ecology and Evolution, vol. 20, no. 1, pp. 28–32.
Levin, S.G. and Stephan, P.E. (1991). ‘Research productivity over the life-cycle: evidence for academic scientists.’ American Economic Review, vol. 81, no. 1, pp. 114-32.
Levin, S.G. and Stephan, P.E. (1999). ‘Are the foreign-born a source of strength for U.S science?’ Science, vol. 285, pp. 1213-4.
Machin, S. and Oswald, A. J. (2000). ‘UK economics and the future supply of academic economists.’ ECONOMIC JOURNAL, vol. 110, pp. F334-F349.
OECD (2000) Science, Technology and Industry Outlook 2000. Paris: OECD.
OECD. OECD Statistics v.4.2 [online]. Available from: http://stats.oecd.org/WBOS/ [accessed 18/02/2007].
Oswald, A.J. (2007a). ‘An examination of the reliability of prestigious scholarly journals: Evidence and implications for decision-makers.’ Economica, vol. 74, pp. 21-31.
Oswald, A.J. (2007b). ‘Comment on Summers on life sciences.’ Financial Times, January 29th.
Oswald, A.J. (2009). ‘World-leading research and its measurement.’ Warwick Economics Research Paper #887. Warwick University.
Oswald, A.J. and Ralsmark, H. (2007). ‘Some evidence on the future of economics.’
Royal Economic Society Newsletter, July.
Pierson, A.S. and Cotgreave, P. (2000). ‘Citation figures suggest that the UK brain drain is a genuine problem.’ Nature, vol. 407, pp. 13.
Regets, M. (2001). ‘Research and policy issues in high-skilled international migration: A perspective with data from the United States.’ IZA discussion paper 366. IZA Discussion Paper series; Institute for the Study of Labour
Royal Society (1963). ‘Emigration of scientists from the United Kingdom: Report of a committee appointed by the Council of the Royal Society.’ London: Royal Society.
Saint-Paul, G. (2004). ‘The brain drain: Some evidence from European expatriates in the United States.’ IZA paper 1310. IZA Discussion Paper series; Institute for the Study of Labour.
Starbuck, W.H. (2005). ‘How much better are the most-prestigious journals? The statistics of academic publication.’ Organization Science, vol. 16, pp. 180-200.
Stephan, P.E. (1996). ‘The economics of science.’ Journal of Economic Literature, vol. 34, no. 3, pp. 1199-235.
Stephan, P.E. and Levin, S.G. (2001). ‘Exceptional contributions to US science by the foreign-born and foreign-educated.’ Population Research and Policy Review, pp. 59-79.
Summers, L.H. (2007). ‘America must not surrender its lead in life sciences.’
Financial Times, January 29th.
Universities UK (2007). ‘Talent wars: the international market for academic staff.’ Policy Briefing, July.
Van Leeuwen, T.N., Moed, H.F, Tijssen, R.J.W, Visser, M.S and Van Raan, A.F.J. (2001). ‘Language biases in the coverage of the Scientific Citation Index and its consequences for interpretational comparisons of national research performance.’
Scientometrics, vol. 51, no. 1, pp.335-346.
Van Raan, A.F.J. (2000). ‘The Pandora’s box of citation analysis: Measuring scientific excellence – The last evil?’ in Cronin and Atkins (2000)
Waldinger, F. (2008). ‘Peer effects in science: Evidence from the dismissal of scientists in Nazi Germany.’ Working paper, London School of Economics.
Warwick University (2007). ‘Elite universities and the global brain drain.’ conference paper presented at the Second International Conference on World-Class Universities, Shanghai.
Weinberg, B.A. (2009). ‘An assessment of British science over the 20th century.’ In press.
Weinberg, B.A. and Galenson, D.W. (2005). ‘Creative careers: The life cycles of Nobel laureates in economics.’ Working paper #11799, USA: NBER Working Papers Series
Wong, B. and Kokko, H. (2005). ‘Is science as global as we think?’ Trends in Ecology and Evolution, vol. 20, no. 9, pp. 475-6.
Zaiceva, A. and Zimmerman, K.F. (2008). ‘Scale, diversity, and determinants of labour migration in Europe.’ Oxford Review of Economic Policy, vol. 24, no. 3, Fall, pp. 428-452.
Table 1
The Number of Science Nobel Prizes Won by the United States Relative
to the United Kingdom (1947-2006)
1947-66 1967-86 1987-06
Proportion of UK-based Nobels as a % of US 44% 28% 8%
# Nobels won (US:UK) 45: 20 85: 24 112: 9
# Who were immigrants after their first degree 1: 1 3: 1 7: 0
# Who were immigrants after their doctorate 10: 2 22: 5 14: 0
Percentages of laureates who were immigrants 24%: 15% 29%: 25% 19%: 0%
#UK migrants to USA who won a Nobel 0 5 5
Notes
(i) US relative to UK numbers are expressed in this table as X: Y
(ii) The population of the US is now approximately fivefold that of the UK, so on arithmetical grounds in the current era the expected ratio is 5:1.
Source
Table 2
The International Distribution of Highly-Cited Physicists at Each Career Stage from Birth to the Present (% shares)
At birth
(32 countries)
At BSc.
(30 countries)
At PhD
(22 Countries)
Now
(16 countries)
1st USA (29.7%) USA (43.0%) USA (55.1%) USA (67.1%)
2nd UK (10.9%) Germany
(8.6%) UK (8.9%) Germany (7.6%)
3rd Germany
(9.4%) UK (7.9%)
Germany (8.2%)
Switzerland (5.7%)
Others 50.0% 40.2% 27.8% 19.6%13
Notes
The top left-hand number of 29.7% means that at the point of birth the United States was home to 29.7% of those in our sample who would go on to become the world’s most distinguished physicists. Today, as shown in the top right-hand number, 67.1% of the 158 live and work in the United States.
13
Table 3
Summary Data on Physicists’ h-index Scores
Number of
observations 158
Mean 58.97
Standard Deviation 13.52
Minimum 22
Maximum 115
Table 4
Productivity Levels (as measured by physicists’ h-index levels) Between those who Moved Country and those who did not Move
Stage
Stayers
Average h-index if not moved country since the stage indicated
Movers
Average h-index if moved country since that stage
Statistically different?
Birth 60.69 57.66 No, t = -1.24
BSc. 60.04 59.21 No, t = -0.36
Table 5
Migratory Groups and Average h-index Scores
Country BSc Country Now Number Average h-index
Asia Asia 10 56.1
Asia Europe 1 59
Asia North America 6 55.5
Europe Europe 31 56.1
Europe North America 8 63.1
North America North America 91 61.2
Oceania Europe 1 57
Oceania Oceania 1 54
South America Europe 1 55
Table 6
Regression Equations on Physicists’ h-indexes and Total Citations
(t-statistics in brackets; * indicates significant at the 5% level)
Dependent Variable: Log of h-index
Constant 3.834* (53.23) 3.828* (48.39) 3.804* (48.71) 3.737* (44.92) 3.739* (44.62) Years since Phd 0.006* (3.10) 0.006* (2.73) 0.006* (2.55) 0.007* (2.96) 0.007* (2.94)
USA Born 0.037
(0.83) -0.049 (-0.88) -0.063 (-1.14) -0.071 (-1.10)
USA Phd 0.131*
(2.56)
0.058 (0.95)
0.051 (0.75)
Now in USA 0.121*
(2.13)
0.137 (1.59) BSc outside
USA * Now in USA
-0.0186 (-0.25)
R2 0.057 0.060 0.104 0.134 0.134
R2adj
0.051 0.046 0.084 0.107 0.101
Number of
observations 158 138 138 138 138
Dependent Variable: Log of total citations
Constant 9.161* (67.83) 9.150* (62.40) 9.120* (62.17) 9.023* (57.33) 9.027* (56.95) Years since Phd 0.015* (3.79) 0.014* (3.45) 0.014* (3.32) 0.015* (3.60) 0.015* (3.56)
USA Born 0.073
(0.88) -0.034 (-0.33) -0.054 (-0.52) -0.071 (-0.58)
USA Phd 0.163
(1.70)
0.058 (0.50)
0.044 (0.34)
Now in USA 0.175
(1.63)
0.208 (1.27) BSc outside
USA * Now in USA
-0.038 (-0.27)
R2 0.084 0.090 0.109 0.127 0.127
R2adj
0.078 0.077 0.090 0.101 0.094
Number of
Table 7
Alternative Regression Equations on Physicists’ h-indexes
(t-statistics in brackets; * indicates significant at the 5% level)
Dependent Variable: Log of h-index
Constant 3.712*
(43.28) 3.835* (53.23) 3.732* (47.75) 3.731* (47.35)
Year since Phd 0.007*
(3.14) 0.006* (3.10) 0.007* (3.34) 0.007* (3.38)
USA Born – left USA (1 person)
-0.115
(-0.50) - - -
USA Born – stayed (40 people)
0.143*
(2.28) -
0.111*
(2.38) -
USA Born – all
(41 people) - - -
0.103* (2.19)
Migrated to USA at BSc (28 people)
0.185*
(2.78) -
0.155* (2.96)
0.153* (2.89)
Migrated to USA at Phd (15 people)
0.159*
(2.05) -
0.129* (1.96)
0.126 (1.91)
Migrated to USA post-Phd (22 people)
0.151*
(2.13) -
0.121* (2.10)
0.119* (2.05)
Visited USA otherwise (33 people)
0.053
(0.82) - -
R2 0.133 0.057 0.127 0.122
Adj. R2 0.092 0.051 0.098 0.093
Notes:
• Sample size is again 138
Figure 1
The Funnelling of Elite Physicists Towards the USA
Sample Size: 158
Error: Country of birth missing: 20 (12.7%)
BSc country missing: 7 (4.4%)
PhD country missing: 0 (0%)
Current country missing: 0 (0%)
The location of highly-cited physicists through their career
80.0%
70.0%
60.0%
USA 50.0%
40.0%
Rest of the
30.0%
20.0%
10.0%
0.0%
phd current
born bsc
Stage of career
Figure 2
Mean h-index of Physicists by Current Geographical Location
60.87
55.16
52 53 54 55 56 57 58 59 60 61 62
USA (106) non-USA (52)
Mea
n
h-in
dex
Note
Figure 3
Brain-Drain Gains and Losses of Highly-Cited Physicists by Nation
-2 -1 0 1 2 3 4 5 6 7
All others UK USA Switzerland
N
et
g
a
in
p
er
10
,000
c
a
p
it
a
Figure 4
The Relationship Between R&D Expenditure per capita14 and Net Gain in Physicists
-0.0004 -0.0003 -0.0002 -0.0001 0 0.0001 0.0002 0.0003 0.0004 0.0005 0.0006 0.0007
0 100 200 300 400 500 600
Average R&D expenditure per capita
N
e
t G
a
in pe
r c
a
pit
a
Notes
Each dot is a separate country. The extreme top dot in the north-east of the diagram is Switzerland.
14
Figure 5a: The h-index Scores of Movers and Stayers in Europe and North America
8 people
91 people
31 people
52 54 56 58 60 62 64
Europe → North America Remained in North America
Remained in Europe
A
v
er
ag
e h
-i
n
d
e
x
Figure 5b: The h-index Scores of Movers and Stayers in Asia and North America
10 people
6 people
55.2 55.3 55.4 55.5 55.6 55.7 55.8 55.9 56 56.1 56.2
Remained in Asia Asia → North America
Av
erage h-inde
[image:36.595.96.502.487.717.2]Appendix
Appendix Table A1: Net Losses and Gains in Physics Researchers by Country
Country
Number after undergraduate BSc.
Number present day
Net gain
Net gain normalised by population
Australia 4 1 -3 -0.183
Austria 1 1 -1 -0.128
Brazil 1 0 -1 -0.006
Canada 5 2 -3 -0.112
China 2 1 -2 -0.001
Denmark 1 1 0 0.000
Finland 2 2 0 0.000
France 4 2 -2 -0.035
Germany 13 12 -2 -0.028
Greece 2 1 -1 -0.099
Hungary 1 0 -1 -0.095
India 2 0 -2 -0.002
Ireland 1 0 -1 -0.286
Italy 2 2 0 0.000
Japan 8 7 -1 -0.008
Rep. of Korea 1 0 -1 -0.024
New Zealand 1 0 -1 -0.029
Poland 1 0 -1 -0.027
Russia 2 0 -2 -0.013
Spain 2 1 -1 -0.026
Sweden 1 0 -1 -0.011
Switzerland 3 9 4 0.599
Turkey 1 0 -1 -0.018
UK 12 6 -6 -0.104
USA 65 106 39 0.158
Appendix Table A2: Comparison with Ioannidis (2004)
Finding This paper Ioannidis - physics Ioannidis - overall
Sample size 158 46 1523
Moved since birth 44 % 50 % 33 (approx.)
US-born scientists
who migrated 0 % - 2 %
Appendix Table A3: Summary Statistics – Highly Cited Physicists
Presently in the USA
Variable Observations Mean Std. Dev. Minimum Maximum
hindex 105 61.04 13.00 30 115
results 105 383.82 208.25 56 1248
avcite 105 57.52 36.56 15.74 216.84
totalcite 105 18458.52 13727.75 7409 135831
nocount 105 2.04 1.56 1 12
noinst 105 5.91 4.32 2 25
yborn 102 1947 9.928 1920 1976
ybsc 101 1968 9.39 1941 1986
yphd 105 1974 9.36 1947 1991
Presently not in the USA
Variable Observations Mean Std. Dev. Minimum Maximum
hindex 53 54.89 13.72 22 85
results 53 445.60 270.99 82 1314
avcite 53 47.08 34.33 4.95 179.48
totalcite 53 15591.47 6757.03 2355 32714
nocount 53 3.15 1.89 1 10
noinst 53 6.26 4.44 1 21
yborn 50 1945 8.31 1926 1974
ybsc 44 1968 7.86 1951 1983
yphd 53 1972 7.99 1955 1987
Appendix Figure A1: Measurement of the Brain Drain among Elite USA-Based Assistant Professors of Economics
Source: Oswald and Ralsmark (2007)
Distribution of where the Bachelor of Science was obtained
Outside USA 75%
USA 25%
Note
Appendix Table A4: The h-indexes of Highly-cited Bio-scientists Currently Working in the United States
Source: Warwick University (2007)
Sample size: 163
Birth to BSc Mean Lower bound
(95%)
Upper bound (95%)
Moved to US 88.60 70.51 106.69
Remained 89.67 82.80 96.54
BSc to PhD Mean Lower bound
(95%)
Upper bound (95%)
Moved to US 83.38 78.13 88.62